
 ?Mathematical formulae have been encoded as MathML and are displayed in this HTML version using MathJax in order to improve their display. Uncheck the box to turn MathJax off. This feature requires Javascript. Click on a formula to zoom.
Abstract
The rate of urbanization in the Amhara region has apparently increased over the past three decades and is now higher than that of any other region in Ethiopia. As cities expand, peri-urban farmers in the region are being compelled to abandon their landholdings, which is their life-long asset. Therefore, the aim of this study is to investigate the impact of urban expansion on the income of evicted peri-urban farmers in Injibara, Burie and Gish Abay cities of the Amhara regional state, Ethiopia. Using stratified sampling technique, primary data was collected from 393 households (197 evicted and 196 non-evicted). The endogenous switching regression model was employed to examine the impact of urbanization on the income of evicted farmers. The model’s output of ATT revealed that evicted farmers had a substantial reduction in yearly income of 9202.36 Ethiopian Birr as compared to their counterfactuals. In other words, eviction diminishes the annual income of evicted farmers by 26.73%. Furthermore, ATU results also confirmed that non-evicted farmers’ income would have decreased by 4666.78 Birr if they had chosen to be evicted, proving that eviction might have a negative impact on farmers’ income at any circumstance. Therefore, this study suggests that the government conduct a comprehensive socioeconomic and demographic evaluation before evicting indigenous farmers and that an alternative strategy be developed to mitigate the negative effects of eviction on peri-urban farmers.
PUBLIC INTEREST STATEMENT
The majority of the world’s population has continued to live in cities, and there has been a rapid urbanization process during the previous seven decades. In 1950, less than one-third of people lived in urban areas, and more than 70% of people lived in rural areas. 54% of people on the planet lived in urban areas in 2014. The urban population growth is anticipated to grow. The degree of urbanization varies widely between regions. Latin America and North America had high rates of urbanization in 2014 (at or over 80%), while Africa were largely rural, with urbanization rates of 40%. From 1950 to 2005, urbanization in Africa and Ethiopia increased from 14.5 to 37.9 and 4.6 to 16.1, respectively. Urbanization in Ethiopia is very low compared to Africa, but the annual rate of change within this period is 1.72% and 2.32%, respectively.
1. Introduction
In 1900, just 15% of the world’s population lived in urban areas. However, the picture transformed after 1950, when the pace of urban population growth accelerated rapidly, and by the year 2009, half of the world’s population lived in urban areas (Annez & Buckley, Citation2008). In 2016, an estimated 54.5% of the world’s population lived in urban settlements, and by 2030 urban areas are projected to house 60% of the population globally. Understanding the important urbanization trends that will emerge in the next few years is critical for implementing the 2030 Agenda for Sustainable Development and attempts to construct a new urban development framework (Bravo & Francia, Citation2018).
Urban population in Africa is expected to triple in the next 50 years, changing the profile of the region, and challenging policy makers to harness urbanization for sustainable and inclusive growth (Freire et al., Citation2014). These data indicate that African countries are urbanizing drastically. Due to both rural-to-urban migration and natural growth, most African cities have grown many times over the past few decades. In several African nations, a sizeable fraction of the majority of small and medium-sized citiesFootnote1 have expanded more quickly than the larger cities, also as a result of planning decisions (Lwasa, Citation2014).
Ethiopia has low level of urbanization even by African standard, with only about 19% of the people residing in urban areas, the country’s urban population is currently rising at a rate of roughly 4% per year, which is twice as fast as the rate for rural areas (HABITAT, Citation2017; Hamore, Citation2019; Mefekir Woldegebrel Tessema, Citation2017). According to United Nations (2015) some projections, Ethiopia’s urban population will triple over the course of the next 20+ years, growing at an extremely rapid rate of over 5% annually (HABITAT, Citation2011; Mefekir Woldegebrel Tessema, Citation2017).
Urbanization in Amhara regional state is growing faster compared to the national growth rate (see ). The region has towns, which have drastic urbanization, which is tremendous as compared with other towns even in the country (see ). Based on the forecast from 1994 to 2007 of national
Table 1. Percentage of Urban population in 2007 and projected percentages, 2017–37
Table 2. Population trend in large and medium towns of the regional state
census of Ethiopia, many of the towns in the regional state have a growth rate of more than 6% per year which is far above the national average of urbanization of 4% (Adam, Citation2014; Central Statistical Agency, Citation2013; Mohammed et al., Citation2020). Unprecedented urban population expansion in the region has led to a strong demand for urban land for construction of infrastructure, residential housing, and service provision. According to Amhara National Regional State Urban Development, Housing and Construction Bureau (Citation2017), more than 15,000 peri-urban farmers had their agricultural land expropriated, and the land was then given to 129,594 urban people through the lease system. As a result, cities have grown horizontally as a result of these demographic pressures. This will have far-reaching ecological, socio-economic and environmental consequences, especially to the urban peripheral areas. Particularly, the main challenge of the urbanization process is the rapid conversion of a large amount of prime agricultural land to urban land uses in the peri-urban areas. This trend will exacerbate further expropriation of farm households and may lead to food insecurity and social instability in the surrounding areas although the problem is worse in small and medium-sized cities.
Injibara, Burie and Gish Abay are medium-sized cities where urbanization is expanding more rapidly than the bigger metropolitan and capital cities where urbanization in the study areas is in a condition of fast horizontal expansion (Lwasa, Citation2014). Currently, these cities are expanding dramatically, and the demand of land for urban development program increases rapidly with non-existent urbanization process. In response to these, the government is taking large tracts from peri-urban areas. As a result, large numbers of local landholders who mainly engage in agricultural activity for their livelihood have been forced to lose their land rights (Achamyeleh, Citation2014). However, there is no sufficient empirical evidence that can address the problem related to urbanization and its impact on the evicted farmers. Despite the existence of few literatures in this regard (Wogedie, 2018; Gebeyehu et al., Citation2022; Mohammed et al., Citation2020), many scholars and researchers have a bias toward studying metropolitan areas, while neglecting or underestimating the impact of urban expansion on low-income households in small and medium-sized cities became more prevalent. Owing to bias and inadequate analysis of the problem, there is dearth of appropriate empirical evidence to address the issue of urbanization and its impact on the income of evicted farmers. So, there is a knowledge gap in academia on the current crisis and its magnitude that evictees are experiencing. This suggests that decision-makers tend to prioritize metropolitan cities over small and medium-sized urban outskirts. Yet, policies ensuring adequate and equitable compensation for these expropriated farmers remain critical (Z. Gebeyehu et al., Citation2022; Mohammed et al., Citation2020; Muluwork, Citation2014). Moreover, this study also contributes in filling methodological gaps in impact analysis. The majority of existing research studies employed propensity score matching (PSM) to examine how evicted peri-urban farmers were affected by urban expansion. However, the PSM technique has drawbacks, including the fact that it only takes into account an observable characteristic of the household, which can cause an endogeneity problem and also more likely to be affected by selectivity bias. These constraints may lead to over or under-estimations of the outcome variable. Hence, an endogenous switching regression model estimate can resolve every one of these issues and generate reliable results (Abdulai & Huffman, Citation2014 T. Hasebe, Citation2020). Therefore, a better understanding of the spatial and temporal dynamics of urban expansion and its impact on evicted small-scale farmer’s income with reliable estimation technique in the study area became essential. Hence, this research finding will considerably contribute as empirical evidence to the existing literature and academia when it comes to arguing the pros and cons of urban expansion, particularly in small and medium cities where its rate is higher compared to the larger cities. Empirical findings from this analysis are also helpful for other comparable towns in the country in general and in the region in particular due to homogeneity of towns in the region with similar policy intervention procedures. On top of that, this finding with other earlier ones, can serve as a starting point for future empirical research studies and also crucial for designing a win–win development strategy for the region’s urban development program as well as the sustainability of the evicted farmers.
2. Review of literature
2.1. Development Induced displacement
Several studies have empirically evidenced that urban expansion is most likely associated with spatial patterns of land use change of the peri-urban agricultural land that eventually forces people to displace from their original environments is often a life changing event (Bereket, Citation2020). Urban expansion process as one of the developments induced displacement phenomena nowadays is increasing pressures on land use change for the acquisition of land by the government due to urban population increases, rapid economic development, and increasing infrastructure requirements especially in the fast-growing economy (Jiang et al., Citation2013). In many of the developing countries urban expansion is at the expense of productive and fertile agricultural farmland and forest (Ibid).
2.2. Impact of urban expansion
An important feature of the global trend of urban expansion accompanied with rapid increase of population has negative and positive consequences. The positive perspectives given that when cities are properly managed, urban centers can play major role in providing employment, shelter and services as well as serving as centers of culture, learning and technological development, portals to the rest of the world, industrial centers for the processing of agricultural products and manufacturing, and places to generate income, increased peri-urban farm households’ income and consumption primarily through remittances, boost non-farm income for rural households (Debebe Belete, Citation2018; Leulsegged et al., Citation2012; Mohammed et al., Citation2020; Nguyen Thi & Philippe Lebailly, Citation2010). Through information exchanges and increased understanding of production-related skills, urban growth can have a favorable impact on the human capital building of rural areas (Haggblade et al., Citation2018). Its focus was the transfer of agricultural labor and growth of output and employment to the modern urban industrial sector through wages that is higher than subsistence agriculture. It also postulated that the city offers cost-reducing advantages in economic services.
Contrarily, other studies have shown that, due to urban-driven development processes, some or all of peri-urban farmers’ land has been lost forever and causes displacement, dislocation and segregation that result in social fabrics disorder (DFID, Citation2013). Urban growth that results in agricultural land loss may have a detrimental effect on peri-urban farm households’ income (Muluwork, Citation2014; Satterthwaite et al., Citation2010; Tassie Wegedie & Duan, Citation2018). Continuous pressure is placed on native peri-urban areas by annual urban housing construction and rapid urban growth. People in the expanded urban areas “live partially rurally and in locations where many residents are living, they are not socially or economically integrated”. They usually do not participate in the planning and design of resettlement and dislocation options as well as the distribution of associated costs or benefits (Carter et al., Citation1995).
2.3. Empirical literatures
Continuous urban expansion to its surrounding peripheral area consumes large amount of farmland throughout the world. For instance, due to rapid urbanization China loses close to one million hectares of cultivable farm land each year to accommodate various demands such as construction of roads, industrial buildings, and commercial centers and for residential purposes (Dayong N, Citation2004). This creates numerous challenges that may be beyond the capabilities of the economies of developing nations including the creation of job opportunities and provision of basic needs. Unlike the situation in the developed countries at comparable stages of development, the process of urbanization in the Third World Countries appears to be more a function of rural push factors than the urban pull factors (Adem, K. and Fenta, M., Citation2012).
Urban expansion disproportionately affects the livelihood of poor people by diminishing the natural resource available to them. After the acquisition of farmland, agricultural households often have to give up farming partly or entirely depending on how much land they have left. It was estimated that a loss of one hectare farmland corresponds to an average job loss of 13 people in the case of Vietnam and of 20 in the case of Hanoi ().
Urbanization in Ethiopia is neither participatory nor supportive of farmers who are forced to leave their land and property in periphery and thus has a negative impact on people livelihood where women and youth are the major victims (Gebeyehu et al., Citation2022). According to Gebeyehu et al. (Citation2022), the consumption expenditure of evicted households was decreased by 5936.92 Ethiopian Birr compared to non-evicted households. Besides the economic impacts, the displacement of suburban dwellers due to rapid expansion of urban centers also hassocial welfare and socio-cultural related effects on the life of the displaced people. Social welfare influences such as food insecurity and homelessness and socio-cultural influences like marginalization, the weakening of social bond between the displaced people which directly resulted from the dismantlement of the previously held social cohesion within the smallholders (Muluwork, Citation2014). Moreover, the nonfarm-based economic sector was not developed to absorb displaced farming communities. Therefore, the non-integrative type of urban development-induced displacement disturbs on those marginalized rural communities and forces them to live in poverty, food insecure and hopelessness (Mohammed et al., Citation2020). However, Wogedie (2018) found that using the PSM model of the nearest neighbor matching estimator result indicated that there is an insignificant difference in livelihood outcome of displaced farming community as compared to the non-displaced farming community.
2.4. Theoretical and Conceptual Framework of Urban expansion
Many theoretical analyses have sought to understand the reasons behind and impacts of urban expansion, especially on peri-urban agricultural communities. The three urban growth theories proposed by Barnes et al. (Citation2012) were useful for this study. According to the theory of population growth, an increase in the urban population either through natural growth or through rural-to-urban migration emerges to the city’s outskirts. According to the economic growth theory, increased per capita income and employment rates will raise demand for new housing units and related infrastructure. Also, the development of new industries on urban outskirts forced farmers to lost their land. The third factor is government development strategies that place an emphasis on using restrictive land use laws to promote urban development. This viewpoint contends that different approaches to managing land use and development may be impeding the economic and social phenomenon of urban periphery’s agricultural communities (Barness et al., 2001). In addition, the lack of appropriate planning policies and the failure to enforce such policies are the main causes of unrestrained urban expansion, which disturbs zoning structures (for residential, commercial, industrial, institutional and other land uses) and ultimately poses a threat to the agricultural populations of developing nations who live in the cities’ environs.
The sociological urban expansion hypothesis, on the other hand, placed a greater emphasis on the role that human action, social networks and social relationships have had in bringing about a variety of changes, including social, political, economic and others (Briassoulis, Citation2002). The human ecology ideas, proposed by Robert Park and Ernest Burgess in 1925 and linking behavioral patterns to their physical and social environments in urban and rural locations, were closely related to this theory. To be more precise, it is vital to see the following conceptual framework () which attempted to show driving forces, processes and effects of urban expansion on Peri-urban people.
Figure 1. Conceptual frame work for impacts of urban expansion.
3. Methodology
3.1. Description of the study area
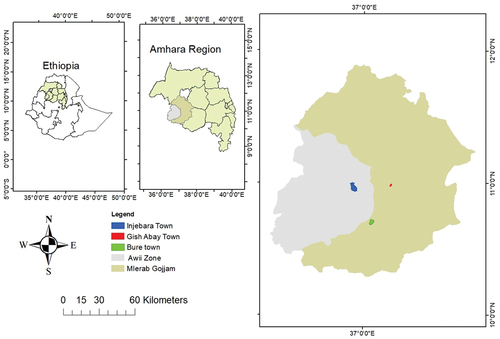
The study was conducted in urban areas of Amhara National Regional State (Injibara, Burie and Gish Abay) (). Injibara city is the administrative center of the Awi Zone in the Amhara Region and located at 420 km North-west of Addis Ababa (capital city of Ethiopia) and 135 km south-west of Bahir Dar (capital of Amhara region) and 10°57′N 36°56′E, at an elevation of 2560 m above sea level. Based on the 2007 census, Injibara has an estimated total population of 21,065 of whom 10,596 are males and 10,469 are females but is projected to be 56,723 by 2023 which increased by more than double in 15 years’ time. Modern Injibara was constructed since 1991 at a place called Kosober by locals, at the junction of highway from Addis Ababa to Bahir Dar and the road leading west towards Benishangul Gumuz regional state and towards the Grand Ethiopian Renaissance Dam. On the other hand, Bure is a town in western Ethiopia established in 1608. It is located in west Gojjam Zone of the Amhara Region and serves as the administrative center of Burie district. It has a geographical location of 10°42′0” N 37°4′0” E with an elevation of 2091 m above sea level. Bure enjoys a flourishing large business and connection point of businesses between Wolega, Gondar and Shewa. Moreover, it is one of the hubs of largest agricultural industrial parks of the country (Central Statistical Agency, Citation2013). Gish Abay is a town in west-central Ethiopia located in the West Gojjam Zone of the Amhara Region. It is the administrative center of Sekela woreda. The town is named after the nearby Mount Gish and the Abay River (Blue Nile) whose source is in the foothills of the mountain. The town is connected by a 39 km gravel road to Tilili, which is located on the main Addis Ababa—Debre Markos—Bahir Dar Road. The geographical location of the town is found with the coordinates of 10°59′N and 37°13′E with an elevation of 2,744 m above sea level (Central Statistical Agency, Citation2013).
Figure 2. Map of the study areas.
3.2. Data types and source
In order to attain the objective of this research, all required data were collected from both primary and secondary data sources. The primary data source was from a household survey using a pre-tested structured questionnaire by applying face-to-face interviews to reduce the nonresponse rate and incompleteness of data. Secondary data were collected from published and unpublished materials including websites.
3.3. Sampling technique and sample size
Multistage sampling procedures were employed to draw representative sample households of the study. In the first stage, three cities in Amhara National Regional state (Injibara, Burie and Gish Abay) were purposely selected. The cities represent the major urban expansion features (medium to small sized cities, fastest urban growing, establishment of industrial parks and residential places, convenient geographical location for multiple regional states and high trade and business connections, so that it became destiny of mass exodus of people) and are fast growing of urbanizing cities of Amhara National Regional state. In the second stage, peri-urban kebelesFootnote2 were identified from the respective city administrations. There are 5, 4 and 2 peri-urban kebeles in Injibara, Burie and Gish Abay cities, respectively. These kebeles were selected purposively. The reason for this is to take into account peri-urban kebeles with a large number of displacements. In the third stage, households’ lists in the selected kebeles were obtained from each kebeles’ administration. The list is stratified in to evicted and non-evicted farmers. Final sampling procedure was to select displaced and non-displaced farm households’ head. From 11 peri-urban kebeles, a total of 393 households (197 evicted and 196 non-evicted) farm households were selected randomly based on the proportions in the population (see ). The total required sample size is determined using (Kothari, Citation2004) formula;
Table 3. Distribution of sample households by municipalities
Where
n = sample size, z = the value of the standard variate at a given confidence level (z = 1.96 for 95% confidence level), P = sample proportion, q = 1-p and e = acceptable error (e = 5% or 0.05). N is the total number of households from which the sample is drawn.
Thus, the sample size of evicted households will be:
Thus, the sample size of non-evicted households will be:
Therefore, a total sample size of were selected randomly from the generated strata sampling frame from roasters of each kebele administration office proportional to the displaced sample size.
Dependent variable: is the total annual income of households obtained from agricultural activities, non-farm activities and off-farm activities. Independent variables definition and measurements are depicted in Table .
Table 4. Definition and measurement of independent variables
3.4. Methods of data analysis
3.4.1. Impact evaluation strategy: an Endogenous Switching Regression Model
A survey of recent literature shows that many impact assessment studies based on cross-sectional data have moved towards endogenously switching regression model (Kassie et al., Citation2014; Abdulai & Huffman, Citation2014). The assumption behind using endogenously switching treatment effect regression is that, in addition to the observed variables, there might be unobservable farm and/or household characteristics that could potentially influence the farmers’ eviction. A farm household self-selects into adopting eviction/non-eviction due to observable and unobservable variables. Estimating the impact of eviction on household income without accounting for this problem might suffer from potential endogeneity bias and thus the estimated results may over- or under-estimate impacts compared to the actual impact. To correct for this, endogenous switching regression analysis was used.
Under the Endogenous Switching Regression (ESR) framework, the impact of eviction on household income is estimated in two stages: the first stage concerns the likelihood to be evicted (the selection equation (equation 2)), and the second stage consists in the estimation of two regimes outcome equations: one for members and another one for non-members (equations 4 and 5) represented as follows:
where Y1 and Y2 represent the outcome for evicted farmer (regime 1) and non-evicted farmers (regime 2 respectively); Xi represents the vector of covariates of farmer i; β1 and β2 are parameters to be estimated; and ε1i and ε2i are error terms associated with the outcome variables. In the ESR framework, the error terms in the three Equationequations (2(2)
(2) , Equation3
(3)
(3) and Equation4
(4)
(4) ) are assumed to have a trivariate normal distribution, with zero mean and covariance matrix of the following form:
where is the variance of the error term in the selection Equationequation (2)
(2)
(2) ;
and
are the variances of the error terms in the outcome equations (3 and 4);
and
are the covariances of
, ε1i and ε2i. Covariance between ε1i and ε2i is not defined since Y1 and Y2 are not observed simultaneously (Maddala, Citation1996). The expected values of ε1i and ε1i conditional on the sample selection are non-zero because the error term of equation 2 is correlated with the error terms of the outcome equations 5 and 6:
where (.) is the standard normal probability density function;
(.) is the standard normal cumulative density function; and λ1i and λ2i are the inverse Mills Ratios (IMR) computed from Equationequation 1
(1)
(1) with λ1i =
and λ2i =
, and included in Equationequations 5
(5)
(5) and Equation6
(6)
(6) to correct for selection biases resulting from unobservable factors. Therefore, we have:
(evicted)
(non-evicted)
where δ1i and δ2i are error terms with conditional zero means. The full information maximum likelihood (FIML) method was applied to have consistent estimates (Greene, Citation2000; Lokshin & Sajaia, Citation2004). Furthermore, appropriate identification of ESR requires at least one variable in Z that does not appear in X. This variable represents the exclusion restriction necessary to fully estimate the model. The estimation of the selection Equationequation (2)(2)
(2) thus includes one potential instrument. A valid instrument is required to influence the farmer’s eviction but does not have any direct effect on the outcomes of interest. Proximity of agricultural land to urban areas was considered as a potential instrument. The intuition is that farmers with agricultural land near urban areas are assumed to be more vulnerable to eviction due to urban expansion. However, having agricultural land far distance from urban areas is less likely to be evicted. It is considered that the variable is likely to be correlated with the eviction of household but is unlikely to influence the outcome variable directly or correlated with the unobserved errors since proximity to urban areas do not directly improve the income of the household.
To check for the validity of this instrument, we ran a probit model for the selection Equationequation 2(2)
(2) and OLS regressions for outcome Equationequations (3
(3)
(3) and Equation4
(4)
(4) ) simultaneously and checked the significance of the instrument. From the assumptions on the distribution of the error terms (6), the derived log-likelihood function is specified as:lnL
where, =
, with j = 1, 2 and ρj(ρ1 =
δ1 and ρ2 =
δ2) being the correlation coefficient between the error term and ηi of the selection Equationequation (2)
(2)
(2) and, respectively, the error terms ε1i and ε2i of the outcome equations (3 and 4). If one of the estimates of correlation coefficients ρ1 and ρ2 is statistically significant, this would indicate the existence of selectivity bias due to unobserved factors depicting that endogenous switching regression model would be appropriate (Abdulai & Huffman, Citation2014). When ρ2 < 0, this implies a positive selection bias, indicating that farmers who have lower than average outcomes are more likely to choose to be non-evicted, whereas with δ1 v>0, this would suggest a negative selection bias. Moreover, if ρ1 or ρ2 have alternate signs, then the farmer chooses to be evicted based on their comparative advantage while if these correlation coefficients have the same sign, the significance level of ρ1 and ρ2 matters. If ρ1 is significant while ρ2 is insignificant, the farmers’ income is better off when they are evicted, while ρ1 is insignificant and ρ2 is significant, then the farmers are better off when they are non-evicted. The coefficients from the ESR model allow one to derive the average treatment effect on the treated (ATT). Specifically, the observed and unobserved counterfactual outcomes for evicted and non-evicted farmers can be computed as:
Equation 7 computes the observed outcome (a) for evicted farmers and equation 8 calculates the observed outcome (b) for non-evictees. The expected outcome (c) in equation 9 represents the counterfactual for the observed outcome (a) in equation 7. These counterfactual expresses what would have happened had the farmers be non-evicted. Similarly, equation 10 is a counterfactual outcome (d) for the observed outcome (b) in equation 8. It represents the scenario in which what would have happened if farmers were evicted. Using these expected outcomes (equations 7 to 10) we derive unbiased treatment effects: the average treatment effect on treat (ATT, which is the difference between equation 7 and 9 that is a − c), and the average treatment effect on untreated (ATU, which is the difference between equation 10 and 8 that is d − b).
4. Result and discussion
4.1. Demographic, socio-economic and institutional characteristics of sample households
As indicated in Table , the average age of evicted and non-evicted farm households was 40.4 and 37.32 years, respectively. The youngest and oldest respondents are, respectively, 21 and 72 years old. The survey results also indicate that the average years of schooling of the sample households was 3.61 with minimum and maximum schooling years of 0 and 12 respectively. The average education levels of evicted and non-evicted farmers were 2.94 and 4.18 years, respectively. The test statistics shows that there were significant differences between evicted and non-evicted farm households in terms of age and education level. The average family size of the sampled peri-urban farm households was 3.75 with dependency ratio of 0.93. In reference to the groups, the average family sizes were 3.88 and 3.62 for evicted and non- evicted farm households, respectively. The survey results showed that there was a statistically significant mean difference between the evicted and non-evicted groups in terms of family size and dependency ratio at 10% and 1% probability level, respectively.
Table 5. Demographic and socio-economic characteristics of the households
As shown in Table , the mean landholding sizes for the evicted and non-evicted sample households were found to be 0.16 and 0.92 ha per head, respectively. The maximum and minimum land-holding size of the respondents is 0 and 2 ha, respectively. The statistical analysis showed that there was a significant difference at the 1 percent probability level in the mean landholding size between evicted and non-eviced farm households. This indicates that evicted farm household’s landholding size has been significantly reduced as compared to non-evicted farm households as result of urban induced expansion. Similarly, the mean livestock holding of evicted and non-evicted farm households in the study areas were 2.01 and 2.22 tropical livestock unit (TLU), respectively. The survey result demonstrated that the mean differences between livestock holding among evicted and non-evicted farmers were not statistically significant. The mean distance of the market place from the respondent’s residence is 5.82 km with a maximum and minimum distance of 3 and 9 km, respectively. The mean distance of market place for evicted and non-evicted farmers is 6.02 and 5.62 km, respectively. Moreover, the average distance of credit institutions from the respondents is 5.3 km with a maximum and minimum distance 3 and 7 km, respectively. The mean distance of credit institutions for evicted and non-evicted farmers is 5.51 and 5.1 km, respectively. Both variable, distance from the market place and distance to credit institutions have no statistically significance differences for evicted and non-evicted farmers. Finally, the average total physical asset for the respondents is 67,094.53 birrFootnote3 with a maximum and minimum of 1,700 and 882,000 birr, respectively. The mean value for evicted and non-evicted farmers is 74,292.76 birr and 90,992.17 birr, respectively. There is no statistically significant difference between the evicted and non-evicted farmers in their mean of total physical asset value.
Table indicates that the average total annual income of the respondents is 31,228.61 birr with a maximum and minimum of 19,625 birr and 96,640 birr, respectively. The mean annual income of evicted and non-evicted farmers is 28,36797birr and 34,103.53 birr, respectively. The t-test statistics depicted that the mean difference between the evicted and non-evicted farmers in their mean annual income is significantly different at a 1 percent level of significance.
Table 6. Descriptive statistics of mean annual income by eviction status
4.2. Impact of eviction on peri-urban farmers: ESR Result
Table portrays that the ESR model was estimated using the full information maximum likelihood (FIML) approach which derives both the selection and outcome equations jointly. The first stage of the estimation of ESR regression is presented in columns (1), while the second stage of the estimation, i.e. estimation of separate outcome equations for evicted and non-evicted farmers, is reported in columns (2) and (3).
Table 7. Endogenous switching regression model output of household income
The exclusion restriction variable, proximity to urban, is statistically significant for the selection equation model and the negative coefficient (−0.2102) of the variable stated in Table confirms the expectation that households whose agricultural land nearer to urban areas are less likely to be non-evicted, i.e. as the distance between agricultural land of the household increases by 1 km from the urban areas, the likelihood of the farmer to be evicted will decrease by 21.02% compared to their counterparts. Meanwhile, the second stage of the FIML shows that the estimated coefficients of the correlation between farmers eviction and household income are all negative, but statistically significant only for the correlation coefficient (ρ2) between the outcome equation for non-evicted farmers and the selection equation, indicating that self-selection bias is occurred for non-eviction. Furthermore, the negative sign for ρ2 shows a positive selection bias for non-eviction, implying that farmers with higher-than-average yearly incomes are more likely to prefer to not being evicted and the model suggests that individuals who are non-evicted earn higher mean annual income than a random individual from the sample would have earned. Thus, being non-evicted may not have the same effect on the evicted if they choose to be non-evicted (Lokshin & Sajaia, Citation2004). This means that the null hypothesis, which indicated that the model had no sample selectivity bias, may be rejected. Hence, the presence of sample selectivity bias implies that both observed and unobserved factors influence the decision to participate in farmer eviction. The statistically insignificant covariance estimate for evicted households (ρ1) suggests that in the presence of eviction, there would be no significant difference in the average behavior of the two categories of farmers caused by unobservable factors.Footnote4 Generally, due to urban expansion and other related development-induced interventions, evicted farmers who dispossessed their agricultural land will no longer be better off in their annual income earnings compared to their counterparts. This finding is consistent with other earlier studies by (Gebeyehu et al., Citation2022; Mohammed et al., Citation2020; Weldearegay et al., Citation2021).
Outcome equations from the ESR regressions show that evicted farmers total annual income is significantly determined by the age, land size, education, family size of the household, and tropical livestock unit (TLU). Results of the ESR also exhibit some differences in the determinants of household income for evictees and non-evictees. For evicted farmers, the main variables that affect significantly of their total annual income are age of the household head, land size of the household, family size of the household and education level. Meanwhile, the household income of non-evicted farmers is influenced by age, land size, education and tropical livestock unit (TLU).
The ESR model produces mean outcomes on treated households and corresponding counterfactual outcomes, i.e. what would have been the outcome had the treated group not received the treatment. The average treatment effect on treated (ATT) is the net difference between these two outcomes. Similarly, the model also produces the mean outcome of the control group (non-evictees) and its counterfactual, i.e. what would have been the mean outcome had the control group received the treatment. The difference between these last two outcomes produces the average treatment effect on untreated (ATU). These average outcomes and the estimated ATT and ATU are presented in Table . The estimates portray that the treatment effect for evictees due to urban expansion on households’ total annual income is negative and significantly different from zero. The ATT is −9202.36 indicating that evicted farmers mean annual income had been declined by 9202.36 Ethiopian birr or by 26.73% due to horizontal urban expansion. However, had non-evicted decided to be evicted, their mean annual income would have been decreased by 4666.78 Ethiopian birr. This implies that had the non-evicted farmers decided to be evicted, their annual income would decline by 11.8% per annum. On top of these, the heterogeneous effect of urban expansion on evicted farmers can be estimated by taking into account all observable and unobservable household characteristics of the sample respondents. As a result, the transitional heterogeneous effect is defined as the difference between the ATT and ATU. According to this finding, the transitional heterogeneity of urban expansion on evicted farmers’ annual income is −4535.58 birr implying that being evicted can reduce annual income by 4535.58 birr, or 14.4%. This finding is in conformity with the findings of (Muluwork, Citation2014; Tassie Wegedie & Duan, Citation2018). Other researchers finding revealed that development induced urban expansion brings significant and negative impact on the displaced farm households’ welfare. For example, the study conducted by Gebeyehu et al. (Citation2022) in Bahir Dar, Gondar and Dessie metropolitan cities of Ethiopia and analyzed using PSM method, they found that on average, the displaced farm households’ consumption expenditure per adult equivalent was reduced by 6688.03 Ethiopian Birr. Moreover, the findings of Dejene (Citation2011) conducted in Sebata town of Ethiopia showed that urban expansion during the last few years made significant impacts on livelihood of farming community on peri-urban area: agricultural land fragmentation, land insecurity, and loss of farmer’s property on the land.
Table 8. Summary of predicted values for total income for evicted and non-evicted
Field research on expropriation in China documents that unemployment and low income are common among land-lost farmers, mainly due to their low educational level and their lack of experience in non-agricultural work. The studies give evidence that land expropriation led to the loss of subsistence, interruption of economic activities, psychological distress and land conflicts among farmers, whose land was expropriated (Jacoby et al., Citation2002). People are affected emotionally, culturally or spiritually by the loss of their land (Chi et al., Citation2013).
5. Conclusion and policy implications
This paper used household-level data to examine the impact of urban expansion on evicted farmers' income levels in the peri-urban areas of Injibara, Burie and Gish Abay cities of Amhara region, Ethiopia. Comparisons of mean annual income between evicted and non-evicted farmers revealed some significant differences. However, knowledge of average differences is not sufficient to understand the eviction decisions across a sample of farmers, since they do not account for the effect of other characteristics of farmers. We therefore modeled eviction as a selection process, where the expected disadvantages to the treatment drive farmers’ decisions. Specifically, we employ an endogenous switching regression approach to account for selectivity bias, and to capture the differential impact of eviction on evicted and non-evicted farmers. The result showed that sample selection bias would result if the outcome equations (total annual income) were to be estimated without considering the eviction decision. Thus, eviction may not have the same effect on the non-evicted if they were evicted. Furthermore, a positive selection bias was observed for the non-evicted outcome variable, suggesting that peri-urban farmers tend to prefer to be non-evicted.
The study also revealed that the average treatment effect on the treated (ATT) is −9223.36 Birr, implying eviction resulted in a substantial reduction in mean annual income of about 26.37%, while the average treatment effect on the untreated is −4666.78 Birr, which depicts that, had the non-evicted farmers preferred to be evicted, their mean income would decline by 14.9%. Therefore, eviction has negative impact on the income of peri-urban farmers. According to this research, the income of evicted peri-urban farmers may be significantly impacted by development-induced urban expansion, which could result in a reduction in their livelihood and a move towards poverty. The causal effect of eviction which lowers the earnings of peri-urban farmers serves the potential consequence of worsening the rural–urban dichotomy and indirectly exacerbating rural poverty in urban fringes.
In general, from the above conclusion we can draw the following policy implications for the concerned stakeholders. Urban development Programmes that have an impact on the adjacent farmers must be participatory, allowing them to participate and have a saying while ensuring shared benefits. Hence, the farming community whose land is to be expropriated and, as a result, whose livelihood is to be disrupted, needs to be compensated appropriately when it is executed. Moreover, the government must closely track the impacted community’s post-eviction existence and offer support in accordance with their capacity and interests so that their families can secure their livelihood. Therefore, strong institutional support could be offered to evicted households in order to encourage them to create job opportunities, train people in various skills and knowledge, and organize financial institutions for loan service in order to create sustainable livelihood.
Eviction should only take place once this communities have received training on how to create urban enterprises and how to manage them under smaller and micro-industry entities where there is strong institutional follow-up. In addition, it is imperative to provide just compensation that is proportionate to the land they abandoned or the government should guarantee farmers the right to own land so that they can bargain and sell it at market value like they do for other assets.
Abbreviations
| ESRM | = | endogenous switching regression model |
| FIML | = | full information maximum likelihood |
| ATT | = | average treatment effect on treated |
| ATU | = | average treatment effect on the untreated |
| TH | = | transitional heterogeneity |
Acknowledgments
The authors would like to thank, without implicating, the journal editor and two anonymous reviewers for valuable comments and suggestions that have substantially improved the paper. They would also like to thank Arba Minch University for funding this research for data collection.
Disclosure statement
No potential conflict of interest was reported by the authors.
Additional information
Notes on contributors

Tadele Alamneh
Tadele Alamneh is a PhD Scholar in Development Economics at Arba Minch University, Ethiopia. His areas of research interest include macro-economic analysis, efficiency analysis, livelihood analysis, impact analysis, and choice experiment. He has published many manuscripts in internationally reputable journals and presented his papers in more than 10 national and international conferences.
Melkamu Mada
Melkamu Mada is Associate professor of Economics, PhD, in the department of economics at Arba Minch University. He has published more than 25 articles in internationally reputable journals. His research interests include livelihood analysis, impact analysis, environmental valuation method analysis, and poverty analysis.
Tora Abebe
Tora Abebe has PhD in economics and serves as a lecturer for various economics courses and is supervisor of many post-graduate students at Arba Minch University, Ethiopia. His research interests include impact analysis, poverty analysis, and efficiency analysis. He has published several articles in internationally reputable journals.
Notes
1. Small sized city is urban area which has a population of below 100 thousand and medium city is urban places having population size ranging from 100 thousand to 500 thousand” according to definition of OECD (2022), Urban population by city size (indicator). doi: 10.1787/b4332f92en (Accessed on 28 February 2022).
2. Kebele is the smallest administrative unit in the country, Ethiopia.
3. Birr is the unit of currency in Ethiopia. It is subdivided into 100 santim (cents).
4. The necessary conditions for consistency are also fulfilled, since ρ2 > ρ1 in absolute terms, indicating that non-evicted farmers obtain higher mean annual income than they would if they did not be non-evicted (Lokshin & Sajaia, 2004).
References
- Abdulai, A., & Huffman, W. (2014). The adoption and impact of soil and water conservation technology: An endogenous switching regression application. Land Economics, 90(1), 26–20. https://doi.org/10.3368/le.90.1.26
- Achamyeleh, G., & Wiley, B. (2014). Land tenure in the changing peri-urban areas of Ethiopia:The case of Bahir Dar City. International Journal of Urban and Regional Research, 38(6), 1970–1984. https://doi.org/10.1111/1468.12123
- Adam, A. G. (2014). Land tenure in the changing peri-urban areas of Ethiopia: The case of bahir dar city. International Journal of Urban and Regional Research, 38(6), 1970–1984. https://doi.org/10.1111/1468-2427.12123
- Annez, P. C., & Buckley, R. M. (2008). Urbanization and Growth. Urbanization and Growth, 1–46. https://doi.org/10.1596/978-0-8213-7573-0
- ANRSUDHCB201. (2017). Amhara National Regionan State Constraction and Housing Buraeu Annual Report, Unpublished.
- Barnes, K., Morgan, J., Roberge, M., & Shannon, L. (2012). Sprawl Development: Its Patterns, Consequences, and Measurement: Department of Geography an Environmental Planning. Towson university.
- Bereket, G. K. (2020). Socio-cultural and economic impacts of development induced displacement on resettled people: The case of welkayt sugar factory in Tigray region, Ethiopia. International Journal of Sociology and Anthropology, 12(4), 94–103. https://doi.org/10.5897/ijsa2020.0875
- Bravo, L., & Francia, V. (2018). We the people, We the public space. An interactive exhibition at the 9th world Urbanforum. The Journal of Public Space, 3(1), 153–162. https://doi.org/10.5204/jps.v3i1.325
- Briassoulis, H. (2002). Analysis of land use changes: Theoretica and modeling approaches. Web Book- from http://wwwrriwvu.edu/Webbook/Briassoulis
- Carter, S. J., Ball, D. F., Baron, P. J., & Elliott, D. (1995). Environmental auditing: Management strategy. Business Strategy and the Environment, 4(2), 86–94. https://doi.org/10.1002/bse.3280040205
- Central Statistical Agency. (2013). Population projection of Ethiopia for all regions at wereda level from 2014 – 2017. Journal of Ethnobiology and Ethnomedicine, 3(1), 28. http://www.csa.gov.et/images/general/news/pop_pro_wer_2014-2017_final
- Chi, E., Hui, M., Jun, H., & Ling, X. (2013). Land use policy the policy and praxis of compensation for land expropriations in China: An appraisal from the perspective of social exclusion. Land Use Policy , 32, 309–316. CrossRef https://doi.org/10.1016/j.landusepol.2012.11.004
- Dayong, N. (2004). Several aAcute Issues in China's Uran Planninig. https://www.Lincolninstedu/pubs/pub-detailaspid872
- Debebe Belete. (2018). Projecting the implication of rapid Urban population growth on Urban facilities in Amhara region: An application of SPECTRUM Model. Developing Country Studies, 8(12), 40–47.
- DFID. (2013). DFID Human Development Dept operational plan 2013 . Department for International Develeopment.
- Freire, M. E., Lall, S., & Leipziger, D. (2014). Africa’s Urbanization: Challenges and Opportunities. The Growth Dialogue, 1, 1–27.
- Gebeyehu, Z., Haji, J., Berihun, T., & Molla, A. (2022). Urban expansion impact on peri-urban farm households welfare in Metropolitan cities of Amhara national regional State, Ethiopia. Ecology, Environment and Conservation, 28(1), 33–44. https://doi.org/10.53550/eec.2022.v28i01.005
- Greene, W. H. (2000). Econometric analysis 4th Ed.
- Haggblade, S., Boughton, D., Cho, K. M., Denning, G., Oo, Z., Sandar, T. M., Than, T. M., Eh, N., Aye, M., Wilson, S., Win, N. W., Wong, L. C. Y., Wilson, S., W, N. W., & Wong, L. C. Y. (2018). MYANMAR SECURITY in MYANMAR Steven Haggblade, Duncan Bough Khin Mar Cho. Tun Min Tin Maung Than, Naw Eh Mwee Ay.
- Hamore, A. A. (2019). Housing and settlement transformations in the surrounding peri-urban areas of Hosanna town: The cases of Ambicho and Kidigisa, Hadiya Zone, Ethiopia. February, 216.
- Hasebe, T. (2020). Endogenous switching regression model and treatment effects of count-data outcome. The Stata Journal, 20(3), 627–646. https://doi.org/10.1177/1536867X20953573
- Jacoby, H. G., Li, G., & Rozelle, S. (2002). Hazards of Expropriation: Tenure Insecurity and Investment in Rural China. The American Economic Review, 92(5), 1420–1447. https://doi.org/10.1257/000282802762024575
- Jiang, L., Deng, X., & Seto, K. C. (2013). The impact of urban expansion on agricultural land use intensity in China. Land Use Policy, 35, 33–39. https://doi.org/10.1016/j.landusepol.2013.04.011
- Kassie, G. W., Kim, S., Fellizar, F. P., Ho, B., Francisco, P., & Benamin, H. (2014). Determinant factors of livelihood diversification: Evidence from Ethiopia. 3(1).
- Kedir, A., & Mandefro, F. (2012). Urban Expansion and the Neighbourhood: The case of Bishoftu town, East Shewa one, Oromiya State, Ethiopia.
- Kothari. (2004). Research Methodology: Methods and Techniques (2nd Edition ed.). New Age International Publishers. [In ثبثبثب: Vol. ث ققثق (Issue ثق ثقثقثق)].
- Leulsegged, K., Gete, Z., Dawit, A., Fitsum, H., & Andreas, H. (2012). Impact of urbanization of Addis abeba city on peri-urban environment and livelihoods. Proceedings of the The Tenth Conference on Ethiopian Economy, Addis Ababa.
- Lokshin, M., & Sajaia, Z. (2004). Maximum likelihood estimation of endogenous switching regression models. The Stata Journal: Promoting Communications on Statistics and Stata, 4(3), 4(3. https://doi.org/10.1177/1536867x0400400306
- Lwasa, S. (2014). Managing African urbanization in the context of environmental change. Inter Disciplina, 2(2), 263–280. https://doi.org/10.22201/ceiich.24485705e.2014.2.46528
- Maddala, G. S. (1996). 19 Applications of limited dependent variable models in finance. Handbook of Statistics, 14, 553–566. https://doi.org/10.1016/S0169-7161(96)14021-9
- Mefekir Woldegebrel Tessema. (2017). ImpactofUrban expansion on surrounding PeasantLandthe CaseofBoloso SoreWoredaArekaTownSnnprEthiopia Impact of Urban Expansion on surrounding peasant land the case of boloso sore woreda. Areka Town, SNNPR, Ethiopia, 17(2), 1–22.
- Mohammed, I., Kosa, A., & Juhar, N. (2020). Economic linkage between urban development and livelihood of peri-urban farming communities in Ethiopia (policies and practices). Agricultural and Food Economics, 8(1). https://doi.org/10.1186/s40100-020-00164-2
- Muluwork, Z. B. (2014). An Assessment of Livelihood and Food Security of Farmers Displaced Due to Urban Expansion: The Case of Kombolcha Town in Amhara National Regional State, Ethiopia. January, 1–117.
- Nguyen Thi, D., & Philippe Lebailly, T. V. D. (2010). Land conversion to industrialization and its impacts on household food security in Red River. Nguyen Thi Dien, Phillipe Lebailly and Vu Dinh Ton.
- Nigusie, D. (2011). Rapid urban expansion and its implications on livelihood of farming communities on peri-urban area: the case of sebeta town. Addia Ababa University.
- Satterthwaite, D., McGranahan, G., & Tacoli, C. (2010). Urbanization and its implications for food and farming. Philosophical Transactions of the Royal Society B: Biological Sciences, 365(1554), 2809–2820. https://doi.org/10.1098/rstb.2010.0136
- Tassie Wegedie, K., & Duan, X. (2018). Determinants of peri-urban households’ livelihood strategy choices: An empirical study of Bahir Dar city, Ethiopia. Cogent Social Sciences, 4(1), 1562508. https://doi.org/10.1080/23311886.2018.1562508
- UN-HABITAT. (2011). Cities for All: Bridging the Urban Divide – State of the World’s Cities 2010/2011 by UN-HABITAT. In First published by Earthscan in the UK and USA in 2008 for and on behalf of the United Nations Human Settlements Programme (UN-HABITAT). http://unhabitat.org/books/state-of-the-worlds-cities-20102011-cities-for-all-bridging-the-urban-divide/
- UN-HABITAT. (2017). The State of Addis Ababa 2017. United Nations Human Settlements Programme (UN-Habitat),
- Weldearegay, S. K., Tefera, M. M., & Feleke, S. T. (2021). Impact of urban expansion to peri-urban smallholder farmers’ poverty in Tigray, North Ethiopia. Heliyon, 7(6), e07303. https://doi.org/10.1016/j.heliyon.2021.e07303