
 ?Mathematical formulae have been encoded as MathML and are displayed in this HTML version using MathJax in order to improve their display. Uncheck the box to turn MathJax off. This feature requires Javascript. Click on a formula to zoom.
Abstract
The study sought to establish the level of technical, allocative, and economic efficiencies in irrigated onion production in southern Ethiopia, as well as to identify the sources of inefficiencies. The cross-sectional data were obtained from a total of 165 random onion farmers selected from the Humbo area. The parametric stochastic frontier model was used to estimate technical, allocative, and economic efficiency levels, whilst the two-limit Tobit model was utilized to identify determinants of inefficiencies. The data acquired suited the Cobb-Douglas (CD) production function, with land, labor, fertilizer, and chemicals as input factors that had a positive and significant influence on irrigated onion production. The sampled onion farmers’ technical, allocative, and economic efficiencies were determined to be 77, 88, and 68%, respectively. The model results indicated that the age of the farmers, years of education, and total farm financial gain were identified as important sources of irrigated onion production inefficiencies in the research area. The mean technical efficiency levels indicate that irrigated onion producer farmers in the research area may raise their output by 23% with present inputs and technology. Alternatively, farmers will reduce their average production price by 12% while maintaining the current level of output. It is based on this that there is room to improve the efficiency of irrigated onion production. Therefore, the government’s policies and actions should focus on timely and quality agricultural input supply for onion farmers and backing them through availing of formal and informal educational services.
1. Introduction
Since its debut, the onion has been one of the most important vegetable crops grown all over the world. It has grown primarily as a food source and is used as a cousin and value addition for many recipes. As it is indicated by various authors (Bagali et al., Citation2012; Goni et al., Citation2020; Sable et al., Citation2021), it probably originated in Central Asia between Turkmenistan and Afghanistan where some of its relatives still grow in the wild and thought its ancestor had probably migrated to the Near East.
Between 2000 and 2019, global vegetable production increased by 65%, or 446 to 1228 million tons. During this time , the five primary vegetable species accounted for 42–45% of the total: tomatoes (16% in 2019), onions (9%), cucumbers and gherkins (8%), cabbages (6%), and eggplants (6%) and onions, cucumbers gherkins, and eggplants also gained in popularity (Food and Agriculture Organization (FAO), Citation2021). According to this report, in global onion production China, India, the USA, Turkey, Iran, Afghanistan, Brazil, and South Korea are among those mainly producing and trading to international markets. Egypt is Africa’s first-ranked onion producer (FAO, Citation2021) and the world’s fourth-largest producer (Kulkarni et al., Citation2012).
The introduction of the onion crop to Africa, in general, and Ethiopia in particular, was not well publicized (Adgo, Citation2008). According to reports, it was introduced recently by foreigners and is currently more extensively grown in several sections of the country than the traditionally farmed shallot.
Recently, onion is becoming a popular crop in Ethiopia (Habtamu, Citation2017). According to the Central Statistical Authority (CSA) (Citation2018), the volume of root crops produced and the area under root crops production during the 2017/18 production year was about 46 million quintals. From this onion has taken 3 million quintals. It is indicated that it can be cultivated twice per year both in irrigation agriculture and rain feed conditions in different parts of the country (Belay et al., Citation2015).
With an average yield of 92.79 qt/ha, the country has a huge potential to produce onion every year for both domestic consumption and export (CSA, Citation2018). The extension interventions by the Minstry of Agriculture (MoA) and non-governmental organizations to help farmers in adopting the innovation of onion production technology throughout the majority of the nation are encouraging. Farmers in most irrigable parts of the Southern Nations Nationalities and Peoples (SNNP) region now produce a substantial quantity of onion bulbs each year as a result of these intervention activities. In the 2017/18 production year, for example, the region produced 0.266 million quintals (CSA, Citation2018). The report from Humbo District Agriculture and Natural Resource Office (HDNRO) (Citation2019) showed that 91,292 quintals were produced in the 2017/18 production year. However, onion crop productivity remains below the potential output of more than 35T/ha quintals per hectare in other parts of the country (Alemu et al., Citation2022; Awas et al., Citation2010; Shura et al., Citation2022). There are numerous reasons for the area’s low onion productivity. Among them, the lack of scientific research in the area is one. The studies on onion production in Ethiopia mainly focused on the marketing of onions (Abrahim et al., Citation2021; Abrha et al., Citation2020; Asale et al., Citation2016; Emana et al., Citation2017; Gebreselassie, Citation2003; Hailu, Citation2017; Melese et al., Citation2018; Mossie et al., Citation2020; Regasa & Zemedu, Citation2014; Tura Debela, Citation2021). Moreover, there are some studies on production efficiencies by Koye et al. (Citation2022), Gebremariam et al. (Citation2019) and Berhan (Citation2015) that targeted the northern part of Ethiopia. As mentioned above although there are a few studies on onion marketing and production efficiencies, there is still a gap in the studies that have not addressed the following issues: (i) what are the economic efficiency and productivity levels of irrigated onion production? And (ii) what are the sources of inefficiencies in onion production in the research area?
2. Methodology
2.1. Description of the study area
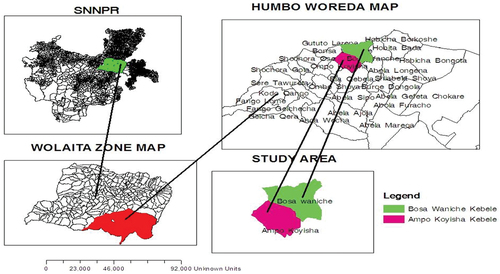
This research was carried out in the Humbo district which is one of the 16 districts within the Wolaita Zone in southern Ethiopia. The district lies 397 km southwest of Addis Ababa and 18 km from Sodo, the administrative center of the Wolaita Zone. The district is divided into 20 rural KebeleFootnote1 administrations (KAs), with 5KAs participating in irrigated onion production. The district is located between latitudes 6.50 and 6.81°N and longitudes 37.57 and 38.04°E. (Figure ) In terms of agro-climatic zones, 11.11% of the district is classified as highland (Dega), 27.77% as mid-highland (Woina-Dega), and the remainder 61.12% as lowland (Kolla). The district’s average annual temperature is 22.0°C, and the average annual rainfall is 1123.15 mm (Wolaita Zone Finance and Economic Development Department (WZFEDD), Citation2018). It has an estimated population of 86,246, with 41,142 males and 45,104 females (Humbo District Finance and Economic Development Office (HDFED), Citation2019).
Figure 1. Map of the study area.
2.2. Data and method of collection
The study relied mainly on primary data. A structured questionnaire was field-tested and improved as needed to acquire the necessary data. It is gathered under the supervision of researchers from a sample of irrigated onion farmers. The questionnaire’s content primarily emphasized onion farmers’ socio-economic characteristics, institutional access, and availability, use of onion production inputs, expenditures on various farm resources required for onion production, the quantity of onion produced, and frequency of agricultural extension service. Secondary data on area description, onion production, price, and related research were gathered from a variety of sources, from the district, zonal, and regional level agricultural and natural resource office reports, and published and unpublished works to support primary data.
2.3. Sampling procedure and sample size
Table shows the list of Kebeles, the number of onion farmers under irrigation in each KAs. A multi-stage sampling strategy was used in this study to choose relevant sample farmers. The Humbo district, comprised of 20 rural KAs, was purposefully chosen in the first stage for its long-term experience in irrigation-based onion cultivation. The district has five irrigation-based onion-producing KAs in the 2018/19 production year. In the second stage, two rural KAs (Ampo koisha, and Bosa wanche) considered representing the five KAs were chosen on purpose based on the large number of irrigated onion farmers in these kebeles. The proportion of onion producers in the two Kebeles is around 79% (Humbo District Finance and Economic Development Office HDFED, Citation2019). In the third step, 165 onion-producer farmers were selected which were determined by using Yamane’s (Citation1967) sample determination formula (Equation 1). Finally, the sample onion farmers were chosen randomly using the lottery method from a list of onion-producing farmers by considering all producer farmers in these KAs have homogenous characteristics. We considered a total sample size of 165 as representative of the existing onion production potential of the area which is only limited to five small rural villages in the district.
Table 1. Distribution of sampled onion farmers by Kebeles
Where n is the sample size, N is the population size, and e is the allowable error level which is 6.46%.
2.4. Method of data analysis
Both descriptive and econometric analytic approaches were employed. To draw a broad image of the sampled households, descriptive statistics such as mean, standard deviation, and ranges were used. The econometric analysis was implemented to estimate the degree of efficiency and identify the sources of inefficiencies. The production and cost functions, efficiency level, and inefficiency drivers are all rigorously examined. First, an econometric estimation is performed using the CD stochastic model, based on the specification of the production frontier. The model evaluated the parameters of the production frontier, degree of efficiency, and significant level of the various factors in determining farmers’ inefficiency. The Stochastic Frontier Production (SFP) model proposed by Battese and Coelli (Citation1995), under the original models for Aigner et al. (Citation1977) and Meeusen and van Den Broeck (Citation1977) was applied to cross-sectional data to analyze the onion production efficiency.
Aigner et al. (Citation1977) and Meeusen and van Den Broeck (Citation1977) independently come up with the estimation of the SFP function, where the disturbance term has two components; the error component/the stochastic noise (v) and inefficiency (u). The other merit of the SFP function over the deterministic models (engineering approach, Malmquist productivity indices, and data envelopment analysis (DEA)) is that the estimation of standard errors and ability to test the hypothesis, which the deterministic models fail to fulfill because of the violation of the maximum likelihood regularity conditions (Coelli, Citation1995).
As pointed out by Bojani et al. (Citation1998) the Maximum likelihood (ML), Corrected Ordinary Least Squares (COLS), and Data Envelopment Analysis (DEA) approaches can be used to estimate the SFP function. COLS and ML are mentioned as superior to DEA if heteroscedasticity is observed in two-sided error. The COLS is recommended for usage since it simplifies the analysis. The ML approach, on the other hand, is asymptotically more efficient than COLS. Given this logical ML, wherever practical, a technique is favored over COLS in the current case.
There are two primary benefits of utilizing frontier function models to assess agricultural efficiency (Coelli, Citation1995). First, it is impacted by the top-performing farms and hence reflects the technologies used by farmers. Second, the frontier function models provide a best-practice technology against which farm efficiency may be compared. Various writers employed non-parametric (DEA) and parametric approach models (stochastic frontier approaches) to quantify efficiency and Tobit models to find factors causing inefficiency. The two-step procedure in opposition to the one-step procedure that is considering output-input and inefficiency source variables simultaneously in the model was employed for this research. The two-step approach is strongly criticized by Wang and Schmidt (Citation2002) for technical efficiency analysis in contrast to the one-step approach. However, this study mainly focused on overall efficiency analysis (TE, AE, and EE) and tested free from mainly suspected econometric problems (correlation and omission of relevant explanatory variables). As a result, the stochastic production frontier model was used in the current study. The two-limit tobit model was developed to discover the elements that influence technical, allocative, and economic inefficiencies. The SFP function of CD type is defined in logarithmic forms by following Aigner et al. (Citation1977), and Meeusen and van Den Broeck (Citation1977). It is defined as (Equation 2 and 3):
where Ln denotes natural logarithm, j represents the number of inputs used (Table ), i denotes ith farmer in the sample, Yi represents the observed onion production of the ith farmer, xij denotes jth farm input variables used in onion production of the ith farmer, ß represent a vector of unknown parameters to be estimated, and ε composed disturbance term made up of two elements (vi and ui).
Table 2. Description and summary of variables used in the parametric stochastic production function
The random error (vi) accounts for the stochastic effects beyond the farmer’s control, measurement errors, as well as other statistical noises, and ui, captures the technical inefficiency, vi is a random error having zero mean, N (0, δ2v) which is associated with random factors such as measurement error in production and weather which are not control of the farmers and assumed to be independently and identically distributed. As N (0, δ2v) with a random error that is independent of ui. ui the non-negative efficiency measured relative to the stochastic frontier that is firm not attaining maximum efficiency of production and ranges between 0 and 1, which is also assumed to be independently and identically distributed as half-normal, ui ~ N[0,σ2]as considered in current research. According to Greene (Citation1990), two-parameter gamma distributions represent the number of farmers involved in the survey of the farms. The variance parameters are:
The parameter must lie between 0 and 1. The maximum likelihood estimation of equation provides consistent estimators for the parameter, which, explains the total variation in the dependent variable due to technical inefficiency (ui) and random shocks (vi,) together. Hence, EquationEquation 7(7)
(7) and EquationEquation 8
(8)
(8) provide estimates for and after replacing, and by their estimates.
The technical efficiency (TEi) of the ith farmers can be estimated by using the expectation of (ui) conditional on the random variables εi as shown by Battese and Coelli (Citation1995).
The TE of an individual farmer is defined in terms of the observed to the corresponding frontier output given the level of inputs that can be calculated as(Equation 6-7.1):
Where: is technical inefficiency;
—–
are the parameters estimated,
is a vector of an onion farmer’s socio-economic characteristics,
is a random error term.
Following Bravo‐ureta and Rieger (Citation1991) adjusted output is used to derive the technically efficient input vector,
. The technically efficient input vector for the ith firm is derived by simultaneously solving equation 5 and the observed input ratio
(i > 1). where
is equal to the observed ratio of the two inputs in the production,
. The technically efficient input vectors serve as the foundation for calculating TE measures by comparing the vector of the norms of the efficient and observed input levels, where the adjusted output is used to calculate allocative and economic efficiencies using the dual-cost frontier function, which is analytically derived from the stochastic production frontier.
Assuming that the production function in EquationEquation 2(2)
(2) is self-dual (e.g., CD), the dual-cost frontier is calculated algebraically and stated as follows (Equation 7.2) for computing AE and EE.
where Ci is the minimum cost of the ith farm associated with the adjusted yield of output Yi* and α is a vector of parameters to be estimated, and Di denotes the cost of inputs (Table ), and εi equals vi-ui.
Table 3. Description and summary of variables used in the cost function
As to Sharma et al. (Citation1999), the above cost estimations were used in the current research to compute the AE and EE indices for the ith onion farmer. The above cost-efficiency (C) level was the inverse of AE. AE was used to define CE. The AE was written as follows: CEi = 1/AEi. The attained AEi value ranges in-between 0 and 1. The formula EEi = TEi*AEi was used to calculate economic efficiency (EE) per individual onion farmer. The farmer i’s technical, allocative, and economic inefficiencies are calculated by subtracting TEi, AEi, and EEi from one, respectively.
The cost inefficiency (CEi) was well defined (Equation 8) as the ratio of the total actual cost (C) to the estimated total minimum cost (C*), with a value ranging from one to infinity.
The production frontier is estimated using the frontier model, whereas the cost frontier is derived analytically from production assuming self-dual as indicated above.
Following Gujarati (2004) the Tobit model below (Equation 9) was used to find sources of technical, allocative, and economic inefficiencies as follows.
where i represent ith farmer in the sample; k is the parameters for several factors affecting efficiency; Zi represents farm-specific factors affecting efficiency; δ is the parameter to be estimated; v represents random error; E is the efficiency (TE, AE, and EE) measure.
EquationEquation 9(9)
(9) implies that the above-observed variable, E, equals E * when E *> 0, but E = 0 when E * < 0 thus this response variable makes the model two-limit Tobit.
2.5. Statistical description of variables used in the production and cost function
The production function was estimated using six input variables (Table ). The variables chosen and entered into the model were land, chemical fertilizer, labor, oxen power, agrochemical, and seed which are converted to the natural logarithm (ln) (Table ). To construct a picture of the distribution and number of inputs, the mean and range of input variables are addressed. The average onion production generated in the research area in 2018/19 was 71.20 qt/ha, ranging from 7 to 180 qt among the sample farmers, indicating a large possibility for increasing onion yields in the study area. The farmers allocated 0.06 to 0.88 ha of land for onion production, with an average of 0.46 ha. Another important factor is the seed, without which production is impossible. A typical amount of seed used by onion farmers’ was 0.23 Kg. Inputs like human labor, oxen power, chemical fertilizer, and agrochemicals are also crucial. On average, identified onion farmers utilized 11.75 men equivalent work, 4.87 oxen days, 57.69 kg fertilizer, and 0.23-l chemicals during the 2018/19 crop season.
The productivity of irrigated onions is mostly determined by the amounts of production inputs. As a result, the yield response of onion to these input levels was examined in a smallholder production system.
Moreover, the variables in the dual-frontier cost function (Table ) are generated from the Stochastic CD production function. It denotes the monetary values (measured in ETBFootnote2 and converted to natural logarithm and incorporated in the model (Equation 7.2) of the inputs utilized to produce a specific physical quantity of onion product. Thus, the levels of cost and AE for sample homes in the research area show the relative measures of cost reduction and resource allocation. Input costs are used to estimate the cost function based on data gathered from primary and secondary sources. The description and summary of variables utilized in the cost function are depicted in Table . The sampled onion farmers used an average of 6372.66 ETB to produce 71.20 qt. The average expenses for land, labor, oxen, fertilizer, chemical, and seed are 42.87, 1313.6, 912.15, 811.02, 441.92, and 595.67 ETB/unit, respectively.
2.6. Sources of irrigated onion production inefficiencies
Table displays the socioeconomic and institutional elements anticipated to influence onion production inefficiency. Furthermore, it demonstrates their hypothesized relationship to technical and economic efficiency.
Table 4. Description and hypothesis of explanatory variables
2.7. Model diagnostics
The data were essentially examined against several econometric problems. It has checked for heteroscedasticity and multicollinearity. The results revealed no significant heteroscedasticity concern (the Breusch–Pagan test outcome showed a p-value of 0.115). The multicollinearity test for continuous components confirms no substantial issue (VIF value is less than 10) and the contingency coefficient for explanatory factors was also determined to be less than one.
Furthermore, one appealing aspect of the SPF technique is its ability to test many hypotheses using the maximum likelihood ratio test (Table ), which was previously impossible in non-parametric models. The ML estimator is shown to be consistent and asymptotically normal (i.e. the ML assessor is asymptotically proficient). In this manner, before continuing to the assessment of the boundaries from which individual degrees of efficiencies are assessed, it is basic to analyze different presumptions identified with the model in particular. Three speculations were tried for this. The main theory test was to pick the best functional form that can more readily fit the data. This was accomplished by testing the null hypothesis that the coefficients of the Trans-log functional form are equivalent to zero (Ho: βij = 0). For example, CD outskirts practical determination is tried against the alternative hypothesis that these coefficients are not the same as zero (H1:βij≠0). The test was made dependent on the estimation of likelihood ratio (LR) insights, which can be processed from the log-likelihood values of both CD and Trans-log functional specifications using EquationEquation 10(10)
(10) underneath. The computed LR value was 15.4 and which is lower than 32.67 at an estimation of χ2 at a 5% degree of significance. Hence, the choice was to acknowledge the null hypothesis and accepted the alternative hypothesis that the CD production functional form best fits the current data.
Table 5. Tests of Hypothesis
where L (Ho) and L (H1) are the values of the log-likelihood function under the null and alternative hypotheses, respectively.
The other test was made to check for the presence of the inefficiency component of the total error term of the stochastic production function. Utilizing CD functional form and assuming a half-normal distribution of one-sided error term (ui), the hypothesis to be tested was whether inefficiency is absent in the model and hence whether the average production function is appropriate or not. Comparatively, the hypotheses tests of the parameters in the frontier model are performed using the LR statistic. It is utilized to test the null hypothesis that the inefficiency effects are absent from the model (γ = 0) and an alternative hypothesis that implies inefficiency effects are present in the model (γ > 0). The uneven LR-a test of the model (γ = 0) gives a measurement of 12.16 which is significantly higher than the critical value of χ2 at a 5% level of significance. Rejecting the null hypothesis implies that the average response function estimated by OLS, which assumes producers are fully efficient and inefficiency effects are absent from the model is an inadequate representation of the data.
The last test was to test that all coefficients of the inefficiency effect model are concurrently equal to zero (H0:δ1=δ2= … δ6 = 0) against the alternative hypothesis, which states that all parameter coefficients of the inefficiency model are different from zero (H1: δ1=δ2= … δ6≠0). Similarly, the test using the LR value was 56.66, which is higher than the critical value of 12.59 at the degree of freedom of 6. Accordingly, the null hypothesis is rejected in favor of the alternative hypothesis that independent variables associated with the inefficiency effects model are simultaneously different from zero. Henceforth, these factors at the same time clarify the distinction in efficiency among examined sampled onion farmers.
3. Results and Discussion
3.1. Statistical summary of demographic and socioeconomic characteristics of sampled onion farmers
The mean age of sample household heads was 52 years, with a minimum of 28 and a maximum of 79 years old (Table ). Furthermore, an onion farmer has received 6 years of formal education on average, with a minimum of illiterate and a maximum of 15 years of study. The average distance between the onion farmer’s home and the nearest market is 7.86 km and the mean distance to the all-weather road of the onion farmers’ was 1.95 km. During the survey period, the sampled farmers’ minimum and maximum total farm incomes were 1690 and 29,354 ETB/year, respectively, with a mean income of 10,631.61 ETB/year. The statistical data revealed that the average frequency of extension contact during the production season was 7.82, with the lowest and maximum frequency of 1 and 14, respectively.
Table 6. Statistical summary of continuous variables
3.2. Irrigated onion production and cost functions
The estimated production function’s dependent variable was onion output (qt), and the input variables utilized in the analysis were land, labor, oxen, fertilizer, chemical, and seed. The ML estimate of the stochastic production frontier model demonstrates that four of the six input variables examined (land, labor, fertilizer, and chemical) have a significant and positive influence on onion output, whereas oxen power and onion seed inputs do not.
As shown in Table , the input variable land has a coefficient of 0.50. It indicates that each additional hectar of the land area used for onion production increases onion output by 50%. This result is similar to Kaka et al. (Citation2022), and Muhaimin and Abdul (Citation2017), the efficiency of the production factor of red onion farming in Indonesia. Furthermore, the labor force is often drawn from both inside and outside the family. Based on the results, the labor coefficient is 0.33 that is positively and significantly affects onion production at a 1% significance level. This shows that for every unit increase in the workforce in man-equivalence, onion production will increase by 33%. The research conducted by Muhaimin and Abdul (Citation2017) is in line with this study. The estimated fertilizer coefficient is 0.31 that is also positively influencing onion output. This shows every 1-kg increase in fertilizer input increases onion production by 31%. This result is similar to Simon et al. (Citation2014). Finally, the coefficient of the chemical application input variable is 0.1 that is showing a liter increase in agrochemical input would enhance onion yield by 10%.
Table 7. ML estimates of the parametric SPF
The gamma (γ), which measures the effect of technical inefficiency in the variation of observed output, was estimated to be 0.75, which is an estimate of the variance parameter and significant at a 1% level of significance, implying that 75% of the total variation in onion output was due to the presence of production inefficiency and 25% was due to stochastic noise.
The diagnostic test for the inefficiency component shows that sigma squared (δ2) was statistically significant at 1%. This shows the quality of fit and the accuracy of the distributional shape chosen for the composite error component.
The scale coefficient was determined to be 1.29, suggesting that the scale of production is increasing returns to scale. As a result, because they are in the first stage of production, resource usage, and production are below optimal levels, and onion growers can continue expanding their outputs. Alternatively, it means that a percent increase in all inputs will result in a 129% rise in total output. Even if the crop is different, this result is consistent with (Bizuayehu, Citation2012) who estimated the returns to scale to be 1.04 in his study of EE of wheat production. However, a study by Dagnew (Citation2009) on the TE of onion production in Kalu Woreda found returns to a scale of 0.812, which falls in stage II of the production function.
Besides, the study determined the parameters of the dual-cost function as the foundation for estimating allocative and economic efficiency. Table shows the ML estimations of the dual-cost function. It showed that the coefficients of all input expenditure variables are positive and significant and that implies each input cost and total cost are directly related.
Table 8. The ML estimates of the dual-cost function
3.3. Efficiency scores
The mean TE, AE, and EE of sampled onion farmers were found 77%, 88%, and 68%, respectively (Table ). This demonstrates that sample farmers performed better in AE than in TE and EE. This also implies farmers are better at allocating their onion production budget than minimizing onion farm inputs. The onion farmers have the potential to reduce the input required in onion production by 23% while maintaining present output levels. If the average farmer in the sample achieved the most efficient counterpart’s level of production costs, the average farmer might realize a 12% decrease in input costs to create the most efficient output. Similarly, if the technically efficient farmer achieved the TE level of his most efficient, the least efficient farmer might realize a 77% decrease in inputs necessary to obtain the most efficient output level. The TE estimate is consistent with the results obtained by Meftu and Jema (Citation2016).
Table 9. Statistical summary of efficiency measures
The sample onion farmer’s mean AE was 88%, implying that production is 12% below the frontier on average (less than the achievable potential output). This suggests that more inputs are being allocated for the same amount of output. A farmer with an average level of AE, for example, would save around 12% to reach the level of the most efficient farmer. This result is in line with the findings of Mekonnen et al. (Citation2015), and Meftu and Jema (Citation2016).
The sample farmer’s mean economic efficiencies were 68%, indicating a considerable level of inefficiency in the manufacturing process. That is, a producer with average EE might lower current average production costs by 32% to meet the possible minimal cost level without affecting output levels. Farmers would save 32% on production costs if they achieved 100% EE. This suggests that lowering the cost of production by removing inefficient resource usage might add 32% to their annual revenue. These findings indicate that there is room to enhance farm family productivity and economic advantages in onion production in the research area by boosting all efficiencies.
3.4. Onion yield gap due to inefficiency
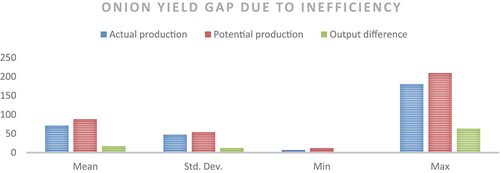
It is obtained that onion-producing farmers’ mean actual, potential, and output differences due to inefficiency were 71.20, 88.40, and 17.19qts, respectively (Figure ) which is computed as suggested by Coelli (Citation1995). It implies that if the farmers eliminate inefficiency or work at maximum efficiency level, they may improve their present output by 17.19 qt with the current level of input and technology.
Figure 2. Irrigated onion yield gaps.
3.5. Sources of technical, allocative, and economic inefficiencies of onion production
Various demographic, socioeconomic, and institutional variables are hypothesized as factors determining technical, allocative, and economic inefficiencies of irrigated onion production in the research area. The two-limit Tobit regression model revealed that the age, year education, and total farm income of the onion farmer households are statistically significant sources of onion production inefficiencies in the area (Table ).
Table 10. Two-limit Tobit model estimates of sources of onion production inefficiencies
The results above showed that onion farmer household age had a respective positive association with the technical and allocative inefficiency of onion production and a negative one with the economic inefficiency of onion production. This means that elderly farmers are less technically and allocative efficient than younger farmers, who are more likely than older farmers to use irrigation and other modern technology. It shows that a yearly increase in the age of onion farmer household heads makes 0.6% of onion farmers technically inefficient. Similarly, 0.6% is allocatively inefficient. In the current study, one possible explanation is that as one gets older, one’s capacity to do labor decreases; older farmers are reluctant to change and hesitant to employ agrochemicals and technologies, suggesting a positive link with technological inefficiency. The research conducted by Tegegne et al. (Citation2014) has also had a similar result. However, the aged farmers are found economically efficient this finding is not similar to Mussaa et al. (Citation2011)) and Meftu and Jema (Citation2016). They indicated farmers who learn from their experience about input utilization.
Furthermore, the years of education of onion farmers’ household heads were found as a negative and significant factor in determining the technical, allocative, and economic inefficiency of onion production. It demonstrates the contribution of education in improving the efficiency of onion production. The result shows that a year increase in the education of onion farmer household heads brings a 1.1, 1.5, and 1.2% increase in onion farmers’ technical, allocative, and economic efficiency levels. This implies that more educated farmers, on average, can recognize, evaluate, and respond to new information and adopt improved technology such as fertilizers, agrochemicals, and seed varieties faster than their less-educated ones. Besides, education can increase their information acquisition and adjustment abilities, thereby increasing their decision-making capacity. Even if the crop is different, this result is consistent with the finding by Asfaw et al. (Citation2019), Kaka et al. (Citation2022), Maniriho et al. (Citation2020), and Mulwa et al. (Citation2009).
The total farm income of a household determines the technical inefficiencies of onion production. The results demonstrate that households with higher farm income would dedicate more time and effort to agricultural operations and would be able to adopt updated technologies, resulting in increased efficiencies. As a result, the outcome has been proven to have a negative and considerable impact on farmers’ technical inefficiency in onion production. The result has conformity with Tegegne et al. (Citation2014). Furthermore, the findings suggest that households with high overall farm earnings are economically efficient. This might be due to household finance having a direct impact on efficiency since farmers with low income will be unable to purchase agricultural inputs (seed, agrochemicals, and fertilizer). The finding is similar to Bizuayehu’s (Citation2012).
4. Conclusion and Policy Implications
The study looked at the production efficiencies and causes of production inefficiency in onion farming in southern Ethiopia. The Cobb-Douglas stochastic frontier functional model was used for the estimation of production and cost function. It is found that the inputs such as land, labor, fertilizer, and chemicals found important factors in determining onion production in the research area. The increased utilization of these resources can increase to a greater extent the onion production level. The test measures implemented also confirmed that there is a wide gap in efficiency among smallholder onion farmers. The average technical, allocative, and economic efficiency estimations of the onion farmers were 77%, 88%, and 68%, respectively. This implies that with existing resources, the onion farmers may increase their onion yield by 23% on average when they are technically efficient. Similarly, they can increase their economic efficiency by 32%. The two-limit Tobit model results showed age, years of schooling, and gross farm income of households found significant sources of the inefficiency of onion producers.
The study suggests that increasing the introduction and distribution of agricultural inputs while lowering the present level of inefficiency would result in a significant increase in output level or decrease in production cost. The findings further imply that measures that excite and activate the rural population, particularly the young to participate in agricultural activities should be prioritized. It will also necessitate an effort to provide farmers in the study area with easy access to formal and informal education through short and long term trainings. As a result, the government should access inputs early, and create an experience-sharing platform with relatively efficient onion farmers for effective input allocation and cost-cutting measures to enhance onion output. It further necessitates empowering, motivating, and more aware farmers to participate in diversification activities.
Acknowledgments
The authors would like to thank onion farmers and DAs in each of the study Kebeles. Moreover, we would like to thank two anonymous reviewers for their critical and constructive comments and suggestions in an earlier version of the article.
Disclosure statement
No potential conflict of interest was reported by the authors.
Additional information
Notes on contributors

Alula Tafesse
Alula Tafesse (Ph.D) is a senior researcher in Department of Agricultural Economics, Wolaita Sodo University, Ethiopia. His research interests include themes on natural resource and environmental economics, food and nutrition security, agricultural value chain analysis, impact analysis, agricultural productivity and marketing, climate change and macroeconomics.
Samuel Dema
Samuel Dema is lecturer in Department of Agricultural Economics, Dilla University, Ethiopia.
Abrham Belay
Abrham Belay is senior researcher in Department of Natural Resource Economics and Policy, Hawassa University, Ethiopia.
Notes
1. Smallest administrative unit in Ethiopia.
2. It is Ethiopian Birr, 55 ETB equal one USD in current exchange rate.
References
- Abrahim, A., Alamerie, K., & Ademe, A. (2021). Determinants of onion marketed among smallholder producers in Gemechis District, West Hararghe Zone, Oromia National Regional State of Ethiopia. International Journal of Agricultural Economics, 6(6), 305. https://doi.org/10.11648/j.ijae.20210606.18
- Abrha, T., Emanna, B., & Gebre, G. G. (2020). Factors affecting onion market supply in medebay zana district, tigray regional state, Northern Ethiopia. Cogent Food & Agriculture, 6(1), 1712144. https://doi.org/10.1080/23311932.2020.1712144
- Adgo, T. M. (2008). Farmers' evaluation and adoption of improved onion production package in Fogera District, South Gondar, Ethiopia (MSc thesis, Haramaya University).
- Aigner, D., Lovell, C. K., & Schmidt, P. (1977). Formulation and estimation of stochastic frontier production function models. Journal of Econometrics, 6(1), 21–16. https://doi.org/10.1016/0304-4076(77)90052-5
- Alemu, D., Kitila, C., Garedew, W., Jule, L., Badassa, B., Seenivasan, V., Saka, A. & Ramaswamy, K. (2022). Growth, yield, and yield variables of onion (Allium Cepa L.) varieties as influenced by plantspacing at DambiDollo, Western Ethiopia. Scientific Reports, 12(1), 20563. https://doi.org/10.1038/s41598-022-24993-x
- Asale, A., Yhanes, D., & Buke, T. (2016). Onion market chain analysis in Humbo District of Wolaita Zone, Southern Ethiopia. International Journal of Scientific Research Engineering Technology, 2(1), 7–8.
- Asfaw, M., Geta, E., & Mitiku, F. (2019). Economic efficiency of smallholder farmers in wheat production: The case of abuna gindeberet District, Oromia national regional state, Ethiopia. International Journal of Environmental Sciences & Natural Resources, 16(2), 41–51.
- Awas, G., Abdisa, T., Tolesa, K., & Chali, A. (2010). Effect of intra-row spacing on yield of three onion (Allium cepa l.) varieties at Adami Tulu agricultural research center (mid rift valley of Ethiopia). Journal of Horticulture and Forestry, 2(1), 7–11.
- Bagali, A., Patil, H., Guled, M., & Patil, R. (2012). Effect of scheduling of drip irrigation on growth, yield and water use efficiency of onion (Allium cepa L.). Karnataka Journal of Agricultural Sciences, 25(1), 116–119.
- Battese, G. E., & Coelli, T. J. (1995). A model for technical inefficiency effects in a SFP function for panel data. Empirical Economics, 20(2), 325–332. https://doi.org/10.1007/BF01205442
- Belay, S., Mideksa, D., Gebrezgiabher, S., & Seif, W. (2015). Yield components of adama red onion (Allium cepa L.) cultivar as affected by intra-row spacing under irrigation in fiche condition. Medicinal Plant, 3(6), 75. https://doi.org/10.11648/j.plant.20150306.13
- Berhan, T. H. (2015). Determinants of technical, allocative and economic efficiencies among onion producing farmers in irrigated agriculture: Empirical evidence from Kobo district, Amhara region, Ethiopia. African Journal of Agricultural Research, 10(20), 2180–2189. https://doi.org/10.5897/AJAR2015.9564
- Bizuayehu, S. (2012). Economic efficiency of wheat seed production: The case of smallholders in womberma Woreda of West Gojjam zone. Msc Thesis, Haramaya University,
- Bojani, A. N., Caudill, S. B., & Ford, J. M. (1998). Small-sample properties of ML, COLS, and DEA estimators of frontier models in the presence of heteroscedasticity. European Journal of Operational Research, 108(1), 140–148. https://doi.org/10.1016/S0377-2217(97)00101-X
- Bravo‐ureta, B. E., & Rieger, L. (1991). Dairy farm efficiency measurement using stochastic frontiers and neoclassical duality. American Journal of Agricultural Economics, 73(2), 421–428. https://doi.org/10.2307/1242726
- Coelli, T. (1995). Estimators and hypothesis tests for a stochastic frontier function: A Monte Carlo analysis. Journal of Productivity Analysis, 6(3), 247–268. https://doi.org/10.1007/BF01076978
- CSA (Central Statistical Agency). (2018). Agricultural sample survey 2017/18; Report on area and production of major crops (Vol. I). Addis Ababa.
- Dagnew, A. (2009). Technical efficiency of onion production under irrigation: The case of Kalu Woreda of South Wollo. MSc Thesis, Haramaya University,
- Debebe, S., Haji, J., Goshu, D., & Edriss, A. K. (2015). Technical, allocative, and economic efficiency among smallholder maize farmers in Southwestern Ethiopia: Parametric approach. Journal of Development and Agricultural Economics, 7(8), 282–291. https://doi.org/10.5897/JDAE2015.0652
- Degefa, K., Jaleta, M., & Legesse, B. (2017). Economic efficiency of smallholder farmers in maize production in Bako Tibe district, Ethiopia. Developing Country Studies, 7(2), 80–86.
- Emana, B., Afari-Sefa, V., Kebede, D., Nenguwo, N., Ayana, A., & Mohammed, H. (2017). Assessment of postharvest losses and marketing of onion in Ethiopia. International Journal of Postharvest Technology and Innovation, 5(4), 300–319. https://doi.org/10.1504/IJPTI.2017.092466
- FAO. (2021). World Food and Agriculture - Statistical Yearbook 2021. Rome. https://doi.org/10.4060/cb4477en
- Gebremariam, H. G., Weldegiorgis, L. G., & Tekle, A. H. (2019). Efficiency of male and female as irrigated onion growers. International Journal of Vegetable Science, 25(6), 571–580. https://doi.org/10.1080/19315260.2019.1565794
- Gebreselassie, S. (2003). Evaluation of the concentration sputum smear technique for the laboratory diagnosis of pulmonary tuberculosis. Tropical Doctor, 33(3), 160–162. https://doi.org/10.1177/004947550303300313
- Goni, V., Devaraju, V. S., Kantharaj, D., Lakshmana, Y., & Kantharaj, Y. (2020). Influence of different onion cultivars on storage life under Hill Zone of Karnataka. International Journal of Current Microbiology and Applied Sciences, 9(10), 3127–3133. https://doi.org/10.20546/ijcmas.2020.910.375
- Greene, W. H. (1990). A gamma-distributed stochastic frontier model. Journal of Econometrics, 46(1–2), 141–163. https://doi.org/10.1016/0304-4076(90)90052-U
- Habtamu, G. M. (2017). Onion (Allium cepa L.) yield improvement progress in Ethiopia: A review. International Journal of Agriculture and Biosciences, 6(5), 265–271.
- Hailu, A. (2017). Factors affecting onion market outlet choices in Ejere district, West Shoa zone, Oromia region of Ethiopia. Journal of Marketing and Consumer Research, 34, 2422–8451.
- HDANRO. (2019). Annual production report of the Humbo district for the season of 2018/2019. Annual Report. Humbo.
- Humbo District Finance and Economic Development Office (HDFED).(2019). Annual Report. Humbo.
- Kaka, Y., Magaji, U., & Gindi, A. (2022). Technical efficiency of onion production in Kebbi State: A Stochastic frontier production function approach. Nigerian Journal of Basic and Applied Sciences, 30(1), 28–35. https://doi.org/10.4314/njbas.v30i1.4
- Koye, T. D., Koye, A. D., & Amsalu, Z. A. (2022). Analysis of technical efficiency of irrigated onion (Allium cepa L.) production in North Gondar Zone of amhara regional state, Ethiopia. PloS One, 17(10), e0275177. https://doi.org/10.1371/journal.pone.0275177
- Kulkarni, B., Patil, S., & Ramchanpra, V. (2012). Growth trends in area, production and export of onion from India-an economic analysis. International Journal of Commerce and Business Management, 5(2), 159–163.
- Maniriho, A., Musabanganji, E., & Lebailly, P. (2020). Analysis of economic efficiency of small-scale onion production in Volcanic highlands in Rwanda. Montenegrin Journal of Economics, 16(3). https://doi.org/10.14254/1800-5845/2020.16-3.15
- Meeusen, W., & van Den Broeck, J. (1977). Efficiency estimation from CD production functions with composed error. International Economic Review, 18(2), 435–444. https://doi.org/10.2307/2525757
- Meftu, A. Z., & Jema, H. (2016). Economic Efficiency of Groundnut (Arachis hypogaea L.) Production: The Case of Gursum District, East Hararghe Zone. Oromia National Regional State.
- Mekonnen, E., Geta, E., & Legesse, B. (2015). Production efficiency of sesame in selamago district of south omo zone, southern Ethiopia. Current Research in Agricultural Sciences, 2(1), 8–21. https://doi.org/10.18488/journal.68/2015.2.1/68.1.8.21
- Melese, T., Goshu, D., & Tilahun, A. (2018). Determinants of outlet choices by smallholder onion farmers in Fogera district Amhara Region, Northwestern Ethiopia. Journal of Horticulture and Forestry, 10(3), 27–35.
- Mossie, H., Berhanie, Z., & Alemayehu, G. (2020). Econometric analysis of onion marketed supply in Northwest Ethiopia. Cogent Food & Agriculture, 6(1), 1733329. https://doi.org/10.1080/23311932.2020.1733329
- Muhaimin, M., & Abdul, W. (2017). Efficiency of production factor of red onion farming in Indonesia. Russian Journal of Agricultural and Socio-Economic Sciences, 65(5), 255–260. https://doi.org/10.18551/rjoas.2017-05.33
- Mulwa, R., Emrouznejad, A., & Muhammad, L. (2009). Economic efficiency of smallholder maize producers in Western Kenya: A DEA meta-frontier analysis. International Journal of Operational Research, 4(3), 250–267. https://doi.org/10.1504/IJOR.2009.023284
- Mussaa, E., Obare, G. A., Bogale, A., & Simtowe, F. (2011). Resource use efficiency of smallholder crop production in the central highlands of Ethiopia.
- Regasa, D., & Zemedu, L. (2014). Onion market integration: The case of harar, dire dawa and central markets. Marketing, 5(27), 2222–1700.
- Sable, P. A., Mahajan, V., & Sonpure, S. (2021). Scientific cultivation of kharif onion. Indian Horticulture, 66(2).
- Sharma, K. R., Leung, P., & Zaleski, H. M. (1999). Technical, allocative and economic efficiencies in swine production in Hawaii: A comparison of parametric and nonparametric approaches. Agricultural Economics, 20(1), 23–35. https://doi.org/10.1111/j.1574-0862.1999.tb00548.x
- Shura, G., Beshir, H. M., & Haile, A. (2022). Improving onion productivity through optimum and economical use of soil macronutrients in Central Rift Valley of Ethiopia. Journal of Agriculture and Food Research, 9, 100321. https://doi.org/10.1016/j.jafr.2022.100321
- Simon, T., Tora, M., Shumbulo, A., & Urkato, S. (2014). The effect of variety, nitrogen and phousphorous fertilization on growth and bulb yield of onion (Allium Cepa L.) at Wolaita, Southern Ethiopia. Journal of Biology, Agriculture and Healthcare, 4(11), 89–97.
- Tarekegn, K., & Ayele, A. (2020). Impact of improved beehives technology adoption on honey production efficiency: Empirical evidence from Southern Ethiopia. Agriculture and Food Security, 9(1), 1–13. https://doi.org/10.1186/s40066-020-00258-6
- Tegegne, B., Tadesse, G., & Zemedu, L. (2014). Technical efficiency in irrigated small-scale agriculture: Empirical evidence from onion farming in Kobo District of Northeast Ethiopia. Journal of Agricultural Economics and Development, 3(3), 035–046.
- Tura Debela, T. (2021). Determinants of onion commercialization among smallholder farming households: the case of fentale district, east Shoa zone, Oromia regional state, Ethiopia (Doctoral dissertation, Ambo University).
- Wang, H. J., & Schmidt, P. (2002). One-step and two-step estimation of the effects of exogenous variables on technical efficiency levels. Journal of Productivity Analysis, 18(2), 129–144.
- Wolaita Zone Finance and Economic Development Department (WZFEDD), 2018). Annual Report. Wolaita Sodo,
- Wollie, G., Zemedu, L., & Tegegn, B. (2018). Economic efficiency of smallholder farmers in barley production in Meket district, Ethiopia. Journal of Development and Agricultural Economics, 10(10), 328–338. https://doi.org/10.5897/JDAE2018.0960
- Yamane, T. (1967). Statistics: An introductory analysis (2nd ed.). Harper and Row.