
 ?Mathematical formulae have been encoded as MathML and are displayed in this HTML version using MathJax in order to improve their display. Uncheck the box to turn MathJax off. This feature requires Javascript. Click on a formula to zoom.
Abstract
Wheat production is dominated by a subsistence smallholder production system. Additionally, more than 4.7 million smallholder farmers are engaged in wheat production. However, poverty is chronic and pervasive among smallholder farmers. Hence, targeting the efficiency of wheat production is the right strategy to improve the well-being of smallholder farmers. Therefore, we conducted this study to measure the level of wheat production efficiency and figure out the sources of wheat production inefficiency among smallholder farmers using stochastic frontier and beta regression models, respectively. Hence, 400 smallholder farmers were selected to gather firsthand information on wheat production and important variables. The stochastic frontier result shows that the number of oxen, amount of urea fertilizer, and seed had a positive and statistically significant effect on the level of wheat production, unlike wheat farm size. The mean technical efficiency result indicates that smallholder farmers operate 23% below the maximum capacity of wheat production. Additionally, smallholder farmers were producing 18.97 quintals per hectare less than the potential production capacity. Consequently, the beta regression model result shows that an increase in the dependency ratio, distance to the local wheat market, and distance to the extension office will increase the technical inefficiency of wheat production. On the contrary, educational status, farm experience, and access to wheat price information decrease the technical inefficiency of wheat production. Therefore, policymakers, stakeholders, and farmers should consider the main sources of technical inefficiency to minimize the sources of wheat production inefficiency.
PUBLIC INTEREST STATEMENT
In Ethiopia, wheat takes the lion’s share to achieve national food self-sufficiency and reduce poverty. But the wheat production increment is associated with an increase in cultivation area. However, increasing wheat production by expanding cultivation area may not be the best solution in the long term. Therefore, improving the production capacity of smallholder farmers is a better approach. Thus, understanding smallholder farmers’ sources of inefficiency in wheat production is crucial. However, previous studies on technical inefficiency of wheat production in Ethiopia have used models that may not be appropriate for analyzing technical inefficiency. In addition, the potential yield, wheat yield gap and monetary value of yield gap were not investigated. Consequently, this study was conducted to provide empirical evidence on the sources of wheat production technical inefficiency. Therefore, policy makers and stakeholders can use these findings to design intervention mechanisms to reduce technical inefficiency in wheat production.
1. Introduction
In Ethiopia, crop production constitutes about 72% of the total agricultural gross domestic product (ATA, Citation2018). Additionally, more than 80% of the population earns their livelihood from crop production (Duguma et al., Citation2012; Hagos et al., Citation2009). Especially, maize, sorghum, barley, teff, and wheat are the major cereals that cover the biggest share of crop production (ATA, Citation2018; Louhichi et al., Citation2019; Taffesse et al., Citation2012). Unfortunately, crop production is dominated by a subsistent smallholder production system. Conversely, smallholder farmers are the bases of the Ethiopian economy because more than 90% of agricultural products are produced by smallholder farmers (Mazengia, Citation2016; Taffesse et al., Citation2012). However, smallholder farmers own fragmented and small farm sizes. Especially, the farm size problem is severe in the highlands of Ethiopia. On average, smallholder farmers owned 0.35 ha of land to fulfill the basic needs of family members by producing a combination of crops (Gudina, Citation2011). Moreover, poverty is pervasive and chronic among smallholder farmers (Galvez-Nogales, Citation2010). Moreover, smallholder farmers rely on family labor and their agricultural produce for consumption purposes. As a result, smallholder-oriented subsistence agriculture is not an effective way to ensure food security (Pingali, Citation1997). Therefore, raising agricultural output is a necessary step to feed a population that is growing exponentially and to lower poverty among smallholder farmers. Hence, understanding efficiency of smallholder farmers has paramount importance to reduce poverty and increase land productivity through efficient utilization of the available scarce resources.
In Ethiopia, wheat is one of the priority cereal crops in terms of the area coverage (1.6 million hectares), and the number of smallholder farmers involved in wheat production (4.7 million farmers) the volume of production (3.9 million ton) (ATA, Citation2014; CSA, Citation2014). It is one of the target crops to attain national food self-sufficiency (Aleminew et al., Citation2015). Currently, the government of Ethiopia gives due emphasis to wheat production to curve food price inflation and the adverse effects of the northern conflict during the main production season. Accordingly, all the stakeholders exert their unreserved efforts to increase wheat production and productivity. Nevertheless, it ranks third in terms of production and fourth in yield (2.4 tons per hectare) though it is a nationally prioritized cereal crop (CSA, Citation2021). Additionally, Dorosh et al. (Citation2015) underlined that the expansion of cultivated land size has contributed to a rise in wheat production. However, increasing wheat production by expanding the cultivation area might not be the best course of action in the long run. Therefore, output growth of farmers could be accomplished by enhancing their managerial and production capacity. Hence, wheat production and productivity intervention require evidence on the efficiency of smallholder farmers. Consequently, studies on the efficiency of farmers’ wheat production provide basic information on farmers’ wheat production efficiency, sources of wheat production inefficiency, and wheat production gap due to inefficiency. Accordingly, this study will support policymakers and stakeholders to design intervention mechanisms at the micro and macro level.
Conversely, dozens of studies were carried out on the technical inefficiency of wheat production in different parts of Ethiopia. For instance, Ayele et al. (Citation2019) examined the technical inefficiency of wheat production by smallholder farmers in southern Ethiopia using a two-step stochastic frontier model. Moreover, Hailu (Citation2020) investigated technical inefficiency sources of wheat production in Ethiopia by applying a two-limit Tobit model. Similarly, Hunde and Abera (Citation2019) estimated the technical inefficiency of wheat production in Debra Libanos, Ethiopia using two-limit Tobit models. Furthermore, Getachew et al. (Citation2020) examined the technical inefficiency of wheat producers in North Shewa, Ethiopia using a two-step stochastic frontier model. Moreover, the previous studies frequently applied two-step stochastic frontier, Tobit, and ordinary least square models to analyze the effect of demographic, socioeconomic, and institutional factors on technical inefficiencies (Alemu et al., Citation2018; Anaye et al., Citation2020; Dlamini et al., Citation2012; Weldegebriel, Citation2015). On the contrary, Cribari-Neto and Zeileis (Citation2009) and Gallani et al. (Citation2015) underscored that two-step stochastic frontier, Tobit, and ordinary least square models are not appropriate to analyze technical inefficiency (see section 2.3.3). Besides, the methodological gaps of previous studies, potential yield, wheat yield gap due to technical inefficiency, and monetary value of wheat yield gap were not studied before (Ayele et al., Citation2019; Getachew et al., Citation2020; Hailu, Citation2020; Tiruneh & Geta, Citation2016). Additionally, the findings of previous studies vary within and across countries due to heterogeneity of socioeconomic characteristics, institutional factors, production potential, and agroecology’s (Abera, Citation2019). Moreover, sources of wheat production technical inefficiency among smallholder farmers in Northwestern Ethiopia particularly in Debre Elias woreda was not studied. Consequently, this study was conducted to provide location-based empirical evidence on sources of technical inefficiency of wheat among smallholder farmers in Northwestern Ethiopia.
2. Materials and methods
2.1 Description of the study area
The study was conducted in northwestern Ethiopia, particularly in Debre Elias woreda (Figure ). It is located around 340 km northwest of Addis Ababa, Ethiopia. In the study area, smallholder farmers are engaged in livestock rearing and crop production activities. Especially, rain-fed agriculture is the dominant economic activity that serves as the livelihood base of smallholder farmers. In the study area, smallholder farmers produce both cash and food crops simultaneously. Wheat is particularly one of the most important cash and food crops in the study area.
Figure 1. Map of the study area.
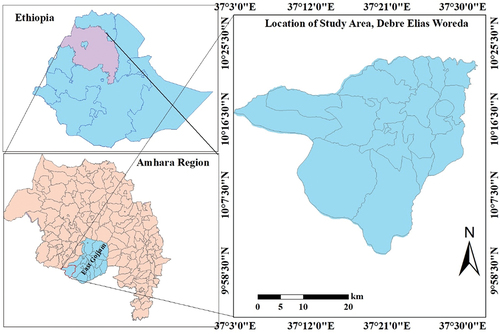
The altitude of Debre Elias woreda falls in the potential agroecological zones (1500 to 3000 meters above sea level) of wheat production (Kotu et al., Citation2000). The mid-highland agroecological condition of the study area accounts for 98% and the rest 2% accounts for low lands (Melaku & Abebe, Citation2012). As a result, Debre Elias woreda was selected considering the wheat production potential of the woreda. Right now, Debre Elias woreda is the belly button of wheat production sources in the Amhara Region, Ethiopia. Though the area is endowed with wheat production potential, technical inefficiency sources were not documented before designing and implementing intervention mechanisms. Accordingly, we selected Debre Elias woreda to fill the information and methodological gaps of previous studies. Similarly, this study was done to identify location-based empirical evidence about the level of technical efficiency and sources of technical inefficiency of wheat production among smallholder farmers.
2.2. Methods of data collection
We collected both quantitative and qualitative data from primary and secondary sources. Face-to-face interviews, focus group discussions, and key informant interviews were used to collect primary data from selected smallholder farmers. A farm household survey was undertaken by using a well-prepared survey questionnaire. Firstly, focus group discussions, key informant interviews, and structured observations were conducted to draft the survey questionnaire. For this purpose, about eight focus group discussions and 15 key informant interviews were held with smallholder farmers and stakeholders to design a sound survey questionnaire. Then, a pretest interview with 50 randomly selected smallholder farmers was undertaken to check the validity of the draft survey questionnaires. Accordingly, the pre-test report was analyzed using descriptive statistics to evaluate the consistency of the results with the existing knowledge. Additionally, the vocabulary level of the questionnaire and the time length were also evaluated during the pretest survey. Next to this, the authors presented the pretest results to smallholder farmers, development agents, and stakeholders to validate the pretest results. Then, the final survey questionnaire was developed considering the results of the pretest survey and comments during the presentation. Finally, well-trained enumerators who have good experience in the household survey were employed to gather the required data for this study. Accordingly, the survey data collection was carried out from January to February 2022. Additionally, a total of four focus group discussions and 16 key informant interviews were conducted following the survey data collection to support the findings of the quantitative data.
The purpose of this study is to measure the technical efficiency of wheat production and figure out sources of technical inefficiency of wheat production among smallholder farmers in Debre Elias woreda. Thus, smallholder wheat producers were the target population of this study. As a result, a three-stage random sampling technique was applied to select representative samples to address the objectives of this study. In the first stage, four sample kebeles were selected in consultation with the agriculture office of the Debre Elias Woreda. In the second stage, the number of sample smallholder farmers was selected from sample kebeles using probability proportional to sample size. Finally, 400 smallholder farmers were selected using a systematic sampling technique.
2.3. Analytical techniques
2.3.1 Descriptive statistics
Frequency, percentage, mean, and standard deviation were used to summarize and present the demographic, socio-economic, and institutional characteristics of sample respondents. The data were analyzed using SPSS 22.0 and STATA 15 statistical software.
2.3.2 Stochastic frontier model
Technical efficiency measures the difference between actual and potential outputs considering efficient use of scarce resources (Behr, Citation2015). Accordingly, stochastic frontier and data envelopment analysis are frequently applied to measure technical efficiency (Baten & Hossain, Citation2014). Particularly, stochastic frontier accurately report the effects of noise from the inefficiency component (Coelli et al., Citation2005). Besides, it is appropriate to measure the relationship between multiple input and a single output variables (Aigner et al., Citation1977). In contrast, data envelopment analysis could not report the effects of noise and inefficiency components separately. Moreover, it is functional for the analysis of multiple outputs and input variables. Consequently, the stochastic frontier model is more appropriate than data envelopment analysis in agricultural efficiency analysis to capture sources of technical inefficiency (Ozkan et al., Citation2009). Therefore, the stochastic frontier model was applied to estimate wheat production technical efficiency.
Technical efficacy in agricultural production is estimated using the Cobb-Douglas and translog functional forms. The Cobb-Douglas functional form is frequently applied in the technical efficiency analysis (Baten & Hossain, Citation2014) because the interaction effect of input variables results in a collinearity problem. Following this assumption, a log-likelihood ratio test was conducted to select the right technical efficiency analysis model. Additionally, collinearity diagnosis was tested following the estimation using the translog production function. Accordingly, the log-likelihood ratio test and collinearity diagnosis results confirm that Cobb-Douglas functional form is appropriate to estimate the technical efficiency level of wheat production. Consequently, the Cobb-Douglas production function was employed and specified as follows:
Where, lnyi is the natural logarithm of wheat output, β is the slope of input variables, xi represents input variables, is the inefficiency term,
is a random error term and n are the number of observations.
Technical efficiency is defined as the ratio of actual output to corresponding frontier output conditional on input levels. As a result, technical efficiency can be calculated as follows:
Accordingly, technical efficiency can be calculated using the following formula:
Where yi and are the actual and potential yields of wheat, and TEi and TIEi are the technical efficiency and inefficiency of the ith farmer in wheat production.
According to Battese and Coelli (Citation1995), , and
illustrates a deviation from the frontier due to noise, inefficiency and total deviation, respectively. The total output variation is given by gamma (
) which ranges from zero and one. A zero value implies no technical inefficiency among farmers. On the other hand, one implies the total deviation is due to technical inefficiency. Accordingly, the total deviation and gamma (
) were calculated using the following formula:
Furthermore, the following formula was used to calculate potential wheat yield (y*), wheat yield gap (WYg), monetary value of wheat yield gap (MVYg), and returns to scale (RTS) (Abera, Citation2019; Bempomaa & Acquah, Citation2014; Hasan & Islam, Citation2010).
Where, p is wheat market price.
2.3.3 Beta regression model
In technical efficiency studies, researchers and policymakers focus on estimating the level of technical inefficiency and analyzing its determinant to figure out major sources of technical inefficiency for intervention (Alemu et al., Citation2018). Hence, researchers and academicians have applied econometric models to figure out sources of technical inefficiency to provide empirical evidence to stakeholders and policymakers. For example, Fadzim et al. (Citation2017) examined sources of technical inefficiency of cocoa-producing farmers in Malaysia using the Tobit model. Similarly, Thomas et al. (Citation2020) identified sources of technical inefficiency of tomato production among smallholder farmers in Kenya. On the other hand, Anaye et al. (Citation2020) applied ordinary least square to analyze determinants of technical inefficiency of teff production in Ethiopia. Additionally, Tauer and Belbase (Citation1987) figure out the technical inefficiency of New York dairy farms using ordinary least square. Moreover, different studies applied the Tobit and two-step stochastic frontier models to estimate wheat production technical efficiency (Alemu et al., Citation2018; Anaye et al., Citation2020; Weldegebriel, Citation2015). This illustrates that two-step stochastic frontier, Tobit, and ordinary least square econometric models are common in stochastic frontier analysis. According to Baum (Citation2008) and Gallani et al. (Citation2015), Tobit and ordinary least square models are inappropriate to examine bounded dependent variables like technical inefficiency (TIE). According to Gallani et al. (Citation2015), the predicted values in the ordinary least square lie outside the interval i.e., [0,1]. Additionally, variables bounded between a minimum and a maximum are likely to be subject to floor and ceiling effects. Therefore, the residuals generated by ordinary least square procedure are typically heteroskedastic and the estimated parameters are inefficient. Similarly, the Tobit model is not the right model to identify the sources of technical inefficiency in wheat production since technical inefficiency is measured on a scale where index scores cannot exceed the fully efficient level (Gallani et al., Citation2015). Therefore, these models are not appropriate for situations where the response is restricted to the interval [0, 1] (Ferrari & Cribari-Neto, Citation2004; Gallani et al., Citation2015). Moreover, Weldegebriel (Citation2015) explained that the two-step stochastic frontier model yields biased and inconsistent estimates due to failure in zero mean and constant variance assumption of the error term. Therefore, fractional response probit and beta regression models are introduced for bounded dependent variables like TIE following the release of Stata 14 (Baum, Citation2008). Additionally, (Ferrari, Citation2013) stated that beta regression and fractional response probit models are used to estimate the association between bounded dependent and explanatory variables. For instance, the fractional response probit model is applicable if and only if the upper and lower values of the dependent variable are included i.e., (Papke & Wooldridge, Citation2008). Therefore, the technical inefficiency score ranges from zero (fully efficient) to one (fully inefficient). The estimated TIE result revealed that the level of technical inefficiency ranges from 0.318 to 0.969. Therefore, the lower and upper bounds of the technical inefficiency level fall between zero and one i.e., 0<TIEi<1. Accordingly, the beta regression model is the right econometric model to examine bounded dependent variables because the upper and lower limit values are not available in the data set (Ferrari, Citation2013). Moreover, the beta regression model is a recent econometric model frequently applied to model bounded dependent variables in different disciplines. For example, Hunger et al. (Citation2012) analyze health-related quality of life scores over time using beta regression model. Moreover, Aktaş and Unlu (Citation2017) examined the indicator values of the well-being index for provinces in Turkey using a beta regression model. Additionally, Hunger et al. (Citation2011) underlined that the beta regression model is widely used in different disciplines to address the heteroscedasticity and normality problems of bounded dependent variables. However, beta regression model is rarely applied to analyze sources of technical inefficiency in agricultural production. Therefore, this study applied beta regression to figure out the sources of wheat production technical inefficiency among smallholder farmers. The outcome variable is subject to a beta distribution with the density function shown below (Ferrari & Cribari-Neto, Citation2004; Ferrari, Citation2013).
Where denotes the expected value of Y i.e., E(Y) =
The parameter fulfills the definition of a precision parameter because the greater the value
, the smaller the variance of the dependent variable. More specifically,
Only the mean parameter of the beta distribution is expressed as a function of covariates in the classical beta regression model; whereas, the precision parameter
is treated as a nuisance
(Hunger et al., Citation2011).
Where g(.) is a known function with 0<g(.)<1, the model is re-specified as follows using the logit link specification (Baum, Citation2008; Hunger et al., Citation2012; Papke & Wooldridge, Citation2008).
Where Xi denotes the vector of covariates,
is the slope of the constant term, and
refers to the vector of regression coefficients.
Thus, the potential explanatory variables were identified by reviewing the previous literature (Alemu et al., Citation2018; Bekele et al., Citation2009; Dessale, Citation2019; Getachew et al., Citation2020; Kebede & Adenew, Citation2011; Kelemu et al., Citation2016; Tenaye, Citation2020; Tiruneh & Geta, Citation2016; Wassie, Citation2014).The dependent and independent variables are identified, described, and hypothesized (Table ).
Table 1. Description, measurement, and expected signs of independent variables
3. Results and discussion
3.1. Descriptive statistics result
The characteristics of the sample respondents are depicted in Table . Frequency and percentage were calculated for categorical variables. Whereas mean and standard deviation were generated for continuous variables. The survey result shows that most of the respondents (66.88%) were male-headed household heads. On the other hand, about 31.8% of the respondents were literate. Furthermore, about 33.1% of sample respondents were credit service users. Likewise, 55.8%, 31.2%, and 58.4% of the respondents had access to information on the demand, supply, and price of wheat, respectively.
Table 2. Descriptive statistics of categorical and continuous variables
The sample respondents had an average dependency ratio of 0.53 members per household. Moreover, the average farm experience of the sample respondents was 23.79 years. On the other hand, the average annual income was 14,360.68 Ethiopian Birr. Likewise, sample respondents owned about 4.35TLU livestock population. On average, sample respondents walk 37.75, 24.35, and 42.08 minutes to access the extension office, all-weather road, and local wheat market, respectively (Table ). This shows that the local wheat market is far away from the respondents’ homes as compared to the extension office and all-weather road.
3.2 Inputs and output of wheat production
The efficiency of wheat output depends on the availability of inputs. Thus, the improvements in technical efficiency are due to the utilization of inputs at their maximum potential (Ayele et al., Citation2019; Kelemu et al., Citation2016). Besides, the efficient use of input is indispensable for the economic growth of developing countries like Ethiopia (Tenaye, Citation2020). Labor, land, oxen, fertilizer, and seed are the basic required inputs used by smallholder wheat producers. The most important inputs are presented in Table . The result shows that sample respondents used about 4.12 family labor for wheat production. Moreover, wheat producers heavily rely on family labor instead of hired labor. On average, sample respondents own 4TLU oxen. In Ethiopia, oxen are the main power source for traction. Therefore, having a greater number of oxen enables smallholder farmers to cultivate their wheat farm plots on time and in line with the recommended tillage frequency, which results in better wheat production and productivity. Additionally, sample respondents allocated 1.28 hectare of farm size for wheat production. In the study area, smallholder farmers allocated most of their farm size to wheat production. However, a more land size allotment is insufficient to earn a higher level of wheat productivity. Instead, efficient resource utilization is a critical factor to enhance their productivity. Additionally, smallholder farmers applied 138.84 and 153.81 kg of DAP and urea chemical fertilizers, respectively, to boost wheat production and productivity. The applications of optimal fertilizer rate to the production of wheat have a significant contribution to output growth. But fertilizer dose without efficient resource utilization is not a guarantee to achieve maximum productivity. Regarding the application of seed, wheat producers used an average of 153.81 kg of wheat seed. By using the above-mentioned input of production, sample smallholder farmers produce 3801 kg of wheat. Therefore, this study tried to evaluate whether wheat production is efficient or not. Then, the efficiency analysis result is presented in Table .
Table 3. Descriptive statistics of input and output variables
Table 4. Stochastic frontier model result of wheat production
3.3. Technical efficiency of wheat production
A stochastic frontier model was applied to measure the technical efficiency of wheat production in the study area. The model result is presented in Table . We estimated the stochastic frontier model using Cobb-Douglas and translog functional forms. Then, a log-likelihood ratio test was undertaken to select the right functional form to estimate wheat production technical efficiency. The result confirms that Cobb-Douglas functional form is more appropriate than the translog functional form. Additionally, collinearity diagnosis was conducted for Cobb-Douglas and translog functional forms. The result illustrates that the translog functional form was prone to serious collinearity problems due to the interaction effect of input variables. Accordingly, this study applied Cobb-Douglas functional form based on the log-likelihood ratio test and collinearity diagnosis results. Additionally, gamma was calculated to judge whether the stochastic frontier model is appropriate to estimate wheat production technical efficiency or not. The stochastic frontier model is an appropriate technique to estimate technical efficiency if the gamma value is closer to 1. The result shows that the estimated gamma value is 0.833 which confirms the presence of technical inefficiency. Therefore, the stochastic frontier model with Cobb-Douglas functional form is the right model to estimate the technical efficiency of wheat production in the study area. The model result confirms the theoretical concepts of the stochastic frontier model (Baten & Hossain, Citation2014; Dillon & Hardaker, Citation1980).
Accordingly, six input variables are incorporated into the stochastic frontier model to estimate the technical efficiency of wheat production. Among the variables, the number of oxen, wheat farm size, amount of urea fertilizer, and seed had a statistically significant effect on wheat production efficiency. For instance, keeping all other input variables constant, a 1% increase in the number of oxen increases the efficiency of wheat production by 0.118%. In Ethiopia, smallholder farmers heavily rely on oxen power for plot preparation, sowing, and threshing of wheat (Getachew et al., Citation2020). Moreover, Nitsuh (Citation2019) added that smallholder farmers with oxen are more likely to cultivate their farmland in time to reap better wheat output. Therefore, oxen ownership has a paramount contribution to improving the production and managerial capacity of wheat producer farmers. Therefore, this finding is consistent with the findings of previous studies (Ayele et al., Citation2019; Beshir, Citation2016; Getachew et al., Citation2020; Moges, Citation2018).
As expected, farm size had a negative and statistically significant relationship with wheat production technical efficiency at p < 0.01 level of significance. This illustrates that a small farm size is more productive than a large farm size (Aragon et al., Citation2022). Large farm size decreases smallholder farmers’ optimum resource use efficiency and application of the required inputs to maximize wheat productivity. Therefore, a large farm size needs more managerial capacity than a small farm size to enhance wheat productivity. On the contrary, smallholder farmers have limited managerial capacity in agricultural production. Therefore, small farm size fits with the existing situations of smallholder farmers. Similarly, farmers who have large farm sizes may waste their time moving between the farms (Ayele et al., Citation2019). Keeping all other input variables constant, a 1% increase in farm size decreases the wheat production technical efficiency by 0.214%. The study is in line with the finding of (Kebede & Adenew, Citation2011). Yet, the finding is contradicted by previous studies (Getachew et al., Citation2020; Kaur et al., Citation2010; Kelemu & Negatu, Citation2016; Wassie, Citation2014).
Fertilizer is an important factor of production that facilitates the growth and outputs of crops like wheat. The model result shows that urea fertilizer and technical efficiency of wheat production had a positive and significant association at p < 0.01 significance level. This implies that urea fertilizer is a nutrient-rich input to boost the immediate growth of crops (Kebede & Adenew, Citation2011).
Additionally, Tamene et al. (Citation2017) underscored that an increase in crop yield is strongly associated with the use of chemical fertilizers which provide essential nutrients for the growth of the crops. Accordingly, a 1% increase in urea fertilizer increases the technical efficiency of wheat production by 0.523%. As a result, this result is congruent with the results of previous studies (Ayele et al., Citation2019; Beshir, Citation2016; Kaur et al., Citation2010; Kelemu & Negatu, Citation2016; Moges, Citation2018). Similarly, there is a positive relationship between the efficiency level of wheat production and the amount of wheat seed at p < 0.01 significance level. According to Zannou et al. (Citation2018), the availability of seed is the basis of crop production. Therefore, the seed is the strategic input playing an indispensable contribution to crop production and productivity. This indicates that it is impossible to gain the required production and productivity of wheat without the availability and accessibility of seed. Thus, keeping all other input variables constant, a 1% additional application of wheat seed will increase the technical efficiency of wheat production by 0.374%. Thus, this finding is in line with the results of previous studies (Beshir, Citation2016; Getachew et al., Citation2020; Kelemu & Negatu, Citation2016).
Moreover, returns to scale were estimated to measure the change in wheat production with a simultaneous change in the input variables incorporated in the stochastic frontier model. The result illustrates that the wheat production returns to scale is categorized under decreasing returns to scale (0.912). It indicates that a 1% increase in the input variables will result in a 0.912% increase in wheat production. This finding is consistent with previous studies (Beshir, Citation2016; Chiona et al., Citation2014; Dessale, Citation2019). Additionally, the potential yield and yield gap of wheat production were also estimated following technical efficiency estimation. The potential yield and yield gap of wheat were 56.98 and 18.97 quintals per hectare, respectively. This clarifies that farmers were producing 18.97 quintals per hectare less than the potential yield capacity of wheat. Consequently, farmers were producing below the production possibility frontier due to inefficient resource utilization. The monetary value of wheat yield gap was also calculated using the average market price of wheat (1quintal = 4200 Ethiopian Birr). This indicates that smallholder farmers lost 72,109.44 Ethiopian Birr per hectare due to technical inefficiency (Table ).
The minimum and maximum technical efficiency of wheat production were 0.318 and 0.969, respectively. This implies that the least efficient smallholder farmers produced 68.2% below the maximum capacity. Conversely, the most efficient smallholder farmers produced 3.1% below their maximum production capacity. The average technical efficiency level was 0.77. This shows that smallholder farmers were producing about 23% below the average production capacity (Table ). This indicates that smallholder farmers are producing below their production capacity. Therefore, the results confirm the existence of inefficiency in wheat production. This result recalls additional activities to figure out sources of technical inefficiency among smallholder farmers (See section 3.3). Additionally, the result further showed that about 43.3% of the smallholder wheat producers had a technical efficiency level below 0.78 (Figure ).
Figure 2. Technical efficiency score distribution of smallholder farmers (N = 400).
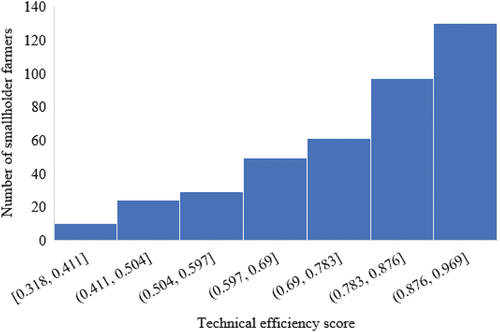
Table 5. Descriptive statistics results of the technical efficiency level of wheat production in the study area
3.3. Sources of technical inefficiency of wheat production among smallholder farmers
The beta regression model was applied to figure out the sources of technical inefficiency of wheat production among smallholder farmers. Accordingly, the technical inefficiency of wheat production was the dependent variable for the beta regression model. Then, a total of 13 explanatory variables were incorporated into the model to explain the technical inefficiency of wheat production. Then after, the model fitness was evaluated using the log-likelihood test result. Accordingly, the model fitness is significant at p < 0.01 significance level. This implies that the model is well-fitted to explain the technical inefficiency of wheat production. Finally, the model result revealed that the technical inefficiency of wheat production is influenced by various factors (Table ). Among the factors, educational status had a negative and statistically significant effect on the technical inefficiency of wheat production at p < 0.1 significance level. This shows that literate farmers are less inefficient than illiterate farmers. This is because literate farmers may have better knowledge of yield-enhancing technologies and efficient utilization of the available scarce resources than their counterparts. Additionally, they may access both the mainstream and social media regarding the current production technologies, price, supply, and demand of agricultural products which leads to a decrease in production inefficiency. Likewise, as the educational level of smallholders increases, their ability to perceive and use the improved agricultural technologies also increases (Ayele et al., Citation2019; Getachew et al., Citation2020; Tenaye, Citation2020). Moreover, literate farmers seriously hunt important production information and agricultural experts advise to enhance their production capacity (Asfaw et al., Citation2019; Dessale, Citation2019; Yami et al., Citation2013). Accordingly, literate farmers are assumed to be less technically inefficient than illiterates (Wassie, Citation2014). Technical inefficiency of wheat production decreases by 9.9% if the household head is a literate farmer. Consequently, this finding is in line with previous studies (Ali & Khan, Citation2014; Ayele et al., Citation2019; Dessale, Citation2019; Getachew et al., Citation2020; Kaur et al., Citation2010; Moges, Citation2018; Tiruneh & Geta, Citation2016; Wassie, Citation2014).
Table 6. Beta regression model output on sources of wheat production technical inefficiency
As expected, dependency ratio and technical inefficiency had a positive and statistically significant relationship at p < 0.01 significance level. This shows that an increase in the dependency ratio will increase the technical inefficiency of farmers because an increase in dependent household members adversely affects active household members’ engagement in production activities. This illustrates that active household members are responsible for fulfilling the food and non-food needs of dependent members. As a result, an increase in the number of dependent household members will decrease the farmers’ budget for factors of production because the dependency ratio increases food consumption expenditure at the household level. As a result, most of the household budget may be allocated for consumption purposes instead of investing in production activities. Thus, the presence of more dependents results in the shortage of active family labors for wheat production. As shown in the model result, a unit increase in dependency ratio will increase the technical inefficiency of wheat production by 5.7%. This indicates that the higher dependency ratio has a positive contribution to the existence of production inefficiency.
Similarly, farming experience had a negative and statistically significant effect on the technical inefficiency of wheat production at p < 0.01 significance level. Therefore, a unit increase in farming experience will decrease the technical inefficiency of wheat production by 0.4%. This entails that less experienced farmers are more inefficient than farmers who have better farming experience in wheat production. Farmers who have more farming experience have better knowledge of crop production and management, dynamics of production trends, and yield-enhancing strategies than less experienced farmers. Consequently, farmers with more farming experience become more efficient in wheat production (Kebede & Adenew, Citation2011). The implication is that farmers with a long period of farming can achieve learning by doing which directly leads to efficient utilization of scarce resources in agricultural production. Moreover, farming experience improves the decision-making skills of farmers (Dessale, Citation2019). Hence, this finding is confirmed by the results of previous studies (Hailu, Citation2020; Kaur et al., Citation2010).
As expected, distance to the local wheat market had a positive and significant influence on the technical inefficiency of wheat production at p < 0.01 significance level. The model result further revealed that an increase in the wheat market distance will increase wheat production inefficiency by 15.1%. The result illustrates that smallholder farmers who live close to the wheat output market are less inefficient than those who live further away from the wheat output market. The closer smallholder farmers are to the wheat output market, the lower the wheat production inefficiency due to improved information access on market forces dynamics. Additionally, a decrease in distance to the wheat market will reduce the cost of transportation. Accordingly, smallholder farmers easily access the market to sell their produce. Therefore, market access has an indispensable role in decreasing smallholder farmers’ inefficiency in agricultural production. The study by Endalew et al. (Citation2021) stated that smallholder farmers who are closer to the market have lower technical inefficiency because of various service accessibility. Similarly study by Awoke and Molla (Citation2019) and Ebrahim et al. (Citation2020) stated that an increase in market distance decreases smallholder farmers’ participation in the agricultural output market which will result in a decrease in the efficiency of agricultural production.
Furthermore, distance from the extension office and technical inefficiency of wheat production was positively and significantly related at p < 0.01 significance level. The result shows that wheat production inefficiency will be increased by 0.1% for a unit increase in distance from the extension office. This shows that farmers who are near the extension office can access updated agricultural information and technologies to improve their production capacity. This further entails that farmers who receive extension services will face lower production inefficiency in agriculture (Tenaye, Citation2020). On the other hand, an increase in distance from the extension office limit farmers’ information and production technology access (Ayele et al., Citation2019) which results in inefficient production. In contrast, access to wheat price information had a negative and statistically significant effect on the technical inefficiency of wheat production at p < 0.01 significance level. Keeping other variables constant, the technical inefficiency of wheat production will be decreased by 6.1% if smallholder farmers have access to wheat price information. Therefore, a price information-based production system has a paramount contribution to minimize smallholder farmers’ production inefficiency. This shows that price information access encourages smallholder farmers to produce more to maximize their agricultural income and minimize market risks.
4. Conclusion
In Ethiopia, wheat is one of the largest produced cereal crops. Moreover, wheat is one of the target crops in the strategic goal of attaining national food self-sufficiency and a major source of income for many smallholder farmers. However, its production and productivity are less than other cereal crops. Consequently, we conducted this study to measure the technical efficiency of wheat production and figure out sources of wheat production inefficiency among smallholder farmers. Accordingly, primary data was collected from 400 sample smallholder farmers. Then, stochastic frontier and beta regression models were applied to measure wheat production technical efficiency and figure out sources of wheat production inefficiency.
The stochastic frontier model result shows that the number of oxen, amount of urea fertilizer, and seed positively and significantly affected the level of technical efficiency of wheat production. However, wheat farm size had a negative and statistically significant effect on the technical efficiency of wheat production. This illustrates that an increase in the number of oxen, amount of urea fertilizer, and seed increases wheat production efficiency, unlike wheat farm size. The mean technical efficiency result indicates that smallholder farmers operate 23% below the maximum capacity of wheat production in the study area. The least efficient and the most efficient smallholder farmers produced 68.2% and 3.1% below their maximum wheat production capacity. Additionally, smallholder farmers were producing 18.97 quintals per hectare less than the potential production capacity. This illustrates that smallholder farmers were producing below the production possibility frontier due to inefficient resource utilization. Moreover, smallholder farmers lost 72,109.44 Ethiopian Birr per hectare due to technical inefficiency. Therefore, the results confirm the existence of inefficiency in wheat production.
Accordingly, the beta regression model shows that an increase in the dependency ratio, distance to the local wheat market, and distance to the extension office will increase the technical inefficiency of wheat production. On the other hand, educational status, farm experience, and access to wheat price information decrease the technical inefficiency of wheat production.
Based on the findings of this study, policy implications and future research directions were drawn based on the findings of this study. Therefore, special emphasis on mechanized ploughing is essential to reduce the inefficiency of smallholder wheat production. In addition, wheat price information should be made available to farmers through various platforms such as direct free calls, short messages and mainstream media that enable farmers to access timely and cost-effective market information. Besides, it is better to provide onsite extension services through field demonstrations and farmer research groups to motivate and incentivize farmers who live far from the extension office. Similarly, extension services and training programs should promote the use of seeds and urea, among other inputs, to increase the productivity of small farms. Furthermore, local self-help groups reduce the workload of farmers during peak production periods. Therefore, farmers and stakeholders should join and support local self-help groups to reduce the workload of household heads with more dependent household members. Likewise, market access, roads and transport services are engines for increasing farmers’ productive capacity. Therefore, local, regional, and national governments should focus on market access, roads, and transport services to reduce their production inefficiencies. Moreover, experience sharing platforms should be established, promoted, and implemented to strengthen social networks and peer learnings among farmers. Additionally, Academicians and researchers should undertake further research using plot-level physical and survey data to provide more concrete information for policy makers, stakeholders, and other researchers.
Disclosure statement
No potential conflict of interest was reported by the authors.
Additional information
Notes on contributors
Birara Endalew
Birara Endalew joined the College of Agriculture and Environmental Sciences at Bahir Dar University in 2014 after completing his bachelor’s degree in Agricultural Economics at the College of Agriculture and Veterinary Medicine at Jimma University. After a year of work experience, he was awarded an in-country scholarship at Bahir Dar University. He obtained a master’s degree in Agricultural Economics from Bahir Dar University. The author has made significant contributions to teaching and research. His research interests include environmental resource valuation, food security, impact assessment, agricultural commercialization, value chain analysis, livelihood analysis, poverty analysis, technical efficiency, and adoption. In addition, Birara Endalew has reviewed manuscripts for the journals Cogent Food and Agriculture, Advances in Agriculture, and Trees and Livelihood, and has received more than six certificates in recognition of his hard work as a peer reviewer. He is currently pursuing his PhD at Tottori University, Japan.
Notes
1. 1USD = 50.05 Ethiopian Birr.
2. SD=Standard Deviation.
References
- Abera, N. (2019). Technical efficiency of smallholder Teff production. Open Access Journal of Agricultural Research: OAJAR-100015, 2019(1), 1–18.
- Aigner, D., Lovell, C. K., & Schmidt, P. (1977). Formulation and estimation of stochastic frontier production function models. Journal of Econometrics, 6(1), 21–37. https://doi.org/10.1016/0304-4076(77)90052-5
- Aktaş, S., & Unlu, H. (2017). Beta regression for the indicator values of well-being index for provinces in Turkey. Journal of Engineering Technology and Applied Sciences, 2(2), 101–111. https://doi.org/10.30931/jetas.321165
- Aleminew, A., Alemayehu, G., Adgo, E., & Herrero, V. (2015). Response of noug (Guizotia abyssinica Cass.) to Np fertilizers application and seeding rates on yield and yield components in Ebinat District, Amhara Region, Ethiopia. World Journal of Agricultural Sciences, 11(2), 70–83.
- Alemu, M. D., Tegegne, B., & Beshir, H. (2018). Technical efficiency in Teff (Eragrostisteff) production: The case of smallholder farmers in Jamma district, South Wollo Zone, Ethiopia. Journal of Agriculture and Rural Development, 4(2), 513–519.
- Ali, S., & Khan, M. (2014). Technical efficiency of wheat production in district Peshawar, Khyber Pakhtunkhwa, Pakistan. Sarhad Journal of Agriculture, 30(4), 433–441.
- Anaye, A. A., Awel, M., Oljirra, A., Bayessa, M., Aliyi, I., & Faris, A. (2020). Determinants of productivity and efficiency of teff production in southwest. Parametric approach.
- Aragon, F. M., Restuccia, D., & Rud, J. P. (2022). Are small farms really more productive than large farms? Food Policy, 106, 102168. https://doi.org/10.1016/j.foodpol.2021.102168
- Asfaw, M., Geta, E., & Mitiku, F. (2019). Economic Efficiency of Smallholder Farmers in Wheat Production: The Case of Abuna Gindeberet District, Western Ethiopia. Review of Agricultural and Applied Economics, 22(1), 65–75. https://doi.org/10.15414/raae.2019.22.01.65-75
- ATA. (2014). Agricultural Transformation Agency.
- ATA. (2018). Ethiopian agricultural transformation agency Annual report.
- Awoke, W., & Molla, D. (2019). Market chain analysis of potato and factors affecting market supply in West Gojam Zone, Ethiopia. Journal of Development and Agricultural Economics, 11(2), 44–51. https://doi.org/10.5897/JDAE2018.0988
- Ayele, A., Haj, J., & Tegegne, B. (2019). Technical efficiency of wheat production by smallholder farmers in Soro district of Hadiya zone, southern Ethiopia. East African Journal of Sciences, 13(2), 113–120.
- Baten, A., & Hossain, I. (2014). Stochastic frontier model with distributional assumptions for rice production technical efficiency.
- Battese, G. E., & Coelli, T. J. (1995). A model for technical inefficiency effects in a stochastic frontier production function for panel data. Empirical Economics, 20(2), 325–332. https://doi.org/10.1007/BF01205442
- Baum, C. F. (2008). Stata tip 63: Modeling proportions. The Stata Journal, 8(2), 299–303. https://doi.org/10.1177/1536867X0800800212
- Behr, A. (2015). Production and efficiency analysis with R. Springer.
- Bekele, A., Viljoen, M. F., Ayele, G., & Ali, S. (2009). Effect of Farm Size on Efficiency of Wheat Production in Moretna-Jirru District in Central Ethiopia. Indian Journal Agricultural Economics, 64(1), 133–143.
- Bempomaa, B., & Acquah, H.D. -G. (2014). Technical efficiency analysis of maize production: Evidence from Ghana. Applied Studies in Agribusiness and Commerce, 8(2–3), 73–79. https://doi.org/10.19041/APSTRACT/2014/2-3/9
- Beshir, H. (2016). Technical efficiency measurement and their differential in wheat production: The case of smallholder farmers in South Wollo. IJEBF, 4(1), 1–16.
- Chiona, S., Kalinda, T., & Tembo, G. (2014). Stochastic frontier analysis of the technical efficiency of smallholder maize farmers in Central Province, Zambia. The Journal of Agricultural Science, 6(10), 108–118. https://doi.org/10.5539/jas.v6n10p108
- Coelli, T. J., Rao, D. S. P., O’Donnell, C. J., & Battese, G. E. (2005). An introduction to efficiency and productivity analysis. Springer Science & Business Media.
- Cribari-Neto, F., & Zeileis, A. (2009). Beta regression in R.
- CSA. (2014). Agricultural sample survey report on area and production of major crops. Statistical Bulletin (532), VI(1), 1–121.
- CSA. (2021). Area and production of major crops. The Federal Democratic Republic of Ethiopia Central statistical agency agricultural sample survey, 578(1), 1–147.
- Dessale, M. (2019). Analysis of technical efficiency of smallholder wheat-growing farmers of Jamma district, Ethiopia. Agriculture & Food Security, 8(1), 1–8. https://doi.org/10.1186/s40066-018-0250-9
- Dillon, J. L., & Hardaker, J. B. (1980). Farm management research for small farmer development (Vol. 41). Food & Agriculture Org.
- Dlamini, S. I., Masuku, M. B., & Rugambisa, J. (2012). Technical efficiency of maize production in Swaziland: A stochastic frontier approach. African Journal of Agricultural Research, 7(42), 5628–5636. https://doi.org/10.5897/AJAR12.1204
- Dorosh, P., Robinson, S., & Thurlow, J. (2015). Implications of agricultural productivity growth for structural change and employment in Ethiopia. Paper presented at the EDRI-IFPRI Seminar, Addis Ababa,
- Duguma, B., Kechero, Y., & Janssens, G. P. J. (2012). Productive and Reproductive Performance of Zebu X Holstein-FriesianCrossbred Dairy Cows in Jimma Town, Oromia, Ethiopia. Global Veterinaria, 8(1), 67–72.
- Ebrahim, E., Jema, H., & Bosena, T. (2020). Determinants of vegetables market supply in case of Habru district, North Wollo Zone, Ethiopia. International Journal of Sciences & Applied Research, 7(4), 1–12.
- Endalew, B., Anteneh, A., & Tasie, K. (2021). Technical efficiency of teff production among smallholder farmers: Beta regression approach. European Journal of Development Research, 34(2), 1076–1096. https://doi.org/10.1057/s41287-021-00417-w
- Fadzim, W. R., Azman Aziz, M. I., & Abdul Jalil, A. Z. (2017). Efficiency of smallholder cocoa farmers in Malaysia: A DEA approach. International Journal of Supply Chain Management (IJSCM), 6(1), 214–219.
- Ferrari, S. (2013). Beta regression modeling: Recent advances in theory and applications: Working Paper.
- Ferrari, S., & Cribari-Neto, F. (2004). Beta regression for modelling rates and proportions. Journal of Applied Statistics, 31(7), 799–815. https://doi.org/10.1080/0266476042000214501
- Gallani, S., Krishnan, R., & Wooldridge, J. M. (2015). Applications of fractional response model to the study of bounded dependent variables in accounting research. Harvard Business School.
- Galvez-Nogales, E. (2010). Agro-based clusters in developing countries: Staying competitive in a globalized economy. Agricultural Management, Marketing and Finance Occasional Paper (FAO).
- Getachew, T., Metema, M., Goshu, D., & Abebaw, D. (2020). Technical efficiency of wheat producers in north shewa zone of Amhara region, Central Ethiopia. Sustainable Agriculture Research, 9(526–2021–482), 77–86. https://doi.org/10.5539/sar.v9n3p77
- Gudina, D. (2011). Farmland Fragmentation and Its Impact onFood Production in Highland Villages of Seru District. Oromia Regional State.
- Hagos, M., Namara RE, G., & Awulachew, S. B. (2009). Importance of Irrigated Agriculture to the Ethiopian Economy: Capturing the Direct Net Benefits of Irrigation. 37.
- Hailu, D. (2020). Determinants of Technical Efficiency in Wheat Production in Ethiopia. International Journal of Agricultural Economics, 5(5), 218–224. https://doi.org/10.11648/j.ijae.20200505.19
- Hasan, M. K., & Islam, S. F. (2010). Technical inefficiency of wheat production in some selected areas of Bangladesh. Bangladesh Journal of Agricultural Research, 35(1), 101–112. https://doi.org/10.3329/bjar.v35i1.5871
- Hunger, M., Baumert, J., & Holle, R. (2011). Analysis of SF-6D index data: Is beta regression appropriate? Value in Health, 14(5), 759–767. https://doi.org/10.1016/j.jval.2010.12.009
- Hunger, M., Döring, A., & Holle, R. (2012). Longitudinal beta regression models for analyzing health-related quality of life scores over time. BMC Medical Research Methodology, 12(1), 1–12. https://doi.org/10.1186/1471-2288-12-144
- Kaur, M., Mahal, A. K., Sekhon, M., & Kingra, H. (2010). Technical efficiency of wheat production in Punjab: A Regional Analysis. Agricultural Economics Research Review, 23(347–2016–17029), 173–180.
- Kebede, K., & Adenew, B. (2011). Analysis of Technical Efficiency: Lessons and Implications for Wheat Producing Commercial Farms in Ethiopia. Journal of Economics and Sustainable Development, 2(8), 39–47.
- Kelemu, K., Haregewoin, T., & Daniel, F. (2016). Impact of Radio on Technical Efficiency of Farmers: The Case of Wheat Producing Farmers in Ethiopia. Ethiopian Journal Applied Science and Technology, 7(1), 1–15.
- Kelemu, K., & Negatu, W. (2016). Analysis of levels and determinants of technical efficiency of wheat producing farmers in Ethiopia. African Journal of Agricultural Research, 11(36), 3391–3403. https://doi.org/10.5897/AJAR2016.11310
- Kotu, B. H., Verkuijl, H., Mwangi, W., & Tanner, D. (2000). Adoption of improved wheat technologies in Adaba and Dodola Woredas of the. CIMMYT.
- Louhichi, K., Temursho, U., Colen, L., & Paloma S, G. Y., (2019). Upscaling the productivity performance of the Agricultural Commercialization Cluster Initiative in Ethiopia, an assessment using a farm household level model. Science for Policy report, Luxembourg.
- Mazengia, Y. (2016). Smallholders commercialization of maize production in Guangua district, northwestern Ethiopia. World Scientific News, 58(2016), 65–83.
- Melaku, A., & Abebe, A. (2012). Bovine Trypanosomosis and Its Vector Type and Density at Debre Elias District, North-western, Ethiopia. Journal of Advanced Veterinary Research, 2(4), 247–251.
- Moges, D. (2018). Measurement of technical efficiency and its determinants in wheat production: The case of smallholder farmers in wogidi district, south wollo zone Ethiopia. Food Science and Quality Management, 81(2018), 86–93.
- Nitsuh, H. (2019). Market Chain Analysis of Teff (Eragrostistef): The Case of Dejen District. East Gojam Zone.
- Ozkan, B., Ceylan, R. F., & Kizilay, H. (2009). A review of literature on productive efficiency in agricultural production. Journal of Applied Science Research, 5(7), 796–801.
- Papke, L. E., & Wooldridge, J. M. (2008). Panel data methods for fractional response variables with an application to test pass rates. Journal of Econometrics, 145(1–2), 121–133. https://doi.org/10.1016/j.jeconom.2008.05.009
- Pingali, P. L. (1997). From subsistence to commercial production systems: The transformation of Asian agriculture. American Journal of Agricultural Economics, 79(2), 628–634. https://doi.org/10.2307/1244162
- Taffesse, A. S., Dorosh, P., & Asrat, S. (2012). Crop Production in Ethiopia: Regional Patterns and Trends, working paper, International Food Policy Research Institute, Ethiopia Strategy Support Program II,
- Tamene, L., Amede, T., Kihara, J., Tibebe, D., & Schulz, S. (2017). A review of soil fertility management and crop response to fertilizer application in Ethiopia: Towards development of site-and context-specific fertilizer recommendation. CIAT publication, 443(2017), 1–86.
- Tauer, L. W., & Belbase, K. P. (1987). Technical efficiency of New York dairy farms. Northeastern Journal of Agricultural and Resource Economics, 16(1), 10–16. https://doi.org/10.1017/S0899367X00000313
- Tenaye, A. (2020). Technical Efficiency of Smallholder Agriculture in Developing Countries: The Case of Ethiopia. Economies, 8(34), 1–27. https://doi.org/10.3390/economies8020034
- Thomas, M. M., Samuel, N. N., & Hezron, N. I. (2020). Technical efficiency in tomato production among smallholder farmers in Kirinyaga County, Kenya. African Journal of Agricultural Research, 16(5), 667–677. https://doi.org/10.5897/AJAR2020.14727
- Tiruneh, W. G., & Geta, E. (2016). Technical efficiency of smallholder wheat farmers: The case of Welmera district, Central Oromia, Ethiopia. Journal of Development and Agricultural Economics, 8(2), 39–51. https://doi.org/10.5897/jdae2015.0660
- Wassie, S. B. (2014). Technical Efficiency of Major crops In. Stochastic Frontier Model.
- Weldegebriel, H. (2015). The determinants of technical efficiency of farmers in Teff, Maize and Sorghum production: Empirical evidence from Central Zone of Tigray Region. Ethiopian Journal of Economics, 23(683–2017–947), 1–36.
- Yami, M., Solomon, T., Begna, B., Fufa, F., Alemu, T., & Alemu, D. (2013). Source of technical inefficiency of smallholder wheat farmers in selected waterlogged areas of Ethiopia: A translog production function approach. African Journal of Agricultural Research, 8(29). https://doi.org/10.5897/ajar12.2189
- Zannou, A., Chogou, S. K., Saliou, I. O., & Biaou, G. (2018). Technical efficiency of irrigated rice seed farmers in Koussin-Ll, Benin Republic. Journal of Development and Agricultural Economics, 10(1), 28–37. https://doi.org/10.5897/JDAE2017.0882