
 ?Mathematical formulae have been encoded as MathML and are displayed in this HTML version using MathJax in order to improve their display. Uncheck the box to turn MathJax off. This feature requires Javascript. Click on a formula to zoom.
Abstract
This paper examines the presence of a contagion effect between Chinese and G20 stock markets as well as its intensity over a recent period from 1st January 2013 to 7 April 2022. The empirical study is conducted using the time-varying copula approach. The obtained results show strong evidence of a contagion effect between China and all countries except United States America, Argentina and Turkey during the COVID-19 period. In particular, the Chinese stock market exhibits the highest level of dependence with the Asian and European stock markets in addition to the greatest variability in dependence. These findings are interesting and have important implications for several financial applications.
Public Interest Statement
This paper investigates the existence of the contagion effect between China and the stock markets of the Group of the 20 and compares its intensity over the recent period from 1st January 2013 to 7 April 2022 including several waves of the Covid-19 pandemic and the vaccination. The empirical results show evidence of contagion effect during Covid-19 period. In particular, the Asian and European stock markets show the strongest level of dependence with the Chinese one as well as the highest level of variabbility. These findings can help investors to better diversify their portfolios and to more manage risk during downturns and upturns markets.
1. Introduction
The last years have seen the appearance of a suddenFootnote1 and an unprecedented infectious disease, called the coronavirus disease 2019 (COVID-2019), which was discovered for the first time in December 2019, in Wuhan, China. A typical feature of this virus is that it has quickly spread across the world. On 11 March 2020, it has been declared by the World Health Organization (WHO) as a global pandemic. As of 7April 2022, there were more than 500 million confirmed cases and 6 million deaths in over 220 countries. As a result, the governments of the world’s largest countries have enforced border shutdowns including extreme quarantine, closing off large cities, restraining people to their homes and restricting travel, all of which may have affected the global economy. Goodell (Citation2020) highlighted that COVID-19 has affected the financial markets either directly or indirectly. Azimli (Citation2020) reported that the significant impact of COVID-19 on the stock markets relates to two important channels. First, high unprediction of future cash-flows which are the most important components of stock value. Baker et al. (Citation2020) argued that no previous infectious disease has affected the stock market as forcefully as COVID-19. David et al. reported that COVID-19 had more important effects on stock markets than previous diseases (EBOLA, MERS and SARS). Gunay (Citation2020) found that the impact of COVID-19 on the global financial system is greater than the global financial crisis. Yarovaya et al. (2022) have described COVID-19 as a black swan event: a situation that has never previously occurred.
The observable effect of COVID-19 on the stock markets has been largely explored. Some authors have examined the effect of the growth rate of confirmed cases and/or deaths, as measures of COVID-19, on stock market returns and documented a significant and a negative relationship between the studied variables (Al-Awadhi et al. (Citation2020), Ashraf (Citation2020), Topcu and Gulal (Citation2020), Khan et al. (2020), Bahrini and Filfilan (Citation2020), Takyi and Bentum-Ennin (Citation2021), Harjoto et al. (Citation2020)). Other authors have investigated the impact of COVID-19 on stock market volatility and reported that this latter is higher during the COVID-19 period than other stable periods (Aslam et al., Citation2021; Bai et al., Citation2020; Chaudhary et al., Citation2020; Zaremba et al., Citation2020). A recent study proposed by Spelta and Flori (Citation2021) analyzed the financial volatility cascades caused by the COVID-19 related news using concepts developed in the field of seismology in six stock markets (United States, United Kingdom, Spain, France, Germany and Italy). Their empirical results showed that the financial markets may underreact to the announcements by taking a finite time to re-adjust prices.
There is an increasing number of studies on a contagion effect during the COVID-19 period. The commonly used methods for contagion detection are correlation analyses (Chakrabarti et al., Citation2021; Okorie & Lin, Citation2021) and the DCC-GARCH type models (Akhtaruzzaman et al. (Citation2021), Belhasine and Karmati (2021), Gunay and Can (2022)). Empirically, the presence of a contagion effect is reflected in a significant increase in correlation between stock markets during the COVID-19 period.
Although correlation analysis and DCC-GARCH type models are appropriate for measuring time-varying conditional dependence and testing the presence of a contagion effect, they have several limitations. First, they assume that dependence is linear and does not allow for nonlinear dependence. Second, they suppose that tail dependence is symmetric and cannot reproduce asymmetries in the tail dependence.
To overcome these limitations, we propose the alternative approach of copula functions to investigate the contagion effect. This approach presents two main advantages. First, it is able to separate dependence from marginals without making any assumptions about their distributions. Second, it allows to model directly the tails of the distribution which should be a primary interest in a study of contagion, in particular during financial and health crises.
The copula models have been applied numerous authors to study the dependence structure between various international markets like energy and financial markets (Tsakalos et al., Citation2015) and to examine the contagion effect between stock markets during financial crises. For example, Kenourgios et al. (Citation2011) investigated the contagion effect between BRIC markets and two developed markets (US and UK) during five financial crises (Asian crisis in 1997, Russian crisis in 1998, Technology Bubble Collapse in 2000, Brazilian stock market crash in 1997–1998 and Brazilian crisis in 2002). They found evidence of contagion effect.
Few authors focused on the contagion effect between stock markets during the COVID-19 period. For instance, Alqaralleh et al. (2020) used a wavelet-based copula approach to investigate the effect of COVID-19 on contagion effect between the American and five stock markets (Canada, UK, Japan, Hong Kong and China). They found evidence of a contagion effect at high frequencies only. Benkraiem et al. (Citation2022) applied elliptical and Archimedean copulas to investigate contagion effect between the Chinese stock market and ten Asian countries as well as four American countries. They showed that the contagion effect is more intensive in the American region than in the Asian region.
Despite the fact that these studies provide evidence of asymmetric tail dependence, they consider Archimedean copulas which assume that the parameters and the tail dependence coefficients are constant over time. This assumption seems to be restrictive since these parameters are time-varying. More specifically, they are supposed to increase during the COVID-19 period.
To overcome this shortcoming, Uddin et al. (Citation2022) used the time-varying dynamic conditional correlation Student-t copula approach to examine the contagion effect between the stock markets during the COVID-19 period. However, they considered the global financial market as a contagion source while several authors chose China as a contagion source and focused on Asian countries only. In addition, the study period ends in December 2020 and thus the authors did not examine the impact of vaccination on the contagion effect.
In this paper, we propose to examine the contagion effect between the Chinese and G20 stock markets and we determine its degree intensity over a recent period from 1st January 2013 to 7 April 2022, using the time-varying copulas approach of Patton (Citation2006).
The originality of this approach is to reproduce simultaneously the lower and the upper tail dependence as well as the time-varying patterns of dependence. Interestingly, the functional form of the copula is assumed to be fixed throughout the period whereas the copula parameter and the tail dependence coefficients vary according to some evolution equation. Following previous studies like that of Kenourgios et al. (Citation2011) and Wang et al. (Citation2021), we consider the lower tail dependence and the upper tail dependence as the main measurement of both contagion effect and contagion channels transmission.
This paper contributes to the literature in several ways. First, we test and compare the contagion effect between the Chinese and other G20 stock markets over a recent period representing several COVID-19 waves as well as the introduction of vaccination, in contrast to previous studies which focus their analysis on a specific period. For example, Khalfaoui et al. (Citation2021), Rouatbi et al. (Citation2021) and Mohd Hasan Abdullah et al. (2022) have examined the impact of vaccination on stock markets and showed a positive effect, but they consider a short period that excludes the different COVID-19 waves. In this paper, we consider a longer period that includes both COVID-19 waves and the introduction of vaccination.
Second, we compare the contagion intensity in the Group of the G20 countries. The advantage of this Group is to include various countries from all regions and to contain developed and emerging stock markets. Third, we apply the time-varying copula approach that allows us to capture the asymmetric dependence structure and the dynamic correlation. To the best of our knowledge, no study has examined the contagion effect between the stock markets during both COVID-19 and vaccination periods using the time-varying copula approach. Four, understanding the contagion mechanism of the COVID-19 pandemic may help investors to make appropriate hedging decisions against market downturns and risk managers to mitigate risk from the source country to another.
The remainder of this paper is structured as follows. Section 2 reviews the literature on contagion effect between stock markets. Section 3 describes the data and reports the descriptive statistics. Section 4 describes the time-varying copula econometric approach and develops the hypotheses to be tested. Section 5 reports the empirical results and discusses their practical implications. Section 5 concludes the paper.
2. Literature review
It is well known that financial contagion is a result of a global event that originates in one country and spreads rapidly to other countries or regions. In the literature, several definitions have been proposed. According to Forbes and Rigobon (Citation2002), the concept of contagion can be defined as a « significant increase in cross market linkages after a shock ». Beakaert et al. (Citation2005) define contagion as « an increase in the level of correlation over and above what is expected ». Jokipii and Lucey (Citation2006) provided an alternative definition which associates contagion effects to « structural break producing an intensification of relationships during a period of turmoil ».
Numerous studies have argued that international contagion effects between the stock markets take place during different economic and financial crises such as the October crash in 1987 (M. King & Wadhwani, Citation1990), the Mexican currency crisis in 1994 (Caramazza et al., Citation2004), the Asian financial crisis in 1997 (M. R. King, Citation2010), the global financial crisis in 2007–2009 (Bastianin (Citation2009), Wen et al. (2012), Westener and Madlener (2012),Chen et al. (2014), Hoseli and Reka (Citation2015), Jayech (Citation2016), Zhang and Liu (Citation2018), Cubillos-Rocha et al. (Citation2019) and Nitoi and Pochea (Citation2020), Wang et al. (Citation2021))) and the European debt crisis in 2012 (Kenourgios et al., Citation2018; Petmezas & Santamaria, Citation2014). The most commonly used methods are correlation analysis (M. King & Wadhwani, Citation1990), correlation networks (Giudici et al. (Citation2020), Giudici and Polinesi (Citation2021) and Nie (Citation2022)) and copulas approach (Kenourgios et al., Citation2011; Rodriquez, Citation2007).
Other authors have highlighted the contagion effects during health crises like SARS in 2003 (Bhuyan et al. (Citation2010) and the AH1N1 influenza (Pechham, Citation2013). For the latest COVID-19 crisis, several authors have noticed the presence of a contagion effect between the stock markets using different methods. Using detrended moving cross correlation and detrended cross-correlation techniques, Okorie and Lin (Citation2021) examined contagion effects on the stock markets of the top 32 coronavirus affected countries until 31st march 2020 over two separate subperiods: a stable period (from 1 October 2019 to 31 December 2019) and a COVID-19 period (from 1 January 2020 to 31 March 2020). They highlighted considerable fractal contagion effects on both stock market returns and volatilities. In particular, they found that this effect is stronger for economies with a higher number of confirmed COVID-19 infected people. Using the same econometric method, Chakrabarti et al. (Citation2021) documented evidence of contagion effects in the G20 countries over two subperiods: a pre-COVID 19 period (from 1 January 2015 to 31 December 2019) and a post COVID-19 period (from 1 January 2019 to 25 May 2020).
Akhtaruzzaman et al. (Citation2021) applied a VARMA-DCC-GARCH model to investigate how contagion effects occur across financial and non-financial firms between China and G7 countries over two subperiods: a pre-COVID-19 period (from 1 January 2013 to 30 December 2019) and a COVID-19 period (from 31 December 2019 to 20 March 2020). They found significant time-varying conditional correlations between stock market returns. In particular, an increase in correlation is higher for financial firms indicating a strong contagion effect. In addition, they showed that optimal hedge ratios increase significantly in most cases indicating thus a higher hedging costs during the COVID-19 period. Using the same econometric approach, Gunay (Citation2020) reported contagion effects during COVID-19 period. In particular, they found that the effect of COVID-19 pandemic on the stock markets is greater than the GFC. Applying a wavelet approach, Matos et al. (Citation2021) provided evidence of sectoral contagion effects in the American stock market over the period from 29 January 2020 to 30 June 2020. Employing the network models, Ahelegbey and Giudici (Citation2021) study the relationship between the interconnectedness among 20 major stock markets and global market risks over the last two decades.
Although the correlation coefficients and the DCC-GARCH type models are appropriate to measure time-varying conditional correlation, they have several limitations. Indeed, they assume that dependence is linear and does not reproduce nonlinear dependence. In addition, they suppose that tail dependence is symmetric and cannot reproduce asymmetries in tail dependence. To overcome these limitations, Alqaralleh et al. (Citation2021) proposed an alternative approach based on copula theory. Specifically, they suggested a wavelet-based copula-GARCH approach to study the contagion effect between the US stock market and the five largest stock markets in the world (Canada, UK, Japan, Hong Kong and China) over two subperiods: a stable period (from 1st January 2014 to 29 November 2019) and a COVID-19 period (from 2 December 2019 to 8 August 2020). They found evidence of contagion effect at higher frequencies. However, at lower frequencies, they found evidence of interdependence between the stock market returns. Benkraiem et al. (Citation2022) applied elliptical and Archimedean copulas to investigate contagion effects between the stock market of China and ten Asian countries as well as four American countries over two subperiods: a stable period (from 1st January 2014 to 30 December 2019) and a COVID-19 period (from 31 December 2019 to 30 June 2021). They found that the value of the estimated copula parameters increases during the COVID-19 period. In particular, they showed that the American stock markets exhibit the highest increase and concluded to the fact the contagion effect is more intensive in the American region than in the Asian region. Uddin et al. (Citation2022) used a time-varying copula function to examine the contagion effect between world financial market returns and major affected Asian stock markets (China, Hong Kong, Japan and South Korea) over the period from 18 January 2018 to 31 December 2020. They found significant evidence of contagion effect due to COVID-19 pandemic.
Few studies focused on the mechanisms explaining how a crisis that takes place in one country can spread to other countries. The literature agrees on two main channels: fundamental-induced channels and investor-induced channels.Footnote2The fundamental channels include (1) a common shock, which can result in large capital outflows from emerging markets affecting the degree of co-movements, for example a major economic shift in industrial countries, a change in commodity prices or a decrease in global growth. (2) changes in trade linkages during the crisis due to a decrease in demand affecting the trade balance and other fundamentals and (3) strong intra-regional financial linkages causing the spread of a crisis shock from one country to another within the same region through trade credit decreases, direct foreign investment and other capital flows. The investor channels contain (1) a crisis occurring in the domestic market may cause a liquidity problem for a large group of investors and cause them to sell the foreign assets from their portfolios. Numerous studies have examined contagion channels during different crises periods and found mixed results. This could be explained by the studied period. As explained by Yarovaya et al. (Citation2020), in the analysis of financial contagion caused by COVID-19, there is one clear catalyst of contagion that can be accurately time stamped. This characteristic distinguishes it from previous crises. Indeed, studies that examined contagion effect during the GFC emphasize that it is hard to identify the very beginning and the end of it. Consequently, timelines and crisis periods vary substantially across those studies. In case of COVID-19, we can consider a clear timeline of virus spread across regions and countries. More specifically, the impact of vaccination on the virus spread and the decline of new confirmed cases across countries can indicate « the beginning of the end » of the pandemic. Therefore, in the case of COVID-19 crisis, the contagion effect has one single cause which is COVID-19. Indeed, there are several unique variables that can represent the speed of contagion, for example the number of confirmed cases and the number of deaths.
3. Data and descriptive statistics
This section presents the data and reports the descriptive statistics.
3.1. Data
Our data consists of daily closing stock markets indices of the G20 countries over a ten-year period from 1st January 2013 through 7 April 2022. We chose a relatively stable period before the occurrence of the COVID-19 pandemic to avoid the effect of other exogenous shocks or crises that might affect the stock markets. The data is collected from the DataStream database. Our sample includes developed as well as emerging stock markets and can be divided into five groups of countries according to five regions of the world. The first one is Asia (China, South Korea, Japan, India, Indonesia, Russia, Saudi Arabia and Turkey). The second region includes Europe (Germany, Italy, United Kingdom, France and Spain). The third region represents America (Canada, United States, Mexico, Brazil and Argentina). The fourth region is Oceania (Australia) and the fifth region is Africa (South Africa). Table lists the countries and their corresponding stock market indices.Footnote3
Table 1. List of countries with corresponding region and stock market indices
We omitted observations for which the daily stock market indices were not available because their stock markets were closed on weekends or national holidays. Therefore, the final dataset consists of 2418 observations for each country. The daily stock market return of each country () is calculated from the daily stock market index (
) using
To reproduce both the impact of the COVID-19 pandemic and the vaccination program, we divide the sample period into three subperiods: a calm period (from 2 January 2013 to 30 December 2019, 1824 observations), the COVID-19 period (from 31 December 2019 to 14 December 2020, 250 observations) and the vaccination period (from 15 December 2020 to 7 April 2022, 343 observations). As suggested by previous studies (Akhtaruzzaman et al., Citation2021), we consider 31 December 2019, as the starting date of the COVID-19 period. In addition, we use 15 December 2020 as the starting date of the vaccination period. The choice of this date is justified by the availability of information about vaccination.
The application of unit root tests without and with structural breaks indicate that there is no evidence of unit root and that all stock market return series (over the entire period and for each subperiod) follow a stationary process.Footnote4
To investigate the contagion effect during the COVID-19 period, we have considered China and the G20 countries for the following reasons. First, China is the source of COVID-19 since the first case of affected COVID-19 was appeared in China and then in the other countries.Footnote5 Second, China and the G20 countries are the most coronavirus affected countries as they account for more than 70% of world confirmed cases and deaths as of 7 April 2022. The key statistics on the COVID-19 pandemic (total number of confirmed cases, total number of deaths, and total number of vaccinations) are reported in Table .
Table 2. Statistics on COVID-19 pandemic until 7 April 2022
We notice that the USA experienced the largest effect in the world and ranks first in terms of confirmed cases and deaths. India is the second most affected country in terms of confirmed cases and third in terms of deaths while Brazil ranks third in terms of confirmed cases and second in terms of deaths. China ranked the last, indicating improved COVID-19 conditions and medical facilities.
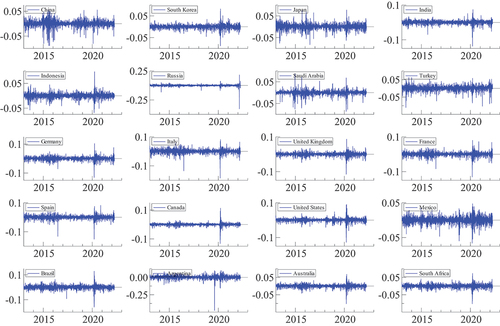
Figure represents the evolution of the G20 stock market indices and Figure represents the co-movement of the G20 stock market returns. We clearly notice a sudden decline during the COVID-19 period in all stock markets.
Figure 1. Evolution of G20 stock market indices.
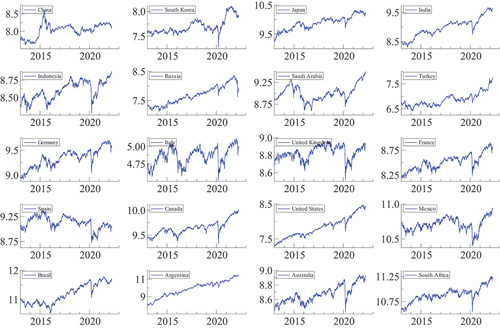
Figure 2. Evolution of G20 stock market returns.
3.2. Descriptive statistics
The descriptive statistics of the 20 daily stock market return series over the entire period as well as during each subperiod (a calm period, a COVID-19 period and a vaccination period) are reported in Tables respectively.
Table 3. Descriptive statistics of stock market returns over all period
Table 4. Descriptive statistics of stock market returns for each subperiod
As shown in Table , the means of all stock market returns are positive and close to zero with the lowest one as zero for Mexico and the largest one as 0.147% for Argentina followed by the United States and Japan. The risks measured by the standard deviations are also small ranging from 0.007 to 0.024. All stock market returns show negative skewness and excess kurtosis, indicating evidence of abnormal returns. This finding is confirmed by the results of the Jarque and Bera test (1980) which indicates that none of the stock market returns are normally distributed. Furthermore, the Ljung-Box test shows significant serial correlation and the ARCH test indicates the presence of heteroscedasticity for all stock market return series. Table reports evidence of moderate fluctuations in each subperiod: the means of most stock markets decrease while all standard deviations increase during the COVID-19 period, indicating the severe impact of the COVID-19 pandemic. However, during the vaccination period, the means of most stock markets increase while all standard deviations decrease, reflecting the positive effect of the introduction of vaccination.
4. Methodology
This section describes the econometric methodology that we will adopt to investigate contagion effect between the Chinese and G20 stock markets. The methodology is four-fold. First, we consider the linear correlation coefficient. Second, we focus on modeling the marginal distributions using a GARCH model. Third, we investigate the dependence structure using time-varying copulas. Fourth, we test the presence of contagion effect and we determine its intensity using several tests.
4.1. Linear correlation coefficient
To study dependence between the Chinese and G20 stock markets, we consider the linear correlation coefficient given by the following equation:
4.2. Modeling marginal distribution
It is well known that stock market return series exhibit stylized facts such as conditional heteroscedasticity. To take into account these features, the marginal distribution of the stock market return is assumed to be completely estimated by an AutoRegressive Generalized AutoRegressive Conditional Heteroscedastic (AR (1)-GARCH (1,1)) model expressed as:
With ,
,
.
4.3. Time-varying copula functions
The time-varying copulas were introduced by Patton (Citation2006) to allow for time-variation in the dependence structure. They represent an extension of Sklar’s theorem to the conditional case. In what follows, we give a general definition of the conditional copula and we present the used time-varying copula functions.
Definition of conditional copula:
The conditional copula is the joint distribution function of
and
. where
and
are the conditional marginal of
and
given a conditioning variable
.
Extension of Sklar’s theorem to conditional copula (Patton, Citation2006): Let be the bivariate conditional distribution of
with continuous conditional marginals
and
. Then, there is a unique conditional copula
such that:
4.3.1. Time-varying normal copula
The time-varying Normal copula is the copula of the multivariate normal distribution and is given by:
The parameter is assumed to evolve according to:
EquationEquation (5)(5)
(5) indicates that the copula parameter follows an ARMA (1.10) type process in which the autoregressive term
captures the persistence effect and the mean of the product of the last 10 observations of the transformational variables
and
capture the variation effect in the dependence.
4.3.2. Time-varying symmetrized Joe Clayton copula
The Symmetrized Joe Clayton (SJC) copula is developed by Patton (Citation2006) represents a modification of the Joe-Clayton (JC) copula. It can be written as:
Where is the Joe-Clayton copula given by:
With and
. where
is the upper tail dependence and
is the lower tail dependence.
Contrary to the Normal copula, the SJC copula can be either symmetric or asymmetric. If , then the dependence is symmetric. Otherwise, it is asymmetric. In addition, it captures the lower and the upper tail dependence at the same time. To allow for time-varying dependence, we specify that
and
vary over time according to:
Equations (7) and (8) show that the lower and the upper tail dependence parameters follow an ARMA (1, 10) type process in which the autoregressive terms and
capture persistence and the forcing variables represented by the mean absolute difference between
and
over the previous 10 observations capture the variation effect in the dependence. To estimate the time-varying copula parameters
, we use the Canonical Maximum Likelihood (CML) method. Compared to the Full Maximum Likelihood (FML) and the Inference Function for Margins (IFM) estimation methods, no assumptions about marginal distributions are needed to estimate the parameter of the time-varying copula. With CML, we perform two estimations. The first one consists in using the empirical distribution of
and
to transform them into
and
. The second consists in applying a Maximum Likelihood (ML) to estimate the parameter
by solving the following problem:
Where and
are pseudo-sample observations from the copula.
4.4. Contagion effect and intensity test
To test the contagion effect between the Chinese and each G20 stock market, we consider the two econometric approaches, which are the significant increase in cross-market correlations after the occurrence of the COVID-19 pandemic as proposed by Forbes and Rigobon (Citation2002)) and the time-varying copula approach developed by Patton (Citation2006). The first one has been largely used in the literature while the second has been applied to study the contagion effect between international stock markets during the global financial crisis (Bastianin (Citation2009), Wei and Huang (2012), Chen et al. (2014), Rajwani and Kumar (2019)). During the COVID-19 crisis, numerous studies investigated the contagion effect between stock markets using the copulas approach (Alqaralleh et al. (Citation2021), Benkraiem et al. (Citation2022) and Uddin et al. (Citation2022)). As suggested by Wang et al. (Citation2021), we use the lower and the upper tail dependence as measurements of contagion effects between theChinese and the other G20 stock markets. If there is a contagion effect, then the mean dependence coefficient of the lower tail dependence between them should significantly increase during the COVID-19 period than during the calm period. So, the first null hypothesis to be tested can be expressed as:
First null hypothesis to be tested: There is no contagion effect between the stock market of China and each G20 countries during the COVID-19 period :
Where ,
is the mean dependence coefficients of the lower tail dependence during the COVID-19 period and
is the mean dependence coefficients of the lower tail dependence during the calm period.
Several authors have found that the intensity of the contagion effect differ across countries. Okorie and Lin (Citation2021) showed that the contagion effect is stronger in countries with a higher number of confirmed cases. Likewise, Benkraiem et al. (Citation2022) found that the contagion effect is more intensive in the American region than in the Asian region. The second null hypothesis to be tested can be formulated as:
Second null Hypothesis to be tested: The intensity of the contagion effect is more pronounced in the most COVID-19 affected countries.
5. Empirical results
This section aims to identify the contagion effect between the Chinese and the G20 stock markets as well as its intensity degree during the COVID-19 period. The first step in our modelling strategy is to fit the marginal distributions. To that end, we estimate an AR (1)-GARCH (1,1) model for the stock market returns in each subperiod.Footnote6 The second step is to estimate the time-varying copula models. As mentioned above, we consider the lower tail dependence (given by EquationEquation 4(4)
(4) ) and the upper tail dependence (given by EquationEquation 5
(5)
(5) ) as the main measurements of financial contagion and contagion channels. If there is financial contagion then the lower tail dependence is higher during the COVID-19 period than during the calm one.
5.1. Linear correlation analysis
Table shows the linear correlation coefficient between the Chinese and each G20 return series during each subperiod. As reported in Table , China has the highest correlation with the Asian stock markets (South Korea, Japan, India and Indonesia) and the Australian and South African stock markets followed by the European stock markets (United Kingdom, France, Germany), while China showed the lowest correlation with the Latin American stock markets (Mexico, Brazil and Argentina). This could be explained by the geographical proximity and trade relationships. All linear correlation coefficients during the COVID-19 period are higher than those during the calm period. This increase is a sign of the contagion effect of the COVID-19 pandemic. In particular, the highest coefficients are recorded for India and Argentina indicating a more pronounced contagion effect in these countries. This could be explained by the fact that these countries are the most affected by the COVID-19 pandemic. As all stock market returns are not normally distributed, the linear correlation coefficient is not suitable to model the dependence structure between the Chinese and G20 return series, thus attesting for the contagion effect during the COVID-19 pandemic. Therefore, we must apply the copula functions.
Table 5. Linear correlation coefficients for each subperiod
5.2. Dynamic dependance structure
The time-varying SJC and time-varying normal copulas for each subperiod (Calm, COVID-19 and Vaccination) are reported in Tables respectively.
Table 6. Estimation results of time-varying SJC copulas for each subperiod
Table 7. Estimation results of time-varying SJC copulas for each subperiod
We notice that the time-varying SJC copula fits the data very well since these latter exhibit the smallest Log Likelihood, AIC and BIC, for all China-related pairs except that of United States, Argentina and Turkey.Footnote7 The parameter indicates the degree of persistence and the parameter
captures adjustment in the dependence process. The upper tail dependence coefficient
U measures dependence between stock returns when the markets are both depreciating, while the lower upper tail dependence coefficient
L measures dependence between stock returns when the markets are both appreciating.
For the 16 pairs, we notice that the lower (left) tail dependence coefficients are greater than the upper (right) tail dependence
. This indicates evidence of asymmetry in the dependence structure during market downturns than during market upturns. Then, there is a higher probability of joint extreme events during bear market than during bull markets. In particular, we notice that the Chinese stock market exhibits the highest dependence structure with the Asian stock markets (South Korea and Japan) followed by the Australian stock market and the European stock markets (United Kingdom and Germany). This finding is reasonable and can be attributable to China’s more frequent trading with these countries, which in turn is explained by geographical proximity and economic development. Another reason bears on the fact that China is a member of the ASEAN Free Trade Area (AFTA) which includes Indonesia, South Korea, Japan and Australia. These countries have agreed to eliminate trade tariffs and declare a non tariff-barriers policy between them. Furthermore, the Chinese stock market exhibit the lowest dependence structure with that of South Africa, Mexico and Brazil. This could be related to the geographical position since these countries present the furthest distance.
In terms of implications, this dynamic dependence structure among these countries has important consequences for portfolio diversification, risk management and international asset allocation. Indeed, a higher dependence between China and Asian countries is a sign of a higher risk to the financial assets of these countries. Consequently, managers should pay more attention to diversifying the investment of their assets in these countries. Indeed, when the market is down, risk diversification is less effective because of this greater dependence. Thus, financial risk managers that apply downside risk measures (like Value at Risk (VaR)) should emphasize the left side of the portfolio return distribution.
For the three pairs (China, United States), (China, Argentina) and (China, Turkey), there is neither observable tail dependence nor statistically significant level change in tail dependence. This result is consistent with those of Hu (2010) and Rajwani and Kumar (2019) who found that the time-varying normal copula captures better the dependence dynamics between the Chinese and the American stock markets.
Hence, joint extreme events were less likely to happen in these paired countries and there is no time variations in tail dependence. Therefore, the American, Argentina and Turkish stock markets were not significantly affected by the events in the Chinese stock market. Consequently, if the Chinese stock market experiences extreme market downturns or upturns, then we should not expect it would happen to China simultaneously. This would suggest that Chinese investors may reduce their diversifiable risk by adding American, Argentina or Turkish stocks to their portfolio, especially during the COVID-19 period.
5.3. Contagion effect and test of first hypothesis
To test the first null hypothesis of no contagion effect between the Chinese and each G20 stock markets, we calculate the increase of mean lower and upper tail dependence coefficients of SJC time-varying copula ( and
), for 16 pairs during the COVID-19 and Vaccination periods. The obtained results are reported in Table . For all pairs, and for each subperiod, we notice that mean lower tail dependence coefficient of SJC time-varying copulas is higher than the upper tail dependence coefficient. In addition,
is positive indicating a significant increase of the mean lower tail dependence coefficients of SJC time-varying copulas than those of the upper tail dependence in all three subperiods. In addition, all mean lower tail dependence coefficients during the COVID-19 period are higher than those of the calm one. This indicates presence of a contagion effect and allows us to reject the first null hypothesis. Consequently, investors will be unable to reap benefits through international diversification of their portfolios. This result is consistent with Kenourgios et al. (Citation2011) who provide evidence of contagion effect between BRIC stock markets and two developed markets (United States and United Kingdom) during five financial crises. It is similar to that obtained by Akhtaruzzaman et al. (Citation2021), Okorie and Lin (Citation2021), Chakrabarti et al. (Citation2021), Matos et al. (Citation2021), Alqaralleh et al. (Citation2021) and Spelta and Flori (Citation2021) who found evidence of a contagion effect during the COVID-19 period.
Table 8. Mean of lower and upper tail dependence coefficients of time-varying SJC copula for each subperiod
5.4. Contagion intensity and test of second hypothesis
Now, we test the second null hypothesis about contagion intensity and its relationship with COVID-19. To that end, we compare contagion intensity (see Table ) and the number of confirmed cases and deaths (see Table ). We notice that the most infected countries (for example, India and Brazil) experienced the highest contagion effect intensity. Bearing on these results, we accept the second null hypothesis. This result is similar to that obtained by Benkraim et al. (2022) who found that the intensity of contagion effect varies across region.
6. Conclusion
This paper examined the presence of a contagion effect between the Chinese and G20 stock markets during a recent period that include several waves of the COVID-19 pandemic and the introduction of vaccination. The used econometric approach is based on the time-varying copula approach. We defined contagion effect as a significant increase in dependence after a crisis and we consider two measures of dependence represented by the time-varying correlation and the time-varying tail dependence. The advantage of the time-varying copula approach is to reproduce both the asymmetric and the dynamic dependence structure. First, we study the marginal distributions of each stock market returns by using a GARCH model that takes into account some stylized facts. Second, we focus on the dynamic dependence structure. To this end, we estimate two different copulas which are the time-varying normal copula and the symmetrized Joe-Clayton copula.
The obtained results show that the COVID-19 pandemic has strengthened the dynamic relationship between the Chinese and 16 stock markets implying a strong evidence of contagion effect during the COVID-19 period. In particular, we found that the stock markets exhibit a higher dynamic dependence structure during the COVID-19 pandemic. This indicates that the stock markets present a higher degree of dependence in downturn markets than in upturn markets. Therefore, the stock markets are more likely to fall together than rise together. In addition, we found that the intensity of contagion effect is higher in Asian and European countries. This result is similar to that reported by previous studies. These findings are interesting and can help investors to better diversify their portfolios and to more manage risk during downturns and upturns, in particular. For the pairs (China, United States), (China, Turkey) and (China, Argentina), we found no significant dependence structure. This implies a good opportunity for hedging.
Acknowledgments
The authors would like to thank the Deanship of Graduate Studies and Scientific Research, Dar Al-Uloom University, Riyadh, Saudi Arabia, for support and funding this research work.
Disclosure statement
No potential conflict of interest was reported by the authors.
Additional information
Notes on contributors

Nadia Sghaier
Nadia Sghaier is an assistant professor of finance at the faculty of economic sciences and management of Tunis, University of Tunis el Manar, Tunisia. She obtained his Ph.D from the University of Paris Ouest Nanterre la Defense, France. She published numerous articles in indexed journals in the field of finance.
Mondher Kouki
Mondher Kouki is a professor of Finance at College of business Administration, Dar Al Uloom University ,Riyadh KSA. He obtained his PhD from the faculty of economic sciences and management of Tunis, University of Tunis el Manar, Tunisia. He has teaching experience more than 29 years across institutions in Tunisia and KSA. He published numerous papers in indexed journals in the field of financial market and corporate finance.
Samia Ben Messaoud
Samia Ben Messaoud has a Ph.D from the faculty of economic sciences and management of Tunis, University of Tunis el Manar, Tunisia. She has vast experience in academics and research in the field of finance and econometrics.
Notes
1. We would like to thank the editor David McMillan and the anonymous referees for their remarks and suggestions which helped us to improve the previous versions of this article.
2. financial contagion driven by economic fundamentals is called « shift contagion » while that induced by investors is called « pure contagion ».
3. We have included Spain because it is a permanent invited to the current G20 countries.
4. To save space, we do not report the results of the unit root tests and these informations are available upon request.
5. Following previous studies, we consider China as source of contagion.
6. To save space, the estimation results are not reported here. They are available upon request.
7. For reasons of simplicity, we do not represent the values of Log Likelihood AIC and BIC. In addition, we report only the estimation results of the selected copulas.
References
- Ahelegbey, D. F., & Giudici, P. (2021). NetVIX - a network volatility index for financial markets. Physica A Statistical Mechanics & Its Applications, 594, 127017. https://doi.org/10.1016/j.physa.2022.127017
- Akhtaruzzaman, M., Boubaker, S., & Sensoy, A. (2021). Financial contagion during COVID-19 crisis. Finance Research Letters, 38, 101604. https://doi.org/10.1016/j.frl.2020.101604
- Al-Awadhi, A. M., Alsaifi, K., Al-Awadhi, A., & Alhammadi, S. (2020). Death and contagious infectious diseases: Impact of the COVID-19 virus on stock market returns. Journal of Behavioral and Experimental Finance, 27, 100326. https://doi.org/10.1016/j.jbef.2020.100326
- Alqaralleh, H., Canepa, A., & Zanetti Chini, E. (2021). COVID-19 pandemic and stock market contagion: A wavelet-copula GARCH approach. Journal of Risk and Financial Management, 14(7), 329. https://doi.org/10.3390/jrfm14070329
- Ashraf, B. N. (2020). Stock markets’ reaction to COVID-19: Cases or fatalities? Research in International Business and Finance, 54, 101249. https://doi.org/10.1016/j.ribaf.2020.101249
- Aslam, F., Ferreira, P., Mughal, K. S., & Bashir, B. (2021). Intraday volatility spillovers among European financial markets during COVID-19. International Journal of Financial Studies, 9(1), 5. https://doi.org/10.3390/ijfs9010005
- Azimli, A. (2020). The impact of COVID-19 on the degree of dependence and structure of risk-return relationship: A quantile regression approach. Finance Research Letters, 36, 101648. https://doi.org/10.1016/j.frl.2020.101648
- Bahrini, R., & Filfilan, A. (2020). Impact of the novel coronavirus on stock market returns: Evidence from GCC countries. Quantitative Finance and Economics, 4(4), 640–28. https://doi.org/10.3934/QFE.2020029
- Bai, L., Wei, Y., Wei, G., Li, X., & Zhang, S. (2020). Infectious disease pandemic and permanent volatility of international stock markets: A long-term perspective. Finance Research Letters, 40, 101709. https://doi.org/10.1016/j.frl.2020.101709
- Baker, S. R., Bloom, N., Davis, S. J., Kost, K., Sammon, M., & Viratyosin, T. (2020). The unprecedented stock market impact of COVID-19. The Review of Asset Pricing Studies, 10(4), 742–758. https://doi.org/10.1093/rapstu/raaa008
- Bastianin, A. (2009), Modelling asymmetric dependence using copula functions: An application to value-at-risk in the energy sector. Working Paper.
- Beakaert, G., Harvey, C., & Ng, A. (2005). Market integration and contagion. The Journal of Business, 78(1), 39–70. https://doi.org/10.1086/426519
- Benkraiem, R., Garfatta, R., Lakhal, F., & Zorgati, I. (2022). Financial contagion intensity during the COVID-19 outbreak: A copula approach. International Review of Financial Analysis, 81(102136), 1–12. https://doi.org/10.1016/j.irfa.2022.102136
- Bhuyan, R., Lin, E., & Ricci, P. (2010). Asian stock markets and the severe acute respiratory syndrome (Sars) epidemic: Implications for health risk management. International Journal of Environment and Health, 4(1), 40. https://doi.org/10.1504/IJENVH.2010.033033
- Caramazza, F., Ricci, L., & Salgado, R. (2004). International financial contagion in currency crises. Journal of International Money & Finance, 23(1), 51–70. https://doi.org/10.1016/j.jimonfin.2003.10.001
- Chakrabarti, P., Jawed, M. S., & Sarkhel, M. (2021). COVID-19 pandemic and global financial market interlinkages: A dynamic temporal network analysis. Applied Economics, 1–16. https://doi.org/10.2139/ssrn.3621610
- Chaudhary, R., Bakhshi, P., & Gupta, H. (2020). Volatility in international stock markets: An empirical study during COVID-19. Journal of Risk and Financial Management, 13(9), 208. https://doi.org/10.3390/jrfm13090208
- Cubillos-Rocha, J. S., Gomez-Gonzalez, J. E., & Melo-Velandia, L. F. (2019). Detecting exchange rate contagion using copula functions. The North American Journal of Economics & Finance, 47(C), 13–22. https://doi.org/10.1016/j.najef.2018.12.001
- Forbes, K. J., & Rigobon, R. (2002). No contagion. only interdependence: Measuring stock market comovements. The Journal of Finance, 57(5), 2223–2261. https://doi.org/10.1111/0022-1082.00494
- Giudici, P., Pagnottoni, P., & Polinesi, G. (2020). Network models to enhance automated cryptocurrency portfolio management. Frontiers in Artificial Intelligence, 3, 22. https://doi.org/10.3389/frai.2020.00022
- Giudici, P., & Polinesi, G. (2021). Crypto price discovery through correlation networks. Annals of Operations Research, 299(1–2), 443–457. https://doi.org/10.1007/s10479-019-03282-3
- Goodell, J. W. (2020). COVID-19 and finance: Agendas for future research. Finance Research Letters, 35, 101512. https://doi.org/10.1016/j.frl.2020.101512
- Gunay, S. (2020), A new form of financial contagion: COVID-19 and stock market responses, Working paper.
- Harjoto, M. A., Rossi, F., Lee, R., & Sergi, B. S. (2020). How do equity markets react to COVID-19? Evidence from emerging and developed countries. Journal of Economics and Business, 105966, 105966. https://doi.org/10.1016/j.jeconbus.2020.105966
- Hoseli, M., & Reka, K. Contagion channels between real estate and financial markets. (2015). Real Estate Economics, 43(1), 101–138. 2015. https://doi.org/10.1111/1540-6229.12070
- Jayech, S. (2016) The contagion channels of July–August-2011 stock market crash: A DAG-copula based approach. Working paper.
- Jokipii, T., & Lucey, B. M. (2006), Contagion and Interdependence: Measuring CEE banking sector co-movements. Working paper.
- Kenourgios, D., Dimitriou, D., & Samitas, A. (2018). Global crises and contagion: Does the capitalization size matter? Applied Economics Quarterly, 64(1), 39–57. https://doi.org/10.3790/aeq.64.1.39
- Kenourgios, D., Samitas, A., & Paltalidis, A. (2011). Financial crises and stock market contagion in a multivariate time-varying asymmetric framework. Journal of International Financial Markets, Institutions and Money, 21(1), 92–106. https://doi.org/10.1016/j.intfin.2010.08.005
- Khalfaoui, R., Nammouri, H., Labidi, O., & Ben Jabeur, S. (2021). Is the COVID-19 vaccine effective on the US financial market ? Public Health, 198, 177–179. https://doi.org/10.1016/j.puhe.2021.07.026
- King, M. R. (2010). Who triggered the Asian financial crisis. Review of International Political Economy, 8(3), 438–466. https://doi.org/10.1080/09692290110055830
- King, M., & Wadhwani, S. (1990). Transmission of volatility between stock markets. The Review of Financial Studies, 3(1), 5–33. https://doi.org/10.1093/rfs/3.1.5
- Matos, P., Costa, A., & da Silva, C. (2021). COVID-19. stock market and sectoral contagion in US: A time-frequency analysis. Research in International Business and Finance, 57, 101400. https://doi.org/10.1016/j.ribaf.2021.101400
- Nie, C. -X. (2022). Analysis of critical events in the correlation dynamics of cryptocurrency market. Physica A Statistical Mechanics & Its Applications, 586, 126462. https://doi.org/10.1016/j.physa.2021.126462
- Nitoi, M., & Pochea, M. M. (2020). Time-varying dependence in European equity markets: A contagion and investor sentiment driven analysis. Economic Modelling, 86, 133–147. https://doi.org/10.1016/j.econmod.2019.06.007
- Okorie, D. I., & Lin, B. (2021). Stock markets and the COVID-19 fractal contagion effects. Finance Research Letters, 38, 101640. https://doi.org/10.1016/j.frl.2020.101640
- Patton, A. J. (2006). Modelling asymmetric exchange rate dependence. International Economic Review, 47(2), 527–556. https://doi.org/10.1111/j.1468-2354.2006.00387.x
- Pechham, R. (2013). Economies of contagion: Financial crisis and pandemic. Economy and Society, 42(2), 226–248. https://doi.org/10.1080/03085147.2012.718626
- Petmezas, D., & Santamaria, D. (2014). Investor induced contagion during the Banking and European sovereign debt crisis of 2007-2012: Wealth effect or portfolio rebalancing ? Journal of International Money & Finance, 49, 401–424. https://doi.org/10.1016/j.jimonfin.2014.06.005
- Rodriquez, J. C. (2007). Measuring financial contagion: A copula approach. Journal of Empirical Finance, 14(3), 401–423. https://doi.org/10.1016/j.jempfin.2006.07.002
- Rouatbi, W., Demir, E., Kizys, R., & Zaremba, A. (2021). Immunizing markets against the pandemic: COVID-19 Vaccinations and stock volatility around the world. International Review of Financial Analysis, 77, 101819. https://doi.org/10.1016/j.irfa.2021.101819
- Spelta, P., & Flori, G. (2021). The impact of the SARS-Cov-2 pandemic on financial markets: A seismologic approach. Annals of Operations Research. https://doi.org/10.1007/s10479-021-04115-y
- Takyi, P. O., & Bentum-Ennin, I. (2021). The impact of COVID-19 on stock market performance in Africa: A Bayesian structural time series approach. Journal of Economics and Business, 115, 105968. https://doi.org/10.1016/j.jeconbus.2020.105968
- Topcu, M., & Gulal, O. S. (2020). The impact of COVID-19 on emerging stock markets. Finance Research Letters, 36, 101691. https://doi.org/10.1016/j.frl.2020.101691
- Tsakalos, I., Samitas, A., & Kinias, I. (2015). Volatility spillovers between energy market and international financial markets. Investment Management & Financial Innovations, 12(2), 136–149. (contin.).
- Uddin, G. Z., Yahya, M., Goswami, G. G., Lucey, B., & Ahmed, A. (2022). Stock market contagion during the COVID-19 pandemic in emerging economies. International Review of Economics & Finance, 79, 302–309. https://doi.org/10.1016/j.iref.2022.02.028
- Wang, H., Yuan, Y., Li, Y., & Wang, X. (2021). Financial contagion and contagion channels in the forex market: A new approach via the dynamic mixture copula-extreme value theory. Economic Modelling, 94, 401–414. https://doi.org/10.1016/j.econmod.2020.10.002
- Yarovaya, L., Brzeszczynski, J., Goodell, J. W., Lucey, B., & Lau, C. K. M. (2020), Rethinking financial contagion: Information transmission mechanism during the COVID-19 pandemic, Working paper.
- Zaremba, A., Kizys, R., Aharond, D. Y., & Demir, E. (2020). Infected markets: Novel Coronavirus. government interventions and stock return volatility around the globe. Finance Research Letters, 35, 101597. https://doi.org/10.1016/j.frl.2020.101597
- Zhang, G., & Liu, W. (2018). Analysis of international propagation of contagion between oil and stock markets. Energy, 165, 469–486. https://doi.org/10.1016/j.energy.2018.09.024