
 ?Mathematical formulae have been encoded as MathML and are displayed in this HTML version using MathJax in order to improve their display. Uncheck the box to turn MathJax off. This feature requires Javascript. Click on a formula to zoom.
Abstract
Forests are admitted as a home for many inestimable goods and services that have an economic value for people living around. However, now a day, due to unsustainable utilization, different destructive human activities and natural phenomena’s, most forest resources and their benefits become highly deteriorated from time to time. Hence, this study aimed in estimating households’ willingness to pay for the intervention of forest restoration is found to be a vital step for priority setting in its sustainable management. For doing so, data’s were collected from 226 randomly selected households of Haramaya district, Oromia National Regional State, Ethiopia. For analyzing the collected data, descriptive statistics, inferential statistics and econometric models such as, bivariate probit and seemingly unrelated bivariate probit models were used. The result from 221 valid responses showed that 196 (88.69%) households were willing to contribute for the restoration whereas the remaining 25 (11.31%) households were not. This asserts that the proposed intervention was highly accepted by the majority of the sampled households hence they are more willing to sustain it. Following the seemingly unrelated bivariate probit parameter estimate, the mean WTP was about 439 Ethiopian birr per year, per household. Accordingly, by using this mean willingness to pay value, the welfare gain from the intervention (forest restoration and its management) for the study district (Haramaya) was computed to be 23,269,634 Ethiopian birr per year. Moreover, as the bivariate probit model results indicate, the probability of willingness to pay was positively and significantly affected by variables such as, sex, frequency of extension contact, land certificate, livestock holding, and slope of the land whereas, age, off/non-farm income, initial bid value (bid1), size of own land and farm experience affected willingness to pay negatively and significantly. Hence, to improve the participation level of the households, policy makers should target on these variables.
1. Introduction
Forests, like other natural resources, perform a set of functions to meet the needs of people (Cavatassi, Citation2005; Pak, Citation2010). It provides various direct and indirect benefits to human welfare (Chaudhry, Citation2013; Dogru, Citation2001; Wu et al., Citation2010). Some of these benefits include protecting watershed, reducing erosion and removing greenhouse gas from the atmosphere (WWF and IUCN, Citation2001). In addition to this, carbon storage and sequestration has emerged as an important forest ecosystem service (Ontl et al., Citation2020). Moreover, planted forests help to restore native biodiversity and improve soil quality (Abegaz et al., Citation2020; Indufor, Citation2016). This, in turn, broadly reduces soil degradation and siltation in dams, thereby contributing to the sustainability of power generation, efforts in climate change adaptation and mitigation (MEFCC, Citation2016). Despite to those crucial importance of forests in livelihood and environmental aspects/climate regulation, forest resources all over the globe are subjected to enormous pressure resulting in deforestation and degradation due to the increment in human and cattle population, widespread rural poverty and other natural phenomena (Keenan et al., Citation2015).
For instance, globally about 13 million ha of forests were converted to other uses (like, agriculture and infrastructural construction) or disappeared as a result of natural phenomena each year during the past decade (Keenan et al., Citation2015). This depletion of forests has many ecological, social and economic consequences, including the extinction of biotic communities leading to reduction in biodiversity, soil erosion, global warming and loss of income (Chakravarty et al., Citation2012). Moreover, more intense harvesting tends to cause greater soil disturbance and variation in soil carbon response among different harvesting strategies (Binkley & Fisher, Citation2019; Hume et al., Citation2018; James & Harrison, Citation2016; Mayer et al., Citation2020; Nave et al., Citation2019). For instance, clear-cutting/harvesting generally results in reduction of soil carbon stocks, particularly if whole-tree harvesting and/or stump harvesting is practiced (Mayer et al., Citation2020). Furthermore, due to deforestation, attenuation and degradation of forest, households have been faced land productivity problems, flood, drastic reduction in income and shortage of water thereby it makes the society being food insecure and inflicted by hunger (Badea & Apostol, Citation2020), which was true in the study area as well. Hence, the management, utilization, and innovation of forest resources should incorporate the broader aspects of human wellbeing in order to achieve the global sustainable development goals (Badea & Apostol, Citation2020; MEFCC, Citation2016; Rawat, Citation2017).
As a data on forest resources shows, Ethiopian forest cover is about 12.2 million hectare. It is further indicated that the forest cover shows a decline from 15.11 million ha in 1990 to 12.2 million ha in 2010, during which 2.65% of the forest cover was deforested (Keenan et al., Citation2015). This shows that the country is characterized by high rate of deforestation. As a loophole for this, the country started following a Climate Resilient Green Economy (CRGE) growth path about a decade ago with a vision to achieve middle-income status by the year 2025 (Federal Democratic Republic of Ethiopia (Federal Democratic Republic of Ethiopia FDRE, Citation2012). The strategy has been mostly focused at the main sector, which is forest, since it is the bases and crucial for the other remaining sectors to be meet. This CRGE growth path has been managing forests through forest conservation and restoration practices as tools for climate change mitigation and rural economic development in a sustainable landscape approach (MEFCC, Citation2016, Citation2018a, Citation2018b). Currently, there is a high demand for both productive use and environmental services of forest resources in the country (Kelbessa & Girma, Citation2011; MEFCC, Citation2017). Hence, there is a need to give more focus for forest restoration in Ethiopia in general and in the study area in particular to mitigate social, economic and environmental issues by creating significant job opportunities through the improved agricultural and industrial production, in addition to the other remaining ecosystem services (Hansen, Citation2016). In this vein, the forest sector has the potential to nationally contribute to the fulfilment of about a third of the seventeen sustainable development goals (SDGs) toward which Ethiopia is committed (FDRE, Citation2017).
As being one of the poorest countries in the world, the country’ economy is heavily dependent on agriculture (Baye, Citation2017) and the natural resources for subsistence (Nune et al., Citation2013; Zegeye, Citation2018). However, agriculture is known to be a resource-intensive enterprise (Cassman et al., Citation2003). This indicates that, securing food and livelihood is inseparably linked to the exploitation of natural resources (Baye, Citation2017; Nigussie et al., Citation2018). Hence, agricultural extensification to produce more food for the rapidly growing population is causing unprecedented changes in the near-natural resources like forest, land, water, grassland, and wildlife (Tolessa et al., Citation2020). This is an indicator for the need to give more focus and emphasis for agroforestry practice, in addition to reforestation. Consequently, to use the available natural resources optimally and achieve sustainability, it is quite essential to have the information on existing resource use problems, management trends, and its sustainability issues (Ketema et al., Citation2020). This indicates the need for a new investigation, which assesses the sustainability of forest restoration practice through natural resource valuation studies.
Moreover, several studies have been carried out at the country level to estimate forest cover change, its drivers and possible solutions (Alemu et al., Citation2012; Dessie & Kleman, Citation2007; Gebrehiwot et al., Citation2014; Gessesse, Citation2007; Gifawesen et al., Citation2020; Solomon et al., Citation2018). In addition, while the participatory management approach is said to be in place in Ethiopia in general and in the study area in particular, research’s on estimating the values (in monetary terms) that the local communities attach to the forest resource and their willingness to pay for forest restoration practices for the sustainability of forest resource in Ethiopia (in general) were scanty and even it was completely missed in the study area. It is argued that without incorporating these non-market values into the decision-making process, policy decisions regarding environmental/forest restoration may be made that are not in fact in the best interest of society thereby the restoration practice might not be sustainable (Hynes et al., Citation2021; Toledo‐gallegos et al., Citation2021). This is because, the effectiveness and sustainability of any conservation/management/restoration intervention requires the full participation and willingness of local communities for the fact that they are the immediate victims of the negative effects caused by environmental/forest degradation. Hence, lack of valuation study (Absence of willingness research that can be used to mobilize those willing households for sustainable restoration of the forest in the study area) can be regarded as one of the gaps. Therefore, this study is needed to fill all the stated gaps by knowing the value that the households attach for forest resources thereby to mobilize those willing households to sustainably manage the environment. Specifically, in order to realize the successes and sustainability of forest restoration practices undergoing in the study area (project site), analyzing households’ willingness to pay for such practices and assessing the values attached to the resource (forest) is an essential process to fill the existing gaps. In doing so, appropriate natural resource conservation and management options can be held and practiced in the study area, and sustainable resource conservation/management plans can easily be framed after the restoration of degraded resource.
2. Research methodology
2.1. Brief description of the study area
Haramaya (Oromo: Aanaa Haroomaayaa) is a district in Oromia National Regional State of Ethiopia (Figue ). It is named Haramaya and is bordered to the south by Kurfa Chele district, to the west by Kersa District, to the north by Dire Dawa Administration, to the east by Kombolcha district, and to the southeast by the Harari Region State. The altitude of this district ranges from 1400 to 2340 meters above sea level; the highest points include Dof and Jeldo. A survey of the land in Haramaya shows that 36.1% is arable or cultivable, 2.3% pasture, 1.5% forest, and the remaining 60.1% is considered built-up, degraded or otherwise unusable. Haramaya district is one of the major producers of vegetables for Djibouti.
Figure 1. Map of the study area.
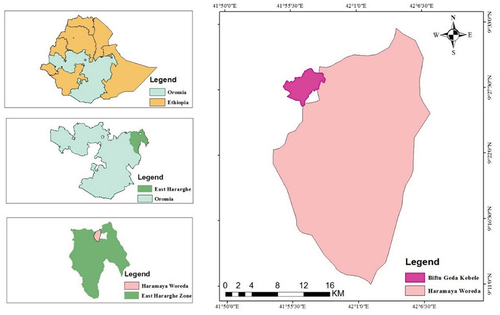
Based on the projection of (Cencus Citation2007), the total population of Haramaya district was about 271,018, of whom 138,282 were men and 132,736 were women; 50032 or 18.46% of its population were urban dwellers. This district have on average five persons to a household. The average rural households’ land holding of Eastern Hararghe Zone is about 0.5 hectare which is small compared to the national average of 1.01 hectare of land and regional average of 1.14 (World Bank, Citation2006). Moreover, 13% of the population are in off-farm related activities.
The reason why Haramaya district is selected over the other districts is that due to the existence of severe land degradation because of natural resource or forest degradation. Further, households of the district were more irritated by the problem of land degradation, severe drought and loss of natural beauty of the area. Hence, households were reported the problem for the regional and national government as well to get a solution together with their uninterrupted contribution. Therefore, the study selected this district for undertaking willingness to pay study for the restoration of natural resource of the area which is forest.
2.2. Types, sources and methods of data collection
Both primary and secondary data sources were employed for the study. The primary data was obtained through questionnaire interview, while the secondary data was collected from published and unpublished documents. Due to the nature of the study, more emphasis was given for primary data sources.
Regarding the qualitative components of the study, Lincoln et al. (Citation2011) argued that qualitative research did not seek to generalize to the broader population but rather allow for a deeper understanding of particular issues of interest. As such, for the qualitative component of this study, representative samples were not sought but rather eight Focus Group Discussion (FGD) participants (who did not take part in the survey) were held in the study kebele.Footnote1 In addition to the FGDs, the researcher was also conducted semi-structured Key Informant Interviews (KII) with selected members of the communities, kebele leaders, development agents, and district officials from the administration and different sectors based on their positions of influence and the information they hold within the study district/kebele (again, eight key informants in total).
Regarding the quantitative data, questionnaires were prepared and then it was distributed to the respondent. Due to its superior merit for the efficiency and better result over other contingent valuation elicitation methods, double-bounded dichotomous choice format (DBDCF) question was used to elicit respondents’ WTP for forest restoration practices in this study. The elicitation was undertaken using the following procedures. First, the hypothetical scenario was developed and provided to the respondents. A hypothetical scenario refers to the practice of telling respondents about the existing state of the amenity (forest degradation), its degradation level along with agricultural productivity trends of the household in the study area, and the current and future impact of such forest degradation if an appropriate measure is not undertaken to restore the resource (forest). In the scenario, the need of initial investment was also clearly described.
Hypothetical bias is the inherent characteristics of CVM and known by its hypothetical nature. If respondents are not familiar with the situation presented, their response cannot be taken as their real WTP. This type of bias arises when respondents report a higher WTP than what they actually willing to pay. There are two sources of hypothetical bias: First, when the respondents do not understand the characteristics of the good being valued and difficult to perceive the hypothetical change in quantity or quality of that good or service. Second, individuals may not take contingent valuation questions seriously and respond carelessly without critical consideration of their budget and preference. Such type of bias can be avoided by using randomly distributed bids that do not systematically related to household characteristics and other factors.
Finally, their willingness to pay using double-bounded dichotomous choice format (DBDCF) and other supplementary questions affecting their willingness to pay was asked accordingly. Before the main survey, a pilot survey was conducted to determine the starting bids and to select the payment vehicles on behalf of the dichotomous-choice valuation question for the intervention, which is forest restoration.
2.3. Sampling procedure and sample size determination
The study employed multi stage sampling techniques. In the first stage, Haramaya district was purposively selected due to the presence of Dengego Model Tree-Based Restoration site, degradation of forest resource, low agricultural productivity, which resulted in increased soil erosion, flood and drought, which then makes the society inflicted by hunger and food insecurity. Then after Biftu Geda Kebele was selected with the same reason as district selection. Finally, 226 households were selected using simple random sampling technique. The sampling list was cast off from kebele administration. The sample size was actually determined by the rule of thumb method, which assumes that, every explanatory variable in the model should have at least 10 sample respondents.
2.4. Methods of data analysis
2.4.1. Descriptive and inferential statistics
Descriptive statistics such as mean, percentage, and standard deviation were used to show different demographic, socio-economic and institutional characteristics. Moreover, t-test and chi-square test were employed to show the effect of the hypothesized explanatory variables on the willingness to pay. While doing this, t-test was used to check the existence of mean difference between continuous/discrete independent variables across willing and unwilling households. On the other hand, chi-square test was employed to illustrate the association between dummy/categorical explanatory variables and the dependent variables.
2.4.2. Estimation of the mean willingness to pay
In this study, the seemingly unrelated bivariate probit model was used to estimate the parametric mean willingness to pay (MWTP) of farmers for forest restoration. The bivariate probit CVM solves distortion, which is introduced from the follow up questions of the double-bounded contingent valuation survey. Following Yu and Abler (Citation2010), if the indirect utility function for a respondent is given by, given labor/cash endowment of the household
, forest cover of the study area
and an exogenous price vectors
. If the respondent decides not to protest and participate in bidding, and s/he is willing to contribute some labor
for forest restoration
, the indirect utility function can be represented by
. Under the market equilibrium, the indirect utility function becomes:
Suppose, the level of forest restoration and labor changes are very small, and we can take the first order approximation of
By Combining equation (1) and (2), we will have
The mathematical estimation of the seemingly unrelated bivariate probit model is presented below. Let t1 be the first bid price and t2 be the second. In general, there are four possible outcomes: both answers ‟yes”; both answers ‟no”; ‟yes” followed by a ‟no”; and ‟no” followed by a ‟yes”. According to Haab and McConnell (Citation2002), the bounds on WTP are:
The most general econometric model for the double—bounded data comes from the formulation below.
where represents the ith respondent’s willingness to pay, and j = 1, 2 represents the first and second response.
and
are the means for the first and second responses.
Finally, the mean willingness to pay (MWTP) from seemingly unrelated bivariate probit model can be calculated using the double bounded parameter estimation formula specified by Haab and McConnell (Citation2002):
where - is a coefficient for the constant term,
- is a coefficient of the bids offered to the respondent.
2.4.3. Identifying factors affecting willingness to pay
Here, the objective was to quantify the relationship between the individual characteristics and the probability of households’ WTP for a randomly offered initial bid values. For a given specified amount of contribution that has to be subtracted from a given households’ cash/labor endowment for forest restoration, households have the choice either to accept the pre specified bid or not for the dichotomous choice question of the CVM survey. The decision process of the households can be modeled in a simple utility framework following Hanemann (Citation1984). Let the utility or satisfaction of a given rural household is given by:
where is the utility of the household i, L is total labor/cash endowment of the household in a year, Z are demographic, socio-economic and institutional characteristics of the household, whereas q is the current forest cover. Furthermore, let us assume that there are two states of the world corresponding to different levels of forest cover: q* as the level of forest cover after the restoration measures are undertaken and q as the level of forest cover before the restoration practices (before the intervention) are undertaken or if the restoration practices are not pursued.
The focus in this model is on the factors that determine the probability of accepting the initial bid. The ith farm household will be willing to accept the initial bid when . Therefore, the choice problem can be modeled as binary response variable Y, where;
The probability that a given household is willing to pay/contribute for forest restoration is given by:
By substitution:
By rearranging, we get:
and
, we have:
where, F is the cumulative distribution function. This provides an underlying structural model for estimating the probability and it can be estimated either using a probit or logit model, depending on the assumption on the distribution of the error term () and computational convenience. Consequently, this study employed bivariate probit model by introducing the independent variables that were hypothesized as an influencing factor in addition to the bid variable.
where and
are the ith households’ WTP for forest restoration practices when s/he respond for the initial and subsequent WTP questions, respectively; t1 and t2 are the initial and second bid, respectively;
and
are unknown parameters to be estimated;
and
are unobservable random components distributed N (0, σ) and
refers to the independent variables. Generally, the independent variables (
) are the same in the two equations above.
3. Results and discussion
Separation of those genuine and protest zero responses from those respondents who elicited zero to the maximum willingness to pay were held before undertaking any analysis. Subsequently, five respondents who were elicited zero to the maximum WTP were found and all of those observations were protest response. Consequently, these 5 protest responses were removed from the dataset to get an unbiased and consistent estimation. Following this, by using those remaining valid (221) responses, 196 (88.69%) of the households were found to be willing to contribute in favor of sustaining the intervention whereas, 25 (11.31%) of the households were found to be non-willing due to various reasons. In this regard, households’ willingness to contribute for the intervention was found to be a function of many demographic, socio-economic and institutional factors as it is discussed below.
3.1. Descriptive statistics for continuous and discrete variables
As indicated in Table , on average, the 221 sampled households made 2.16 times contact per year with extension agents generally on natural resource conservation and specifically on forest. On average, the willing households made more contact with development agents (2.37 times per year) compared to the non-willing participants who made about 0.48 times per year on average. There was a statistically significant mean difference in the frequency of extension contact between willing and non-willing respondents at 1% probability level.
Table 1. Descriptive statistics for continuous and discrete independent variables
Based on standard conversion factors, the number of families of the household head was converted into adult equivalent. Accordingly, as indicated in Table , the mean family size for the 196 willing and 25 non-willing households were about 3.63 and 7.24, respectively. Meanwhile, the mean family size for the entire 221 sampled households was about 4.04 and this mean difference was statistically significant at 1% probability level. This shows that having more number of families is positively related with willingness to pay for forest restoration.
Bid value was also included in the analysis with the expectation that those farmers who were provided and asked higher bid value will become non-willing to pay for forest restoration than those household heads who were provided with less bid value. Consequently, the t-test result shows that there was a significant mean difference between willing and non-willing households with regard to bid values provided to them at 1% probability level (Table ). Furthermore, for the willing and non-willing households, the average bid value provided to them was about 158.47 and 444.4 ETB, respectively.
Agricultural activities were one of the main income sources for the sampled households. As depicted in Table , the mean annual income from agricultural sources for the willing and non-willing respondents was about 22,092 and 7116 ETB, respectively. Furthermore, the mean gross annual income for the total sampled households was about 20,398 ETB. Based on the t-test result, the mean average income between willing and non-willing farmers was significant at 1% probability level indicating agricultural income increases willingness to pay for making forest restoration measure sustainable.
The mean gross annual income from non-farm activities for the total sampled households was about 8793.2 ETB. When this mean non-farm income of the respondent is apportioned, the mean gross annual income for the willing and non-willing respondents was about 4905.36 and 39,274 ETB, respectively. As the t-test result indicated, the mean average non-farm income between willing and non-willing households was significant at 1% probability level indicating non-farm income can boost willingness to pay of the household head for forest restoration.
The exceptional result of this study was the existence of significant mean difference in farm experience between willing and non-willing households. What makes it unique is that willing households have lesser farm experience (24.81) compared to the non-willing households (36.72). The value of t-test in the table below reveals that there was a significant relationship between the mean farm experience difference and the willingness to pay status of households’ for forest restoration measure at 5% probability level.
3.2. Descriptive statistics for dummy independent variables
From the total 196 (88.69%) willing households, 161 (82.14%) have land certificates whereas the reaming 35 (17.86%) were not. In addition, from the total 25 non-willing households, 17 (68%) have land certificate but the reaming 8 (32%) were not. Among the entire 234 sampled households, 178 (80.54%) have land certificate whereas the remaining 43 (19.46%) were not. The Pearson chi-square results in Table below shows that there is statistically significant mean difference between willing and non-willing households in terms of their land certificate status.
Table 2. Descriptive statistics for dummy independent variables
When a farmer is aware in afforestation and believe that deforestation and/or degradation of forest having a threat on his/her livelihood, he/she may be willing to contribute for the forest restoration programs more importantly than their counterparts may. Out of the entire 221 sampled households, 33 (14.93%) does not have an awareness in afforestation/forest restoration; whereas the remaining 188 (85.07%) does. Moreover, among the 196 willing households, 163 (83.16%) have an awareness in afforestation; whereas the remaining 33 (16.87%) did not have such an awareness (Table ). Surprisingly, all of those non-willing (25) households have an awareness in afforestation. The willingness of those non-aware (33) respondents showed that they are not aware in afforestation in the past and do not observe the current forest degradation associated problems rather they are taking a pre-action against the occurrence of future inflictions to maintain the bequest value of forest for the posterity. The chi-square result in Table shows that there is a statistically significant relationship between willingness to pay status and awareness in afforestation at 5% probability level.
3.3. Contingent valuation result
3.3.1. Patterns of response for the two offered bids
The response patterns in the double-bounded dichotomous choice elicitation method of CV fluctuates in between the two verges of “Yes-Yes” and “No-No” response. As Table depicts, majority 126 (57.01%) of the sampled households accepted both the offered bids, whereas, 55 (24.89%) of them accepted the first bid offered but not the second. In between these two extremes, 11.31% and 6.79% of the responses were “No -No” and “No-Yes” response, respectively. Such a high level of acceptance of both the offered bids (57.01 %) signifies that most of the sampled households are more willing to contribute for the intervention even if the bid value is doubled.
Table 3. Patterns of response for the two offered bids
3.3.2. Reasons for accepting the offered bids
The households’ decision for accepting or rejecting WTP questions are contingent on many demographic, socio-economic and institutional factors. Relating to these factors, households might be more willing to contribute for the intervention (forest restoration and its management) to make it sustainable due to different core reasons as presented below (Table ). Out of 221 valid responses, 196 (88.69% of the sampled households were willing to contribute in favor of sustaining the intervention (forest restoration and its management). These willing households had different motivations to contribute for the program and most of them 62 (28.05%) were motivated to contribute since the change to be made is beneficial for them and their families, which was followed by those willing households who want to see the resource at its former beauty and those willing households who want to bequeath such resource for future generation which constitutes 23.08% and 20.82%, respectively.
Table 4. Reasons for accepting the offered bids
3.3.3. Reasons for rejecting the offered bids and zero elicitation
In addition to demographic, socio-economic and institutional factors, households also might be non-willing to contribute for the intervention (forest restoration) to make it sustainable either from their protest or genuine behavior. As it is depicted in Table below, the only reasons for not contributing any amount which were reported by 100% of the zero elicited/non-willing respondents was due to the reason that they thinks others should pay/contribute for it, which is a protest against sustaining the intervention that is under implementation in the study area. Those responses are considered as protest response according to the discussion of national oceanic and atmospheric administration (NOAA) guidelines (Arrow et al., Citation1993) and hence, they should have to be discarded and excluded from further analysis. This is because, in the CV literature, reasons other than financial constraint and the intervention to be undertaken having no value to the respondent are considered as protest responses (Labao et al., Citation2008).
Table 5. Reasons for rejecting the offered bids and zero elicitation
3.3.4. Estimation of mean willingness to pay
Following seemingly unrelated bivariate probit model, the estimation of mean willingness to pay from the double bounded dichotomous choice format of the bivariate probit was computed using the parameter estimates ensuing the formula developed by Haab and McConnell (Citation2002), as specified in the methodological section of chapter three, which is described as:
Based on this premise, the mean willingness to pay for the intervention (forest restoration and its management) was found to be 439 ETB per year per household (Table ). This was the average value of the parameter estimates of both the initial and follow up responses of the two simultaneously modeled seemingly unrelated bivariate regression models. Generally, the result in Table shows that, mean WTP for forest restoration was relatively much higher than earlier studies mean WTP which was done on WTP for environmental or natural resource management (e.g., Asmamaw et al., Citation2017; Seifu et al., Citation2017Federal Democratic Republic of Ethiopia (FDRE), Citation2012; Tilahun et al. 201; Getachew (Citation2018); Abebe et al. (Citation2019); Ayenew et al. (Citation2019); Endalew et al. (Citation2019); Bamwesigye et al. (Citation2020). The mean willingness to pay value computed in these studies ranges in between 39.07 ETB and 400 ETB whereas, the mean WTP of the current study was 439 ETB. This asserts that the intervention (forest restoration program and its management) was highly accepted by the majority of the sampled households and hence, they were more willing to contribute for it. The main motives for being more willing to pay (for having such attractive contribution) to sustain the intervention were to restore former beauty of the area, to enhance sustainable benefits from its ecosystem services after the intervention and to bequeath such resource for future generation.
Table 6. Seemingly unrelated bivariate probit parameter estimates
3.4. Determinant factors
After assessing the level of households’ willingness to contribute for sustaining the intervention and determining the presence of differences among households in their level of contribution, finding out factors causing this disparity among households was the next most important step of this study. To see this, WTP of sample respondents were regressed on factors that were expected to affect the level of their contribution using bivariate probit estimation procedure as presented below (Table ).
Table 7. Determinants of households’ WTP for forest restoration
3.4.1. Sex of the household head (SexHH)
As hypothesized, sex of the respondent is found to have a positive effect and it is statistically significant at 5% probability level for the second bid equation. The marginal effect result revealed that, keeping other factors constant at their mean values, being male would increase the probability of willing to pay for forest restoration by 69.1%. This indicates male household heads are more likely to accept the offered bid than their female counterparts. The result is not surprising as female-headed households have fewer resources possession endowment, which is necessary for the restoration and conservation activities than male-headed households. Moreover, even to contribute in labor, women’s in rural areas are mostly busy in internal/household activities and their prime responsibility is usually child rearing so that they might not have extra time to be contributed for forest restoration. In addition, since forest restoration is challenging practice for female households because the practice requires digging the soil in which females are unfamiliar particularly in the study area, they become non-willing. As well, female-headed households are prone to some cultural constraints than male-headed households. Due to these reasons, male-headed households would be more willing to contribute for forest restoration. The result of this study is found to be in line with some previous researchers result who tried to examine the effect of sex on willingness to pay for natural resource management (Almansa et al., Citation2012; Bogale & Urgessa, Citation2012; G. Belay et al., Citation2020; Gebremariam, Citation2012; Negewo et al., Citation2016).
3.4.2. Size of own land (SLand)
The role of having own land on households’ willingness to pay has been documented in many willingness to pay studies, which have been done on natural resource management. Instead of a dummy variable that represents whether the farmer or household has his own land or not, the current study considered the amount of land owned by the household in hectare. As opposed to prior expectation, the variable have shown to have a negative influence and found to have a significant impact on the households’ willingness to pay at 1% probability level for the second equation. As the marginal effect result indicates, having one more hectare of own land decreases the probability of households’ willingness to pay for forest restoration practices by 25.27%. The associated justification for this is that, in the study area land were not owned by a particular individual in excess amount at one area. Therefore, what the households do is that, they own a land in another area either out of the kebele they live in or with in the same kebele but not at a nearest distance. Hence, households have more land means that they have land in different areas. Due to this, those households who have more land do not give care for forest restoration to mitigate the associated problems of forest degradation thereby they will not contribute for forest restoration measure rather they shift their production/farming from the study area (which is prone to erosion) due to nature of the land (which is mostly steep) and severe forest degradation) to the other area.
3.4.3. Livestock holding (TLU)
Asset endowments such as livestock holding were also included in the analysis. As the marginal effect result for this variable indicated, the probability of WTP increases by 5.84% for a unit increase in livestock ownership in tropical livestock unit (TLU) and this was happened to be significant at 5% probability level for the second response. Therefore, having a large number of livestock can strengthen and initiate farmers’ capacity to contribute for forest restoration measures in the study area. The possible justification could be, those with large number of livestock are constrained too by the degradation of the grazing land used for their livestock hence they becomes more willing. This study is consistent with previous studies by Gebremariam (Citation2012), Bamlaku and Yirdaw (Citation2015), Amare et al. (Citation2017), Tilahun et al. (Citation2017) and G. Belay et al. (Citation2020).
3.4.4. Initial bid value (bid1)
As the bivariate probit model results indicate, the coefficient of initial bid was negative as expected and statistically significant at 1% probability level for both the first and second follow up response. This implies, the probability of a “yes” response to the initial and follow up contribution amount increases with decrease in the initial bid offered which indicates that the likelihood of accepting an offered bid increases as the bid amount goes down and vice versa, which is consistent with the economic theory (the law of demand). The marginal effect results shows that, as the discrete values of initial bid increases by one unit the probability of being willing to pay for forest restoration decreases by 0.22%. The result is in conformity with the results of the studies done by Ayana (Citation2017), Seifu et al. (Citation2017), Vo and Huynh (Citation2017), Getachew (Citation2018), Ayenew et al. (Citation2019) and G. Belay et al. (Citation2020).
3.4.5. Land Certificate (LandCert)
Holding other factors constant, having land certificate or indirectly having secured land increases the probability of households’ WTP by 51.75% compared to those who do not have land certificate at 1% probability level for both response. Hence, those households who have land certificate or those who think that the land they owned is secured tend to contribute more for forest restoration than their counterparts. This is because having land certificate creates trust among the household and the government for future possession of their land. As a result, having land certificate is found to be positively associated with a higher level of contribution to the intervention (forest restoration and its management). This shows that households who have land certificate for the land they owned feels more responsible and accountable thereby accept the yearly offered cash contribution to minimize the problems associated with forest degradation in a sustainable manner. This study is also consistent with the hypothesis and previous but not recent studies of Gebremedhin and Swinton (Citation2003) and Gebremariam (Citation2012).
3.4.6. Frequency of extension contact (FreExt)
Extension visit, which is the primary source of information related to natural resource management found to have a positive and significant effect on the WTP for forest restoration. Therefore, an increase in extension contact by one more visit increases the probability of households’ WTP by 2.73% and it was happened to be significant at 10% and 5% probability level for the first and second response, respectively, citrus paribus. The possible reason is that, having more extension contact is always associated with enhancement in households’ awareness regarding degradation of forest, its consequence and importance of forest restoration. Hence, frequent extension visits about natural resource in general, and forest restoration and management in particular could aspire households to contribute for the intervention (forest restoration). In line with this finding, Biratu and Asmamaw (Citation2016), Amare et al. (Citation2016), K. Belay (Citation2017), and Workie (Citation2017) also emphasized that extension contact enhances households’ awareness to manage natural resources, which can indirectly affect their WTP positively.
3.4.7. Slope of the land (Slope)
Slope of respondents’ land was also hypothesized and included in the analysis by expecting it to affect willingness to pay positively. As the model result reveals, holding other factors constant, having steep land increases the probability of households’ WTP by 8.84% and this was happened to be significant at 5% probability level for the first response. Hence, households who have steep land tends to pay more for forest restoration and its management than their counterparts. This is because of the fact that those household heads who have steep land will face with more inflictions of forest degradation-related problems thereby they will perceive importance of forest restoration and the need for sustainable management of it. This enables them to be more willing to contribute for the restoration of the resource to which willingness to pay of households is investigated. Hence, having steep land enhances the status of being willing to contribute for sustaining the intervention as compared to those household heads who have no steep land. This finding is consistent with the findings of Bekele & Lars (Citation2003); Bett, Citation2004; K. Belay (Citation2017).
3.4.8. Non-farm income of the household (NFI)
Nonfarm income is found to affect WTP amount negatively and significantly. Holding other factors constant, as the annual non-farm income of the household increase by 1 unit, then the probability that the household could pay will decrease by 9.89e−06 % and this was happened to be significant at 1 and 10% probability level for the first and second response, respectively. This shows that, having more non-farm income might solve the financial constraint that the respondent household encounter to pay for sustaining the intervention but unfortunately, it does not encourage and make them to contribute for the restoration measure. In line with this study, Biratu and Asmamaw (Citation2016), Nyongesa et al. (Citation2016), Asmamaw et al. (Citation2017) and G. Belay et al. (Citation2020) confirmed that an increase in nonfarm income could decrease households dependence on agricultural activities and values derived from the their land resource. According to these studies, such decrease in reliance on the land for farming affects households WTP negatively.
3.5. Welfare gains from forest restoration and its management for the study area
Usually, CV analyses calculates the aggregate WTP by multiplying either the mean or median WTP by the total number of households in the population expected to have valid responses. However, aggregation using mean WTP gives the social benefits of the offered improvement and is consistent with cost-benefit analysis (Arouna & Dabbert, Citation2012); hence, aggregation-using mean WTP was chosen. As it is depicted in Table , after excluding the protest response, there were about 735 and 53,006 households who are expected to contribute for sustaining the intervention in Biftu Geda Kebele and Haramaya district, respectively.
Table 8. Aggregate WTP of Biftu Geda Kebele and Haramaya district
To obtain the aggregate welfare gain of the study district and kebele as well, the total number of households expected to have valid responses were multiplied with the computed mean WTP of the close-ended CV survey responses (Table ). This analysis was based on the simple transferring point estimate approach (Jin et al., Citation2008). Ensuing this, the aggregate welfare gain for the study area was computed to be 322,665 and 23,269,634 ETB for Biftu Geda Kebele and Haramaya district, respectively.
4. Conclusions and recommendations
Despite to its crucial importance in livelihood and environmental aspects (such as climate regulation), forest resources all over the globe are subjected to enormous pressure resulting in deforestation due to an increase in human and cattle population, widespread rural poverty and other natural phenomena. Nowadays, Dengego forest in Haramaya district encountered with such pressures hence, it is at the edge of degradation due to unsustainable resource utilization. Therefore, this study attempted to determine factors affecting households’ contribution for sustaining the intervention, and estimated households’ willingness to pay for the restoration of Dengego forest and for its management thereby evaluated the welfare gain of the intervention for the study area. The result has shown that the majority (88.69%) of households were willing to contribute for forest restoration and its sustainable management and some (11.31%) households were not willing. The mean WTP from the double bounded dichotomous choice format was found to be 439 ETB per household per year. By using this mean WTP value, the welfare gains of the intervention (forest restoration and its sustainable management) for Biftu Geda Kebele and Haramaya district were found to be 322,665 and 23,269,634 ETB, respectively. Ecosystem valuation is not only important from economic standpoint of view, but also for harmonizing forest development with community preferences. Hence, the study result can serve as a benchmark for future studies and can be replicated in other areas with similar ecosystems.
Ethical approval
We all are agreed to submit the manuscript and are also responsible for its content.
Consent for publication
We all are agreed to publish our manuscript in this journal.
Author informations
Kindineh Sisay holder of MSc Degree in Agricultural and Applied Economics from Haramaya University, Ethiopia and University of Pretoria, South Africa (Partial Scholarship). Dr. Tessema Toru Assistant Professor at Haramaya University, School of Natural Resource Management and Environmental Science.
Author contributions
Kindineh Sisay: Conceived and designed the experiments; Performed the experiments; Analyzed and interpreted the data; Contributed reagents, materials, analysis tools or data; Wrote the paper. Tessema Toru: Conceived and designed the experiments; Analyzed and interpreted the data; Contributed reagents, materials, analysis tools or data; Wrote the paper.
Acknowledgments
The authors gratefully acknowledge the contribution of sampled farmers and data collectors, who made tremendous efforts to make the data collection thereby the research successful.
Disclosure statement
No potential conflict of interest was reported by the authors.
Additional information
Funding
Notes
1. Kebele is the sub division of district, which is the smallest unit of local government in Ethiopia.
2. Related response from some respondents: “Only users of grazing and/or farmland should pay/contribute for it”.
3. Is the expected number of households who are against the intervention; hence, those households have to be excluded from further analysis. Therefore, Y is calculated by multiplying the percent protest with the total households per 100 (i.e., AX/100).
4. Is the total number of households in the study area that are expected to have a valid response (i.e., X-Y).
References
- Abebe, S. T., Dagnew, A. B., Zeleke, V. G., Eshetu, G. Z., & Cirella, G. T. (2019). Willingness to pay for watershed management. Resources, 8(2), 77. https://doi.org/10.3390/resources8020077
- Abegaz, A., Tamene, L., Abera, W., Yaekob, T., Hailu, H., Nyawira, S. S., Sommer, R. … Sommer, R. (2020). Soil organic carbon dynamics along Chrono-sequence land-use systems in the highlands of Ethiopia. Agriculture, Ecosystems and Environment, 300, 106997. https://doi.org/10.1016/j.agee.2020.106997
- Alemu, M., Suryabhagavan, K., & Balakrishnan, M. (2012). Assessment of cover change in the Harenna habitats in Bale Mountains, Ethiopia, using GIS and remote sensing. International Journal of Ecology and Environmental Sciences, 38(1), 39–21.
- Almansa, C., Calatrava, J., & Martínez-Paz, J. M. (2012). Extending the framework of the economic evaluation of erosion control actions in Mediterranean basins. Land Use Policy, 29(2), 294–308. https://doi.org/10.1016/j.landusepol.2011.06.013
- Amare, D., Mekuria, W., & Belay, B. (2017). Willingness and participation of local communities to manage communal grazing lands in the Lake Tana biosphere, Ethiopia. Society & Natural Resources, 30(6), 674–689. https://doi.org/10.1080/08941920.2016.1264649
- Amare, D., Mekuria, W., T/Wold, T., Belay, B., Teshome, A., Yitaferu, B., Tessema, T., & Tegegn, B. (2016). Perception of local community and the willingness to pay to restore church forests: The case of Dera district, northwestern Ethiopia. Forests, Trees and Livelihoods, 25(3), 173–186. https://doi.org/10.1080/14728028.2015.1133330
- Arouna, A., & Dabbert, S. (2012). Estimating rural households’ willingness to pay for water supply improvements: A Benin case study using a semi-nonparametric bivariate probit approach. Water International, 37(3), 293–304. https://doi.org/10.1080/02508060.2012.687507
- Arrow, K., Solow, R., Portney, P. R., Leamer, E. E., Radner, R., & Schuman, H. (1993). Report of the NOAA panel on contingent valuation. Federal Register, 58(10), 4601–4614.
- Asmamaw, B., Beyene, B., Aseged, T., Tessema, M., & Assefa, A. (2017). Beneficiaries’ willingness to pay for the conservation of Meteka wetland in Afar National Regional State, Ethiopia. World Scientific News, 77(2), 326–336.
- Ayana, G. Y. (2017). Farmers’ willingness to pay for soil conservation practices in Gobu Seyo district, Eastern Wollega zone, Oromia national regional state of Ethiopia. International Journal of Agriculture and Environmental Research, 3(3), 2976–2990.
- Ayenew, B., Tilahun, A., Erifo, S., & Tesfaye, P. (2019). Household willingness to pay for improved solid waste management in Shashemene town, Ethiopia. African Journal of Environmental Science and Technology, 13(4), 162–171. https://doi.org/10.5897/AJEST2019.2663
- Badea, O., & Apostol, E. (2020). Forest science innovation for sustainable forest management, improvement of human welfare, and quality of life under global environmental changes. The Science of the Total Environment, 701, 134429. https://doi.org/10.1016/j.scitotenv.2019.134429
- Bamlaku, A., & Yirdaw, M. (2015). Smallholder farmer’s willingness to pay for improved soil and water conservation practice: A contingent valuation study in Abaro-Toga watershed Ethiopia. International Journal of Surface and Groundwater Management, 3(6), 432–441.
- Bamwesigye, D., Hlavackova, P., Sujova, A., Fialova, J., & Kupec, P. (2020). Willingness to pay for forest existence value and sustainability. Sustainability, 12(3), 891. https://doi.org/10.3390/su12030891
- Baye, T. G. (2017). Poverty, peasantry and agriculture in Ethiopia. Annals of Agrarian Science, 15(3), 420–430. https://doi.org/10.1016/j.aasci.2017.04.002
- Bekele, W., & Lars, D. (2003). Soil and water conservation decision of subsistence farmers in the Eastern Highlands of Ethiopia: A case study of the Hunde-Lafto area. Journal of Ecological Economics, 46(3), 437–451. https://doi.org/10.1016/S0921-8009(03)00166-6
- Belay, K. (2017). Farmers’ Willingness to pay for improved soil conservation practices in Kuyu Woreda, North Shoa Zone of Oromia, Ethiopia: Application of contingent valuation method. Singaporean Journal of Business, Economics and Management Studies, 51(5384), 1–10.
- Belay, G., Ketema, M., & Hasen, M. (2020). Households’ willingness to pay for soil conservation on communal lands: Application of the contingent valuation method in northeastern Ethiopia. Journal of Environmental Planning and Management, 63(12), 2227–2245. https://doi.org/10.1080/09640568.2020.1717933
- Bett, C. (2004). Farm adoption decisions of soil and water management techniques in semiarid Eastern Kenya. A Paper Presented at the 48th Annual Conference of the Australian Agricultural and resource Economics Society. Melbourne, 11th-13th February, Australia.
- Binkley, D., & Fisher, R. F. (2019). Ecology and management of forest soils. John Wiley and Sons.
- Biratu, A. A., & Asmamaw, D. K. (2016). Farmers’ perception of soil erosion and participation in soil and water conservation activities in the Gusha Temela watershed, Arsi, Ethiopia. International Journal of River Basin Management, 14(3), 329–336. https://doi.org/10.1080/15715124.2016.1167063
- Bogale, A., & Urgessa, B. (2012). Households’ willingness to pay for improved rural water service provision: Application of contingent valuation method in Eastern Ethiopia. Journal of Human Ecology, 38(2), 145–154. https://doi.org/10.1080/09709274.2012.11906483
- Cassman, K. G., Dobermann, A., Walters, D. T., & Yang, H. (2003). Meeting cereal demand while protecting natural resources and improving environmental quality. Annual Review of Environment and Resources, 28(1), 315–358. https://doi.org/10.1146/annurev.energy.28.040202.122858
- Cavatassi, R. (2005). Valuation methods for environmental benefits in forestry and watershed investment projects. SSRN Electronic Journal. https://doi.org/10.2139/ssrn.3307569
- Census. (2007). Tables: Oromia region archived November 13, 2011, at the wayback machine.
- Chakravarty, S., Ghosh, S. K., Suresh, C. P., Dey, A. N., & Shukla, G. (2012). Deforestation: Causes, effects and control strategies. Global Perspectives on Sustainable Forest Management, 1, 1–26.
- Chaudhry, P. (2013). Valuing recreational benefits of urban forestry-A case study of Chandigarh city of India. International Journal of Environmental Sciences, 3(5), 1785–1789.
- Dessie, G., & Kleman, J. (2007). Pattern and magnitude of deforestation in the South central rift valley region of Ethiopia. Mountain Research and Development, 27(2), 162–168. https://doi.org/10.1659/mrd.0730
- Dogru, M. (2001). Planning and management of forest resources in Turkey (draft), Assistance for the preparation of a national programme for Turkey. Earthscan. London.
- Endalew, B., Assefa, W. B., Li, F., Li, F., & Li, F. (2019). Determinants of households’ willingness to pay for the conservation of church forests in northwestern Ethiopia: A contingent valuation study. Cogent Environmental Science, 5(1), 1570659. https://doi.org/10.1080/23311843.2019.1570659
- Federal Democratic Republic of Ethiopia (FDRE). (2012). Ethiopia’s climate-resilient green economy: Green economy strategy. Addis Ababa.
- Federal Democratic Republic of Ethiopia (FDRE). (2017). The 2017 voluntary national reviews on SDGs of Ethiopia: Government commitments, national ownership and performance trends. In National Plan Commission , June 2017. Addis Ababa.
- Gebrehiwot, S. G., Bewket, W., Gärdenäs, A. I., & Bishop, K. (2014). Forest cover change over four decades in the Blue Nile Basin, Ethiopia: Comparison of three watersheds. Regional Environmental Change, 14(1), 253–266. https://doi.org/10.1007/s10113-013-0483-x
- Gebremariam, G. G. (2012). Households’ willingness to pay for soil conservation practices in Adwa woreda. A Contingent Valuation Study. (no. 634-2016-41483).
- Gebremedhin, B., & Swinton, S. M. (2003). Investment in soil conservation in northern Ethiopia: The role of land tenure security and public programs. Agricultural Economics, 29(1), 69–84. https://doi.org/10.1111/j.1574-0862.2003.tb00148.x
- Gessesse, B. (2007). Forest cover change and susceptibility to forest degradation using remote sensing and GIS techniques: A case of Dendi district, West Central Ethiopia (Doctoral dissertation, Addis Ababa University).
- Getachew, T. (2018). Estimating willingness to pay for forest ecosystem conservation: The case of Wof-Washa Forest, North Shewa Zone, Amhara National Regional State, Ethiopia. Journal of Resources Development and Management, 46, 46–61.
- Gifawesen, S. T., Feyssa, D. H., & Feyissa, G. L. (2020). Analysis of forest cover change in Yabello Forest, Borana Zone, Ethiopia. International Journal of Biodiversity and Conservation, 12(4), 350–362. https://doi.org/10.5897/IJBC2018.1222
- Haab, T. C., & McConnell, K. E. (2002). Valuing Environmental and Natural Resources: The Econometrics of Non-Market Valuation. Edward Elgar Publishing Limited, Glensada House.
- Hanemann, M. (1984). Welfare evaluation in contingent valuation experiments with discrete responses. American Journal of Agricultural Economics, 66(3), 332–341. https://doi.org/10.2307/1240800
- Hansen, E. (2016). Responding to the bio economy: Business model innovation in the forest sector. In Kutnar, A., & Muthu, S. (Eds.), Environmental impacts of traditional and innovative forest-based bio products (pp. 227–248). Springer. https://doi.org/10.1007/978-981-10-0655-5_7
- Hume, A. M., Chen, H. Y., Taylor, A. R., Kardol, P., Kardol, P., & Kardol, P. (2018). Intensive forest harvesting increases susceptibility of northern forest soils to carbon, nitrogen and phosphorus loss. The Journal of Applied Ecology, 55(1), 246–255. https://doi.org/10.1111/1365-2664.12942
- Hynes, S., Chen, W., Vondolia, K., Armstrong, C., & O’Connor, E. (2021). Valuing the ecosystem service benefits from kelp forest restoration: A choice experiment from Norway. Ecological Economics, 179, 106833. https://doi.org/10.1016/j.ecolecon.2020.106833
- Indufor. (2016). Ethiopia commercial plantation forest industry investment plan. International Finance Corporation/World Bank Group.
- James, J., & Harrison, R. (2016). The effect of harvest on forest soil carbon: A meta-analysis. Forests, 7(12), 308. https://doi.org/10.3390/f7120308
- Jin, J., Wang, Z., & Liu, X. (2008). Valuing black-faced spoonbill conservation in Macao: A policy and contingent valuation study. Ecological Economics, 68(1–2), 328–335. https://doi.org/10.1016/j.ecolecon.2008.03.014
- Keenan, R. J., Reams, G. A., Achard, F., de Freitas, J. V., Grainger, A., & Lindquist, E. (2015). Dynamics of global forest area: Results from the FAO global forest resources assessment 2015. Forest Ecology and Management, 352, 9–20. https://doi.org/10.1016/j.foreco.2015.06.014
- Kelbessa, E., & Girma, A. (2011). Forest types in Ethiopia. Forum for Environment (FfE).
- Ketema, H., Wei, W., Legess, A., Wolde, Z., Temesgen, H., Yimer, F., & Mamo, A. (2020). Quantifying smallholder farmers’ managed land use/land cover dynamics and its drivers in contrasting agro-ecological zones of the East African rift. Global Ecology and Conservation, 21, 00898. https://doi.org/10.1016/j.gecco.2019.e00898
- Labao, R., Francisco, H., Harder, D., & Santos, F. I. (2008). Do colored photographs affect willingness to pay responses for endangered species conservation? Environmental & Resource Economics, 40(2), 251–264. https://doi.org/10.1007/s10640-007-9151-2
- Lincoln, Y. S., Lynham, S. A., & Guba, E. G. (2011). Paradigmatic controversies, contradictions, and emerging confluences, revisited. The Sage Handbook of Qualitative Research, 4(2), 97–128.
- Mayer, M., Prescott, C. E., Abaker, W. E., Augusto, L., Cécillon, L., Ferreira, G. W., James, J., Jandl, R., Katzensteiner, K., Laclau, J. P., Laganière, J., Nouvellon, Y., Paré, D., Stanturf, J. A., Vanguelova, E. I., & Vesterdal, L. (2020). Tamm review: Influence of forest management activities on soil organic carbon stocks: A knowledge synthesis. Forest Ecology and Management, 466, 118127. https://doi.org/10.1016/j.foreco.2020.118127
- Ministry of Environment, Forest and Climate Change (MEFCC). (2016). National forest sector development programmes. Ethiopia, I. Situation Analysis: 150.
- Ministry of Environment, Forest and Climate Change (MEFCC). 2017. Ethiopia forest sector review, focus on commercial forestry and industrialization. Technical Report, Addis Ababa,
- Ministry of Environment, Forest and Climate Change (MEFCC). (2018a). Ethiopia’s National Forestry Inventory.
- Ministry of Environment, Forest and Climate Change (MEFCC). (2018b). National forest sector development programmes, Ethiopia, Volume I: Situation analysis: 152.
- Nave, L. E., DeLyser, K., Butler Leopold, P. R., Sprague, E., Daley, J., & Swanston, C. W. (2019). Effects of land use and forest management on soil carbon in the ecoregions of Maryland and adjacent Eastern United States. Forest Ecology and Management, 448, 34–47. https://doi.org/10.1016/j.foreco.2019.05.072
- Negewo, E. N., Ewnetu, Z., & Tesfaye, Y. (2016). Economic valuation of forest conserved by local community for carbon sequestration: The case of Humbo community assisted natural regeneration afforestation/reforestation (A/R) carbon sequestration project; SNNPRS, Ethiopia. Low Carbon Economy, 7(02), 88. https://doi.org/10.4236/lce.2016.72009
- Nigussie, Z., Tsunekawa, A., Haregeweyn, N., Adgo, E., Cochrane, L., Floquet, A., & Abele, S. (2018). Applying Ostrom’s institutional analysis and development framework to soil and water conservation activities in northwestern Ethiopia. Land Use Policy, 71, 1–10. https://doi.org/10.1016/j.landusepol.2017.11.039
- Nune, S., Kassie, M., & Mungatana, E. (2013). Forest Resource Accounts for Ethiopia. In R. Hassan & E. Mungatana (Eds.), Implementing Environmental Accounts. Eco-Efficiency in Industry and Science (Vol. 28, pp. 103–142). Dordrecht: Springer. https://doi.org/10.1007/978-94-007-5323-5_5
- Nyongesa, J. M., Bett, H. K., Lagat, J. K., & Ayuya, O. I. (2016). Estimating farmers’ stated willingness to accept pay for ecosystem services: Case of Lake Naivasha watershed payment for ecosystem services scheme-Kenya. Ecological Processes, 5(1), 1–15. https://doi.org/10.1186/s13717-016-0059-z
- Ontl, T. A., Janowiak, M. K., Swanston, C. W., Daley, J., Handler, S., Cornett, M., Hagenbuch, S., Handrick, C., McCarthy, L., & Patch, N. (2020). Forest management for carbon sequestration and climate adaptation. Journal of Forestry, 118(1), 86–101. https://doi.org/10.1093/jofore/fvz062
- Pak, M. (2010). Total economic value of forest resources in Turkey. African Journal of Agricultural Research, 5(15), 1908–1916.
- Rawat, Y. S. (2017). Sustainable biodiversity stewardship and inclusive development in South Africa: A novel package for a sustainable future. Current Opinion in Environmental Sustainability, 24, 89–95. https://doi.org/10.1016/j.cosust.2017.03.003
- Seifu, T., Muhdin, M. B., & Asnakech, A. (2017). Economic valuation of natural forest: The case of Sheka forest. Journal of Resources Development and Management, 37, 30–38.
- Solomon, N., Hishe, H., Annang, T., Pabi, O., Asante, I. K., & Birhane, E. (2018). Forest cover change, key drivers and community perception in Wujig Mahgo Waren forest of northern Ethiopia. Land, 7(1), 32. https://doi.org/10.3390/land7010032
- Tilahun, M., Birner, R., & Ilukor, J. (2017). Household-level preferences for mitigation of Prosopis juliflora invasion in the Afar region of Ethiopia: A contingent valuation. Journal of Environmental Planning and Management, 60(2), 282–308. https://doi.org/10.1080/09640568.2016.1152955
- Toledo‐gallegos, V. M., Long, J., Campbell, D., Börger, T., & Hanley, N. (2021). Spatial clustering of willingness to pay for ecosystem services. Journal of Agricultural Economics, 72(3), 673–697. https://doi.org/10.1111/1477-9552.12428
- Tolessa, T., Dechassa, C., Simane, B., Alamerew, B., & Kidane, M. (2020). Land use/land cover dynamics in response to various driving forces in Didessa sub-basin, Ethiopia. GeoJournal, 85(3), 747–760. https://doi.org/10.1007/s10708-019-09990-4
- Vo, D. T., & Huynh, K. V. (2017). Estimating residents’ willingness to pay for groundwater protection in the Vietnamese Mekong Delta. Applied Water Science, 7(1), 421–431. https://doi.org/10.1007/s13201-014-0257-8
- Workie, L. T. (2017). Households’ willingness to pay for soil conservation practices on cultivated land in South Achefer district, Amhara National Regional State of Ethiopia: A Contingent Valuation Approach (No. 634-2018-5527).
- World Bank, for Ethiopians: A Regional Characterization (Retrieved March 23, 2006).
- Wu, S., Hou, Y., & Yuan, G. (2010). Valuation of forest ecosystem goods and services, and forest natural capital of the Beijing municipality, China. Unasylva, 61(1), 28–36.
- WWF and IUCN. (2001). Forest landscape restoration. Tanzania country report.
- Yu, X., & Abler, D. (2010). Incorporating zero and missing responses into CVM with open-ended bidding: Willingness to pay for blue skies in Beijing. Environment and Development Economics, 15(5), 535–556. https://doi.org/10.1017/S1355770X10000197
- Zegeye, H. (2018). Climate change in Ethiopia: Impacts, mitigation and adaptation. International Journal of Research in Environmental Studies, 5(1), 18–35.