
 ?Mathematical formulae have been encoded as MathML and are displayed in this HTML version using MathJax in order to improve their display. Uncheck the box to turn MathJax off. This feature requires Javascript. Click on a formula to zoom.
Abstract
The purpose of our study is to examine the Fishery-based Environmental Kuznets Curve (EKC) for a sample of 48 African countries between 1970–2019. We estimate cubic EKC-type models using quantile regression to account for distributional asymmetries existing in the time series data, and our empirical analysis is conducted at continental, regional and country-specific levels. Methodologically, our findings indicate that most EKC relationships are found at the tail-end of the quantile regressions, hence demonstrating their usefulness in capturing “hidden relationships” amongst the variables. Empirically, our findings reveal that Southern African countries along the Atlantic Ocean, as well as West African countries which lie along the Gulf of Guinea, tend to have exploitable Fishery-EKC. Conversely, conflict-prone countries found along the Mediterranean Sea, the Indian Ocean and landlocked nations either have inverse or non-existent Fisheries EKC. We provide a novel theoretical explanation for our findings and offer policy recommendations for different stakeholders in African Fisheries markets.
1. Introduction
The Environmental Kuznet’s curve (EKC), which was initially conjured as a “grow now, clean later” relationship between economic development and environmental degradation that can be empirically captured using a polynomial regression between greenhouse gas (GHG) and GDP/GDP per capita has more recently developed in the direction of using ecological footprints (EFs) as a proxy for environmental degradation (see Anwar et al., Citation2022; Bashir et al., Citation2021; Koondhar et al., Citation2021; Pincheira & Zuniga, Citation2021; Saqib & Benhmad, Citation2021; Sarkodie & Strezov, Citation2019; for some bibliometric reviews of the associated literature). The main motivation for the preference of the EF-based EKC over the traditional GHG-based EKC is that EF measures the biological productivity of land and sea required to create all the resources that a population consumes and to absorb its waste using prevailing technology (Charfeddine & Mrabet, Citation2017), whereas GHG emissions such as CO2, N2O and CH4 pollutants primarily arise from production activities (Danish et al., Citation2019; Ulucak & Bilgili, Citation2018). This makes EF a more suitable indicator of environmental degradation as it simultaneously captures both the production and consumption activities of society which can adversely impact the ecosystem directly or indirectly. Consequentially, EF has been increasingly embraced by governments, agencies, policymakers and academics as a complete measure of ecological performance (Hervieux & Darne, Citation2015).
Whilst a majority of previous studies investigating the EF-based EKC have typically relied on aggregated measures of anthropogenic activities on the ecosystem such as built-up land, cropland, fishing ground, grazing land and deforestation as a measure of environmental degradation (see Section 2 for an extensive review of the literature), our study specifically focuses on examining a “fishing activity” based EKC for a sample of 54 Africa countries, and the motivations for our study are based on important stylized facts, policy considerations, theoretical insinuations and empirical hiatuses identified in the academic literature.
Firstly, fisheries are the primary ecological indicator which captures marine activity, and fisheries play an important role in maintaining the health of marine ecosystems by enhancing the ocean’s regenerative capacity as well as ensuring the survival of marine lifeforms (Rashdan et al., Citation2021). Notably, African countries are well endowed with fisheries stocks, and this has, unfortunately, made the continent particularly prone to the problem of “overfishing,” which is exacerbated by the low regulatory oversight of marines and the resulting high levels of illegitimate fishing activity (Denton & Harris, Citation2021). This, in turn, and unlike other indicators of ecological biodiversity and environmental pollution, has made overfishing a source of global conflict. For instance, Devlin et al. (Citation2021) find that the number of annual violent conflicts based on fishing experienced in East African countries has been on the rise over the last three decades mainly in the form of piracy and armed robbery at sea. Pomeroy et al. (Citation2016) further observe similar conflicts in West Africa and around the gulf-of-Guinea whilst Arnason (Citation2021) discusses more dramatic conflicts involving armed forces such as the South African abalone poaching conflict. All-in-all, these facts highlight the suitability of Fisheries-based EKC as African countries are actively contributing to the problem of ecological degradation and conflict caused by overfishing. This is unlike the case for GHG pollution, where African countries contribute the least to the problem of carbon emissions and yet suffer the most from its repercussions (Doku et al., Citation2021).
Secondly, whilst fisheries are directly related to the Sustainable Development Goal (SDG) 14 of life below water, which focuses on the conservation and sustainable use of the oceans, seas and marine resources for sustainable development, fisheries further play a role in achieving other SDG goals such as SDG 1 of ending poverty, SDG 2 of eradicating hunger, SDG 3 of good health and well-being, SDG 12 of responsible consumption and development, SDG 13 of climate change as well as SDG 16 of peace, justice and strong institutions. For instance, fisheries are a major source of nutrients, sustenance and livelihood in poor African households as well as being an occupation of last resort, and thus, fisheries play a major role in addressing poverty, hunger and food security issues. Furthermore, fish consumption is considered as a healthier alternative to other forms of protein intake and provides a very high quality protein and “heart healthy” combination of fatty acids, which have been shown to possess anti-oxidation, anti-inflammation, wound healing, neuroprotection, cardioprotection and hepatoprotection properties (Chen et al., Citation2022; Sheeshka & Murkin, Citation2002). However, “overfishing” has been a major source of global warming and hence the management of fisheries is crucial in the fight against climate change. Moreover, “overfishing” remains a key concern from the perspective of conflict management and policy efforts to reduce illicit fishing activities that could subsequently contribute to enhancing peace within the continent.
Thirdly, both the traditional and EF-based EKC relationships have been theoretically criticized by biologists and environmental scientists since the shape of a typical EKC curve is based on the assumption that environmental pollution is not cumulative or its effects can be reversed, whilst in reality, the environmental pollution caused by CO2 emissions is cumulative and the disappearance of biodiversity is irreversible (Aydin et al., Citation2019). However, for the case of Fisheries, the dynamics of the traditional EKC hypothesis may be valid since depleted stock can be recovered if exploitation rates are substantially reduced and population abundance of fisheries remains at a level high enough to induce an Allee effect, which, in turn, makes fisheries a more suitable candidate of measured environment degradation that can be used to test the theoretical dictates of the EKC (Ding et al., Citation2017).
Lastly, the scientific knowledge on the fishery-based EKC is only at its nascent stage of development, and there is wide-scope for expanding the empirical literature. For instance, the current literature tends to focus on Asian and European countries (Aydin et al., Citation2019; Peng et al., Citation2020) and does not focus much on Africa. There are sole exceptions for Mauritius (Madhoo, Citation2011) and South Africa (Rashdan et al., Citation2021), but besides these countries there is no existing literature for other individual African countries. Moreover, none of the previous Fisheries-based EKC studies have gone beyond the use of traditional estimators in their empirical analysis. Recent studies such as Aydin et al. (Citation2019) and Lee and Chen (Citation2021) have criticized traditional estimators on the basis of their lack of flexibility in accounting for asymmetries existing in the EKC, and our study takes heed of these arguments and uses quantile regressions to circumvent the raised issues.
Our study thus contributes to the ongoing literature by investigating the Fishery-based EKC for a sample of 54 African countries using quantile regression analysis, and to ensure a rigorous empirical analysis, we examine the relationship from a continental, regional and country-specific perspective. In differing from previous studies, our analysis reveals that the Fishery-based EKC is most identifiable at tail-end of the quantile distributions implying that traditional mean-based estimates are inadequate at revealing hidden EKC relationships. Moreover, our regional-based and country-specific analysis reveal that Southern African countries as well as West African countries, which lie along the Gulf of Guinea, tend to have exploitable Fishery-EKC, whereas those conflict-prone countries which are found along the Mediterranean Sea, the Indian Ocean and as well as landlocked nations either have inverse or non-existent Fisheries EKC.
Ultimately, our findings have important implications for policymakers and various stakeholders in fisheries markets. For instance, our study implies that African countries with exploitable Fisheries EKC should be seeking to achieve levels of economic development required for African economies to reduce “overfishing” and promote fisheries stock recovery. Conversely, the implications for African countries with no exploitable Fisheries EKC is that fisheries conservation is not a programmed outcome of the technical and composition effects of economic development, and policymakers need find a balance on the “profit” and “wealth” objectives of different stakeholders through an integrated ecosystem-based approach to fisheries management.
The remainder of the study is organized as follows: Section 2 presents the literature review, Section 3 will present the empirical framework for the study, Section 4 discusses the data, Sections 5 and 6 present and discuss the results, whilst Section 7 concludes the study.
2. A review of the associated empirical literature
In this section of the paper, we present a review of empirical studies which have investigated the ecological-based EKC, and after an extensive search of the associated literature, we find 43 related manuscripts. Note that we restrict the review of the existing literature to studies which include quadratic and/or cubic “economic growth (per capita)” terms in their empirical regressions and consequentially excludes the studies of Sharif et al. (Citation2020), Udemba (Citation2020), Ikram et al. (Citation2021), Shahzad et al. (Citation2021), Rafindadi and Usman (Citation2021) and Q. Wang et al. (Citation2022) which do not include any higher order regression terms in their empirical analysis and mutually find a linear positive effect of EF on growth. Furthermore, to facilitate a more comprehensive understanding of the empirical literature, we segregate these studies into panel-based studies (22 papers), regional-based (6 papers) and country-specific studies (15 papers), which are summarized in Tables and Table , respectively. Moreover, we find it most convenient to discuss the reviewed literature based on whether the studies found:
Inverted U-shaped EKC (i.e. traditional quadratic EKC) which describes the evolution of environmental degradation and economic development in two stages. First, there are scale effects at early stages of development, where higher economic growth is facilitated in industries which heavily rely on “dirty” energy sources and technologies. Secondly, above some threshold level, technical effects (where output is produced more using more environmentally-friendly technologies) and composition effects (shift from agricultural intensive production sectors to services-based sectors) effects occur, which allows economies to produce output whilst lowering environmental degradation.
N-shaped (i.e. traditional cubic EKC) which is an extension of the U-shaped EKC and describes a third stage of development, where beyond a second turning point, scale effects overcome technical and composition effects and could be a consequence of the reduced abilities if industries to or diminishing returns on technology (Allard et al., Citation2018).
U-shaped (i.e. inverted quadratic EKC) in which growth per capita income initially improves environmental quality (inverse scale effects) and then damages the environment through scale effects when income is quickly increased beyond a certain threshold (Etokapan et al., Citation2021)
Inverted N-shaped (i.e. inverted cubic EKC) which is an extension of the U-shaped EKC and describes a more advanced development, beyond a second turning point, in which composition and technical effects occur and then rapid growth is accompanied with reduced degradation (Shehzad et al., Citation2022).
No significant U-shaped or N-shaped relationships in which both economic development and environmental degradation are independent of each other.
Table 1. Panel-based studies
Table 2. Regional-based studies
Table 3. Country-specific studies
From panel-based empirical works summarized in Table , it is evident that most panel studies (15 articles) found an inverted U-shaped EF-based EKC for their different samples (i.e. Bagliani et al. (Citation2008) for 145 countries, Al-Mulali et al. (Citation2015) for 93 countries, Asici and Acar (Citation2016) for 116 countries, Asici and Acar (Citation2018) for 87 countries, Charfeddine and Mrabet (Citation2017) for oil exporting MENA countries, Ding et al. (Citation2017) for 122 countries, Destek et al. (Citation2018) for 15 EU countries, Katircioglu et al. (Citation2018) for top 10 tourist countries, Masron and Subramaniam (Citation2018) for 64 developing countries, Sabir and Gorus (Citation2019) for 5 Asian countries, Ahmad et al. (Citation2020) for 22 emerging economies, Ahmad, Jiang, Majeed, et al. (Citation2021) for G7 countries, Kihombo et al. (Citation2021) for 9 WAME countries, Nathaniel (Citation2021a) for ASEAN countries, Lee and Chen (Citation2021) for 132 countries, Karimi et al. (Citation2022) for 17 Asia Pacific countries). Moreover, we find two articles which establish U-shaped relationships (i.e. Bagliani et al. (Citation2008) for 144 countries, Ahmed, Adebayo, et al. (Citation2021) for G7 countries); another two articles found an N-shaped relationship (i.e. Rahman et al. (Citation2019) for 16 CEE countries, Rashdan et al. (Citation2021) for 14 emerging countries) whilst three other papers found no significant quadratic or cubic EKC relationships (i.e. Y. Wang et al. (Citation2013) for 150 countries, Figge et al. (Citation2017) for 183 countries).
From Table , we observe discrepancies amongst the studies which take a regional approach to examining the EF-based EKC relationship, and these studies form the smallest group of literature, with six studies being conducted so far. For instance, the study of Al-Mulali et al. (Citation2015) examines the quadratic relationship for low income, lower-middle income, upper-middle income and high-income countries amongst a sample of 93 countries and finds the existence of an inverted U-shaped relationship for all groups except lower-middle income. Asici and Acar (Citation2016) and Ulucak and Bilgili (Citation2018) split their samples of 116 and 45 countries, respectively, into high, middle and low-income countries and finds an inverted U-shaped relationship in all income groups. Using a sample of 144 countries, Ozturk et al. (Citation2016) found an inverted U-shaped relationship for four low-income countries and six lower-middle income countries, whereas a U-shaped relationship was found for 16 upper-middle income countries and 19 high income countries. Conversely, Charfeddine and Mrabet (Citation2017) segregate their sample of 15 MENA countries into oil-exporters and non-oil exporters and find an inverted U-shaped relationship for former group and a U-shaped relationship for the latter group. Lastly, Jahanger et al. (Citation2022) examined the EF-based EKC for 73 developing countries which were further segregated into four continental regions, and the authors find an inverted U-shaped relationship for African, Latin American and Caribbean countries, whilst a U-shaped relationship was found for Asian countries.
From Table , the reviewed country-specific studies can be further segregated into two sub-strands of empirical literature. On the one hand, there are 13 studies which focused on single countries, with the studies of Madhoo (Citation2011) for Maritius, Bello et al. (Citation2018) for Malaysia, Hassan et al. (Citation2019) for Pakistan, Hassan et al. (Citation2019) for Pakistan, Ahmed and Wang (Citation2019) for India, Ahmed, Zhang, et al. (Citation2021) for Japan, Nathaniel (Citation2021b) for South Africa, Zia et al. (Citation2021) for China, Hussain et al. (Citation2022a) for Pakistan finding evidence of an inverted U-shaped relationship, whilst the studies of Acar and Asici (Citation2017) for Turkey and Ajmi and Inglesi-Lotz (Citation2020) for Tunisia find a U-shaped relationship, and furthermore, the study of Charfeddine (Citation2017) for Qatar finds no evidence of either U-shaped or inverted U-shaped relations. On the other hand, there are two studies which examined the EF-based EKC for a panel of countries using country-specific methods. From this sub-group of studies, Hervieux and Darne (Citation2015) found an inverted U-shaped relationship for two countries (Colombia and Uruguay) from a sample of seven Latin American countries; Destek and Sarkodie (Citation2019) focused on 11 newly industrialized economies and found no relationship in Brazil and Malaysia, U-shaped relationship in China, South Korea, Thailand and Turkey, whilst an inverted U-shaped relationship was found for Mexico, Philippines, Singapore and South Africa.
It is also interesting to note that while most previous EF-based EKC studies focused on using aggregated measures of ecological footprint, which capture the dimensions of cropland, grazing, fishing, forestry, carbon emissions and infrastructure, there is some recent literature which has specifically focused on fishing activities as an element of natural capital within the ecological sphere. For instance, the earlier study of Madhoo (Citation2011) conducted for Mauritius used marine fish production as an ecological proxy and found an inverted U-shaped relationship with GDP per capita. Furthermore, Aydin et al. (Citation2019) used fishing grounds footprint as an ecological factor in the EKC for 26 European countries and found an inverted U-shaped relationship for the panel. Peng et al. (Citation2020) examined the quadratic and cubic relations between fisheries economy and marine environment in 12 Chinese coastal regions and found inverted N-shaped relationship in East China and Yellow sea, whereas an inverted U-shape relationship was found for South China sea and Bohai regions. More recently, Rashdan et al. (Citation2021) verified an N-shaped fishery-based EKC for 14 emerging economies, and it is interesting to note that South Africa is the only African country in the panel.
2.1. Contribution of our study to the empirical literature
Our study extends the current emerging literature on fishery-based EKC relationship for a host of 46 African countries, and we draw from the strengths of previous EF-based literature to enhance our current knowledge on fishery-based EKC. Firstly, we use all literature classifications from previous EF-based EKC literature and conduct panel, regional and country-specific analysis for the fishery-based EKC relationship for African countries. In this context, the closet study to ours is that of Ozturk et al. (Citation2016) who applied a similar strategy for 144 countries albeit for investigating the EF-based EKC. Secondly, we methodologically differ from previous studies who have used conventional OLS (Madhoo, Citation2011), variant coefficient value method (Peng et al., Citation2020) and DOLS estimators (Rashdan et al., Citation2021) to investigate fishery-based EKC, and notably, these estimators are subject to criticisms such as their inability to capture distributional asymmetries in the data which could arises from structural breaks in the data or other forms of nonlinearities. To circumvent these criticisms relating to asymmetric behaviour, we borrow from the previous studies of Allard et al. (Citation2018), Lee and Chen (Citation2021), Ikram et al. (Citation2021) and Shahzad et al. (Citation2021) who have all used quantile-based regressions to capture distributional asymmetries in the EF-based EKC. The use of quantile regressions allows us to compute multiple turning points based on different distributions of the fisheries capture data which is analogous to capturing different strata of fisheries captures.
3. Empirical framework, methods and data
3.1. Empirical framework
Our study uses the traditional empirical EKC regression, with fisheries captures being the measure of environmental degradation:
where ln is a natural logarithm, β0 is the regression intercept, βi are the regression coefficients, CFP is capture fisheries production, GDPPC is per capita GDP, GDPPC2 is the square of per capita GDP, GDPPC3 is the cube of per capita GDP and eit is well-behaved residual term. The vector X is a set of control variables inclusive of urbanization, institutional quality and trade openness, which according to literature significantly affects environmental degradation. Many studies find urbanization and trade openness harm environmental degradation, whereas better institutions enhance a cleaner economy (Park & Lee, Citation2011; Ahmad et al., Citation2021b; Ahmed & Wang, Citation2019; Almeida et al., Citation2017; Asici & Acar, Citation2018; Charfeddine & Mrabet, Citation2017; Dogan et al., Citation2019; Dogan et al., Citation2020; Hussain et al., Citation2022b; Murshed et al., Citation2021; Sugiawan et al., Citation2017) From Equationequation (1)(1)
(1) , there are three possible outcomes which yield three testable hypotheses. Firstly, there can exist a strictly linear relationship where the coefficient βi1 is significant whilst the coefficients βi2 and βi3 are insignificant. Secondly, there can be a quadratic relationship in which βi1 and βi2 are significant whilst βi3 is insignificant, and furthermore, the traditional EKC (i.e. inverted U-shaped) exists if βi1 >0, βi2 <0, whereas an inverted EKC exists if βi1 <0, βi2 >0. Lastly, there can be a cubic relationship in which βi1, βi2 and βi3 are all significant with a N-shaped relationship existing if βi1 >0, βi2 <0, βi3 >0, whereas an inverted N-shaped relationship exists when βi1 <0, βi2 >0, βi2 <0.
Notably, the existing literature has provided different theoretical explanations for the different shapes of the Fisheries-based EKC. For instance, Madhoo (Citation2011) and Peng et al. (Citation2020) describe the traditional inverted U-shaped Fisheries EKC as consisting of “scale” effects, which arise at earlier stages of economic development when the economy is dependent on agriculture and large-scale fishing, and growth of the population and income at this stage leads to more fisheries catch. However, when economic development surpasses a certain level, technical effects take over and fish catch is eventually discouraged and pollution affecting biodiversity is abated, which results in increased fish exports and higher income growth. Rashdan et al. (Citation2021) identify a third phase of development composition and technical effects which occur after crossing the second turning point. At this stage, the economy is characterized by stricter environmental regulations, cleaner industries and technologies, and improved R&D activity, all of which leads to better resource management of fisheries and innovations that improve the fisheries catch yet preserve aqua ecosystem.
On the other hand, there exist other explanations in the literature for the U-shaped and inverted N-shaped relationship. For instance, Peng et al. (Citation2020) explains the U-shaped Fisheries EKC as consisting of inverse scale effects which arise due to high water pollution experienced during the earlier stages of development consequentially leading to decreasing fisheries catch before the first turning point, technical effects occur after crossing the first turning point in which water pollution is improved and consequentially fish stock increases alongside income, and composition effects which occur after crossing the second threshold due to a shift from traditional agriculture and fishing sectors to manufacturing and services oriented industries.
3.2. Empirical methods
To estimate Equationequation (1)(1)
(1) , we use quantile regressions, which are powerful econometric tools used to examine how covariates influence the shape, scale and location at different points of the response distribution. In our study, we use quantile regressions on the conditional distribution, and it is carried out by estimating the dependent variable (CFP) at different quantiles of conditional distribution of the independent variables (GDP and GDP2). The representation of the conditional quantile for a panel Yit given Xit i is specified as:
And the conditional mean function of Y on it’s set of conditioning covariates (X) which can be expressed as:
where, is a random sample on the regression process.
, with conditional distribution function of
and
is the sequences of (row) k-vectors of a known design matrix. The
regression quantile,
is any solution to minimize problems,
denotes the solution from which the
conditional quantile
, and our study uses 3 “quantiles” within the regression which are designated at the 25th, 50th and 75th quantiles of conditional distribution.
3.3. Data description and classifications
The data used in our study are exclusive sourced from the World Bank and consist of total fisheries production in metric tons and per capita GDP for 43 African countries, i.e. Algeria, Angola, Benin, Botswana, Burkina Faso, Burundi, Cameroon, Central African Republic (CAR), Chad, democratic of Congo (DRC), Congo, Cote D’Ivoire, Djibouti, Egypt, Eritrea, Eswatini, Ethiopia, Gabon, Gambia, Ghana, Guinea, Guinea Bissau, Kenya, Lesotho, Liberia, Libya, Madagascar, Malawi, Mali, Mauritania, Mauritius, Morocco, Mozambique, Namibia, Niger, Nigeria, Rwanda, Senegal, Sierra Leone, Somalia, South Africa, Sudan, Tanzania, Togo, Tunisia, Uganda, Zambia, and Zimbabwe. We further segregate the African countries into seven regional classifications based on i) oil producing and non-oil producing countries (Charfeddine & Mrabet, Citation2017) ii) low, middle and middle-high income countries (Al-Mulali et al., Citation2015; Ozturk et al., Citation2016) iii) landlocked vs coastal countries (Peng et al., Citation2020) iv) regional blocs such as SADC, COMESA, ECOWAS, EAC, SACU, ECCAS, IGAD, EMU, SEN-SAD. The data are collected over the period 1970–2019 and are based on availability. Table summarizes the included countries for each of the 14 regions used in our study whilst Figure depicts the Fisheries and per capita income time series for individual African economies.
Figure 1. Cross-sectional plots of fisheries and per capita GDP in 48 African countries.
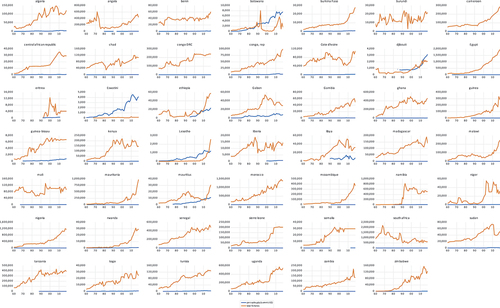
Table 4. Regional classifications of African countries
4. Empirical analysis
In this section of the paper, we present the empirical results from the estimation of the quantile regressions, with Table presenting the results at continental and regional levels, whereas Table presents the country-specific estimates. We discuss our results according to whether the different regions or countries exert N-shape, inverted N-shape or no EKC effects within the data at different quantiles of distribution. Note that we do not report for U-shaped and inverted-U shaped relationship as none of our results provides evidence in support of the aforementioned relationships.
Table 5. Continental and regional panel quantile estimates
Table 6. Country-specific quantile estimates
From the panel based quantile estimates presented in Table , we find i) an N-shaped relationship for full sample (25th and 75th quantiles) as well as 9 out of the 16 regional groups i.e. Non-oil (all quantiles), low-income (all quantiles), Upper middle-income (25th and 50th quantiles), Landlocked (all quantiles), COMESA (all quantiles), SADC (25th and 50th quantiles), EAC (25th and 50th quantiles), ECCAS (25th and 50th quantiles), IGAD (all quantiles). ii) Inverted N-shape for 5 regional groups i.e. oil-producers (all quantiles), AMU (25th quantile), SEN-SAD (75th quantile), ECOWAS (50th and 75th quantiles), SACU (50th quantile). iii) No relationship for the remaining 2 regional-groups i.e. lower middle-income countries and coastal counties.
From the country-specific quantile estimates in Table , we find i) an N-shape for 23 out of the 48 individual African countries i.e. Benin (25th and 75th quantiles), Burkina Faso (all quantiles), Cameroon, CAR (50th and 75th quantiles), Chad (50th quantiles), Cote d’Ivoire (50th and 75th quantiles), Djibouti (75th quantile), Eriteria (50th and 75th quantiles), Eswatini (75th quantiles), Ethiopia (25th and 50th quantiles), Gambia (25th and 50th quantiles), Ghana (all quantiles), Lesotho (50th quantile), Malawi (all quantiles), Mauritius (50th and 75th quantiles), Namibia (quantiles 50th and 75th quantiles), Niger (25th quantiles), Nigeria (25th and 50th quantiles), Rwanda (25th quantile), South Africa (all quantiles), Senegal (25th quantile), Sudan (50th quantile), Togo (all quantiles)); ii) an inverted N-relationship for 9 countries i.e. Algeria (50th and 75th quantiles), Egypt (75th quantile), Gabon (75th quantile), Guinea Bissau (75th quantiles), Mali (50th and 75th quantiles), Mozambique (75th quantiles), Somalia (50th quantiles), Tunisia (25th and 50th quantiles), Zimbabwe (50th and 75th quantiles); iii) and no relationship for the remaining 15 countries i.e. Angola, Botswana, Burundi, Congo, DRC, Kenya, Liberia, Libya, Madagascar, Mauritania, Morocco, Sierra Leone, Tanzania, Uganda, Zambia.
Further analysis of these results presents with some discrepancies between regional and country-specific analysis. For instance, whilst the N-shaped relationship was found in 9 regional groups, our country-specific analysis provides corresponding evidence for only 4 out of the 10 ECCAS countries; 4 out of the 7 IGAD countries; 10 out of the 21 low-income countries; 3 out of 7 upper middle income countries; 9 out of the 16 landlocked countries; 7 out of the 17 COMESA countries; 6 out of the 14 SADC countries and 2 out of 6 the EAC countries. Furthermore, the inverted N-shaped relationship which was found for 4 regional groups, is only found in the country-specific evidence for 5 out 15 oil producing countries; 1 out of the 5 AMU countries; 1 out of the CEN-SAD countries and 2 out of the 13 ECOWAS countries whilst the finding of no relationship for the remaining 2 regions was only confirmed by country specific evidence for 9 out of 19 middle income countries and 13 out of the 33 coastal countries.
Collectively, we observe that the findings at continental and regional level are only representative of about half of the findings obtained at country-specific level which resonates well with the similar observations made by Ozturk et al. (Citation2016) albeit of for the 144 countries and in context of the EF-based EKC. Furthermore, over two-thirds of the regional analysis and more than half of the country-specific evidence verifies an N-shape Fisheries-based EKC which aligns with the findings of Peng et al. (Citation2020) and Rashdan et al. (Citation2021) for Chinese coastal regions and 14 emerging economies (including South Africa), respectively. Note that 21 of 24 individual countries which found an N-shaped Fisheries EKC are situated in Central and Western Africa with a majority lying on the coastal side Atlantic Ocean. On the other hand, about a fifth of the panel and country-specific evidence shows an inverted N-shaped relationship which is comparable to the findings in Peng et al. (Citation2020). Furthermore, we find that whilst there is very little evidence of no relationship at continental and regional levels, about a third of the country-specific evidence shows no exploitable Fisheries-based EKC relationship. We lastly note that 21 out of the 24 countries which either found an inverted N-shape curve or no relationship are coastal nations, with a majority of these countries being clustered on the east border of the African continent.
5. Further discussion on empirical findings
In this section we provide further discussion on the implications of our findings in context of methodological advantages presented by our analysis, the empirical allusions associated with the country-specific findings, an extended theoretical insinuations drawn from the study as well as policy recommendations.
5.1. Empirical implications
Methodologically, we find the use of quantile regression very appropriate as an estimation technique for testing the Fisheries-based EKC. In particular, we observe a number of panel samples (full sample, AMU and SEN-SAD regions) and individual countries (Benin, Djibouti, Egypt, Eswatini, Gabon, Guinea Bissau, Mozambique, Niger, Rwanda, Senegal) which find significant relationships at either 25th and/or 75th quantile distributions, implying that other traditional estimators would not be able to capture these relationships since their estimates are “mean-based” and thus centered around the 50th quantile distribution.
Empirically, we find that Western African and Central African countries, particularly along the Gulf of Guinea (Benin, Burkina Faso, Cameroon, CAR, Cote d’Ivoire, Djibouti, Gambia, Ghana, Niger, Nigeria, Senegal, Togo) and the lower parts of Southern Africa (Eswatini, Lesotho, Namibia, South Africa), tend to have an exploitable EKC, such that scale effects are dominant during early stages of development whilst technical and composition effects become more dominant during the later stages of economic development. On the other hand, our empirical findings indicate that insignificant and inverse EKC relationships (i.e. scale effects become more dominant than technical and composition effects during the later stages of economic development) exist mainly for countries which lie on the north-east, east and south eastern parts of the continents borders along the Mediterranean Sea (Algeria, Egypt, Libya, Morocco, Tunisia) and Indian Ocean (Kenya, Madagascar, Mozambique, Somalia, Tanzania) as well as for landlocked countries which rely on major rivers like the Zambezi river (Angola, Botswana, Mozambique, Zambia, Zimbabwe), Congo River (Angola, Congo and DRC) and Lake Victoria (Kenya, Tanzania, Uganda). We further note that countries which either produce insignificant or inverse EKC are most vulnerable to fisheries conflicts.
5.2. Theoretical implications
We now provide some theoretical explanations underlying the N-shaped and inverted N-shaped Fishery EKC found for our African sample. We present an extended theoretical explanation of the Fisheries EKC in terms of government regulations and their effects on wealth and welfare dynamics of fisheries management at different stages of development. On the one hand, wealth effects arise from industrial fisheries who focus on “fishing for a profit” and prefer government to implement right to private property rights to the fisheries sector (legal framework of individual property rights). On the other hand, welfare effects are attributed from small-scale or artisanal fishing whose objective is to “fish for well-being” and prefer government to implement policies which safe guard small fisheries and prevent overfishing by industrial vessels (Okeke-Ogbuafor & Gray, Citation2021).
For the N-shaped Fisheries based EKC, scale effects occur during early stages of development due to lack of government regulation on fisheries which encourages the wealth-creation objective of industrial fisheries who embark on large scale fisheries catches leading an increasing in fisher catch. However, as the marine quality starts to degrade and fish stocks are fully fished or overfished, government begins to implement strict regulations on both large-scale and small-scale fisheries leading to a decrease in overall fisheries catches. And at an even higher level of development, government begins to be more green-oriented and starts to work closely with scientists and fisher(wo)men to come up with innovative methods and a more balanced approach to implementing restrictions on both large or small-scale fisheries whilst preserving the growth of newer fish species and protecting marine life (i.e. technical and composition effect). Therefore, fisheries’ conservation at later stages of development is an outcome of better cooperation between government, small-scale farmers and industrial fishers which, in turn, balances “welfare” and “profit” effects in fisheries management as these economies further develop.
For the inverted N-shaped Fisheries-based EKC, we hypothesize inverse-scale effects at initial stages of development, whereby government encourages licensed large-scale fishing by accepting payments from foreign vessels to access its coastal waters, and this results in a loss of catch for domestic fisheries and deterioration of marine life quality (Okeke-Ogbuafor et al., Citation2020). The first turning point occurs when the economy is developed enough to allow small-scale fishers to increase the sizes of their vessels and may use illegitimate methods, such as dynamite, to increase their catch, which leads to an increase in domestic fisheries catch, i.e. scale effects. However, the failure of the government to implement governing policies overfishing begins to occur, leads to the second turning, when governments begin to implement inefficient policies on large and small which then results in a falling trend in fisheries catch. At this stage of development, both welfare and profit objectives are pursued through illegitimate means and this may result in increased conflict between small-scale and large-scale fisheries. Further innovations in Fisheries catch methods are likely to lead to increased imbalances between welfare and wealth objectives, which, in turn, could lead to decreasing returns to scale in fisheries catch.
5.3. Policy recommendations
Lastly, we prescribe four policy recommendations based on our results. The first policy recommendation is for the strengthening of regulatory oversight in limiting large-scale vessels from other Asian economies in over-exploiting the fishing grounds on the North and East coast of Africa’s borders as means of protecting small-scale fisheries in enhancing their welfare objective. The second policy recommendation is for the increase in training of small-scale fisher (wo)men in fisheries management and the incorporation of small-scale fisheries in the decision-making process undertaken by various management councils. The third policy recommendation would be to identify management strategies which would maximize fisheries yields and be beneficiary to both large scale and small-scale fisheries. For instance, African countries could consider no-take marine reserves as an inefficient conservation tool compared to quota-based management system. The last policy recommendation would be for increased participation from the scientific community in dealing with water pollution, improving fish disease diagnostic and prevention facilities as well as pushing research and development initiatives in identifying or creating new species of fishes.
6. Conclusions
In this paper, we examine whether the EKC, which hypothesizes that improved environmental conditions are a programmed outcome of improved economic development, is applicable for the case of Fisheries in 48 African countries. We particularly hypothesize that significant Fisheries-based EKC effect reflects a balance between “welfare” and “profit” effects in Fisheries management, and countries with inverse or insignificant relationships reflect imbalances in these effects. We use quantile regressions to account for asymmetries in the distributional effects of the estimators and our empirical analysis is conducted at continental, regional and country-specific levels. Whilst we find more evidence of an N-shaped Fisheries-based EKC at continental and panel levels, less than half of the individual countries find similar N-shaped relationships. In further disseminating our findings, most countries with significant N-shaped relationship are found in West, Central and most Southern parts Africa whereas those with inverted or insignificant relationships are found along the Mediterranean Sea and Indian Ocean at the east border of the continent as well as those countries who are depend on the Zambezi river in Southern Africa and Victoria Lake in East Africa.
The overall policy implication of our study is that fisheries conservation is not a programmed outcome of the technical and composition effects of economic development for more than half of the African countries. Interestingly, most of the countries which have insignificant or inverse Fisheries based-EKC are prone to Fisheries conflicts, which our study attributes to imbalances in welfare and wealth objectives in Fisheries management that are exacerbated by inefficient management strategies and poor coordination between different stakeholders. Therefore, in prescribing policy recommendations for these nations, emphasis needs to be placed on the collaborative role which policymakers, small-scale fishers, large-scale fishers and scientific community play in balancing the “welfare” and “profit” objectives of different stakeholders through an integrated ecosystem-based approach to fisheries management.
Disclosure statement
No potential conflict of interest was reported by the author(s).
References
- Acar, S., & Asici, A. (2017). Nature and economic growth in Turkey: What does ecological footprint imply?. Middle East Development Journal, 9(1), 101–27. for the entire panel of countries. https://doi.org/10.1080/17938120.2017.1288475
- Ahmad, M., Jiang, P., Majeed, A., Umar, M., Khan, Z., & Muhammad, S. (2021a). The dynamic impact of natural resources, technological innovations and economic growth on ecological footprint: An advanced panel data estimation. Sustainable Cities and Society, 69, e101817. https://doi.org/10.1016/j.resourpol.2020.101817
- Ahmad, M., Jiang, P., Murshed, M., Shehzad, K., Akram, R., Cui, L., & Khan, Z. (2021b). Modelling the dynamic linkages between eco-innovation, urbanization, economic growth and ecological footprints for G7 countries: Does financial globalization matter? Sustainable Cities and Society, 70, e102881. https://doi.org/10.1016/j.scs.2021.102881
- Ahmed, Z., Adebayo, T., Udemba, E., Murshed, M., & Kirrkkaleli, D. Effects of economic complexity, economic growth, an renewable energy technology budgets on ecological footprint: The role of democratic accountability. (2021). Environmental Science and Pollution Research, 29(17), 24925–24940. (forthcoming). https://doi.org/10.1007/s11356-021-17673-2
- Ahmed, Z., & Wang, Z. (2019). Investigating the impact of human capital on the ecological footprint in India: An empirical analysis. Environmental Science and Pollution Research, 26(26), 26782–26796. https://doi.org/10.1007/s11356-019-05911-7
- Ahmed, Z., Zhang, B., & Cary, M. (2021). Linking economic globalization, economic growth, financial development, and ecological footprint: Evidence from symmetric and asymmetric ARDL. Ecological Indicators, 121, e107060. https://doi.org/10.1016/j.ecolind.2020.107060
- Ajmi, A., & Inglesi-Lotz, R. (2020). Revisiting the Kuznets curve hypothesis for Tunisia: Carbon dioxide vs. ecological footprint. Energy Sources, Part B: Economics, Planning, & Policy, 16(5), 406–419. https://doi.org/10.1080/15567249.2020.1850923
- Allard, A., Takman, J., Uddin, G. S., & Ahmed, A. (2018). The N-shaped environmental Kuznets curve: An empirical evaluation using a panel quantile regression approach. Environmental Science and Pollution Research, 25(6), 5848–5861. https://doi.org/10.1007/s11356-017-0907-0
- Almeida, T., Cruz, L., Barata, E., & Garcia-Sanchez, I. (2017). Economic growth and environmental impacts: An analysis based on a composite index of environmental damage. Ecological Indicators, 76, 119–130. https://doi.org/10.1016/j.ecolind.2016.12.028
- Al-Mulali, U., Weng-Wai, C., Sheau-Ting, Mohammed, A., & Sheau-Ting, L. (2015). Investigating the environmental Kuznets curve (EKC) hypothesis by utilizing the ecological footprint as an indicator of environmental degradation. Ecological Indicators, 48, 315–323. https://doi.org/10.1016/j.ecolind.2014.08.029
- Anwar, M., Zhang, Q., Asmi, F., Hussain, N., Plantinga, A., Zafar, M., & Sinha, A. (2022). Global perspectives on environmental Kuznets curve: A bibliometric review. Gondwana Research, 103, 135–145. https://doi.org/10.1016/j.gr.2021.11.010
- Arnason, R. (2021), Economics of fisheries conflict, oxford research encyclopedia of environmental science, Retrieved March 23, 2022. from https://oxfordre.com/environmentalscience/view/10.1093/acrefore/9780199389414.001.0001/acrefore-9780199389414-e-772
- Asici, A., & Acar, S. (2016). Does income growth relocate ecological footprint? Ecological Indicators, 61(2), 707–714. https://doi.org/10.1016/j.ecolind.2015.10.022
- Asici, A., & Acar, S. (2018). How does environmental regulation affect production location of non-carbon ecological footprint? Journal of Cleaner Production, 178, 927–936. https://doi.org/10.1016/j.jclepro.2018.01.030
- Aydin, C., Esen, O., & Aydin, R. (2019). Is the ecological footprint related to the Kuznets curve a real process or rationalizing the ecological consequences of the affluence? Evidence from PSTR approach. Ecological Indicators, 98, 543–555. https://doi.org/10.1016/j.ecolind.2018.11.034
- Bagliani, M., Bravo, G., & Dalmazzone, S. (2008). A consumption-based approach to environmental Kuznets curves using the ecological footprint indicator. Ecological Economics, 65(3), 650–661. https://doi.org/10.1016/j.ecolecon.2008.01.010
- Bashir, M., Ma, B., Bashir, M., Bilal, B., & Shahzad, L. (2021). Scientific data-driven evaluation of academic publications on environmental Kuznets curve. Environmental Science and Pollution Research, 28(14), 16982–16999. https://doi.org/10.1007/s11356-021-13110-6
- Bello, M., Solarin, A., & Yen, Y. (2018). The impact of electricity consumption on CO2 emission, carbon footprint and ecological footprint: The role of hhydropower in an emerging economy. Journal of Environmental Management, 219, 218–230. https://doi.org/10.1016/j.jenvman.2018.04.101
- Bulut, U. (2021). Environmental sustainability in Turkey: An environmental Kuznets curve estimation for ecological footprint. International Journal of Sustainable Development and World Ecology, 28(3), 227–237. https://doi.org/10.1080/13504509.2020.1793425
- Caviglia-Harris, J., Chambers, D., & Kahn, J. (2009). Taking the “U” out of Kuznets: A comprehensive analysis of the EKC and environmental degradation. Ecological Economics, 68(4), 1149–1159. https://doi.org/10.1016/j.ecolecon.2008.08.006
- Charfeddine, L. (2017). The impact of energy consumption and economic development on ecological footprint and CO2 emissions: Evidence from a markov switching equilibrium correction model. Energy Economics, 65, 355–374. https://doi.org/10.1016/j.eneco.2017.05.009
- Charfeddine, L., & Mrabet, Z. (2017). The impact of economic development and social-political factors on ecological footprint: A panel data analysis for 15 MENA countries. Renewable and Sustainable Energy Reviews, 76, 138–154. https://doi.org/10.1016/j.rser.2017.03.031
- Chen, J., Jayachandran, M., Bai, W., & Xu, B. (2022). A critical review on the health benefits of fish consumption and its bioactive constituents. Food Chemistry, 369, e130874. https://doi.org/10.1016/j.foodchem.2021.130874
- Danish, K., Hassan, S., Baloch, M., Mahmood, N., & Zhang, J. (2019). Linking economic growth and ecological footprint through human capital and biocapacity. Sustainable Cities and Society, 47, e101516. https://doi.org/10.1016/j.scs.2019.101516
- Denton, G., & Harris, J. (2021). The impact of illegal fishing on maritime piracy: Evidence from West Africa. Studies in Conflict and Terrorism, 44(11), 938–957. https://doi.org/10.1080/1057610X.2019.1594660
- Destek, M., & Sarkodie, S. (2019). Investigation of environmental Kuznets curve for ecological footprint: The role of energy and financial development. Science of the Total Environment, 650(2), 2483–2489. https://doi.org/10.1016/j.scitotenv.2018.10.017
- Destek, M., Ulucak, R., & Dogan, E. (2018). Analyzing the environmental Kuznets curve for the EU countries: The role of ecological footprint. Environmental Science and Pollution Research, 25(29), 29387–29396. https://doi.org/10.1007/s11356-018-2911-4
- Devlin, C., Glaser, S., Lambert, J., & Villegas, C. (2021). The causes and consequences of fisheries conflict around the horn of Africa. Journal of Peace Research, 20(10), 1–13. https://doi.org/10.1177/00223433211038476
- Ding, Q., Wang, Y., Chen, X., & Chen, Y. (2017). Effects of economics and demographics on global fisheries sustainability. Conservation Biology, 31(4), 799–808. https://doi.org/10.1111/cobi.12873
- Dogan, E., Taspinar, N., & Gokmenoglu, K. (2019). Determinants of ecological footprint in MINT countries. Energy & Environment, 30(6), 1065–1086. https://doi.org/10.1177/0958305X19834279
- Dogan, E., Ulucak, R., Kocak, E., & Isik, C. (2020). The use of ecological footprint in estimating the environmental Kuznets curve hypothesis for BRICST by considering cross-section dependence and heterogeneity. Science of the Total Environment, 723, e138063. https://doi.org/10.1016/j.scitotenv.2020.138063
- Doku, I., Ncwadi, R., & Phiri, A. (2021). Determinants of climate finance: Analysis of recipient characteristics in Sub-Sahara Africa. Cogent Economics & Finance, 9(1), e1964212.
- Etokapan, M., Akadiri, S., & Alola, A. (2021). Natural gas consumption-economic output and environmental sustainability target in China: An N-shaped hypothesis inference. Environmental Science and Pollution Research, 28(28), 37741–37753. https://doi.org/10.1007/s11356-021-13329-3
- Figge, L., Oebels, K., & Offermans, A. (2017). The effects of globalization on ecological footprints: An empirical analysis. Environment, Development and Sustainability, 19(3), 863–876. https://doi.org/10.1007/s10668-016-9769-8
- Hassan, S., Xia, E., Khan, N., & Shah, S. (2019). Economic growth, natural resources, and ecological footprints: Evidence from Pakistan. Environmental Science and Pollution Research, 26(3), 2929–2938. https://doi.org/10.1007/s11356-018-3803-3
- Hervieux, M., & Darne, O. (2015). Environmental Kuznets curve and ecological footprint: A time series approach. Economics Bulletin, 35(1), 814–826.
- Hussain, M., Usman, M., Khan, J., Tarar, Z., & Sarwar, M. (2022a). Reinvestigation of environmental Kuznets curve with ecological footprints: Empirical analysis of economic growth and population density. Journal of Public Affairs, 22(1), e2276. https://doi.org/10.1002/pa.2276
- Hussain, M., Usman, M., Khan, J., Tarar, Z., & Sarwar, M. (2022b). Reinvestigation of the environmental Kuznets curve with ecological footprints: Empirical analysis of economic growth and population density. Journal of Public Affairs, 22(1), e2276. https://doi.org/10.1002/pa.2276/
- Ikram, M., Xia, W., Fareed, Z., Shahzad, U., & Rafique, M. (2021). Exploring the nexus between economic complexity, economic growth and ecological footprint: Contextual evidence from Japan. Sustainable Energy Technologies and Assessments, 47, e101460. https://doi.org/10.1016/j.seta.2021.101460
- Jahanger, A., Usman, M., Murshed, M., Mahmood, H., & Balsalobre-Lorente, D. (2022). The linkages between natural resources, human capital, globalization, economic growth, financial development, and ecological footprint: The moderating role of technological innovations. Resources Policy, 76, e102569. https://doi.org/10.1016/j.resourpol.2022.102569
- Karimi, M., Khezri, M., Khan, Y., & Razzaghi, S. (2022). Exploring the influence of economic freedom index on fishing grounds footprint in environmental Kuznets curve framework through spatial econometrics technique: Evidence from Asia-Pacific countries. Environmental Science and Pollution Research, 29(4), 6251–6266. https://doi.org/10.1007/s11356-021-16110-8
- Katircioglu, S., Gokmenoglu, K., & Eren, B. (2018). Testing the role of tourism development in ecological footprint quality: Evidence from top 10 tourist destinations. Environmental Science and Pollution Research, 25(33), 33611–33619. https://doi.org/10.1007/s11356-018-3324-0
- Kihombo, S., Ahmed, Z., Chen, S., Adebayo, T., & Kirikkaleli, D. (2021). Linking financial development, economic growth, and ecological footprint: What is the role of technological innovation? Environmental Science and Pollution Research, 28(43), 61235–61245. https://doi.org/10.1007/s11356-021-14993-1
- Koondhar, M., Shahbaz, M., Memon, K., Ozturk, I., & Kong, R. (2021). A visualization review analysis of the last two decades for environmental Kuznets curve “EKC” based on co-citation analysis theory and pathfinder network scaling algorithms. Environmental Science and Pollution Research, 28(13), 16690–16706. https://doi.org/10.1007/s11356-020-12199-5
- Lee, C., & Chen, M. (2021). Ecological footprint, tourism development, and country risk: International evidence. Journal of Cleaner Production, 279, e123671. https://doi.org/10.1016/j.jclepro.2020.123671
- Madhoo, Y. (2011). Fish imports as an environmental policy. Applied Economics Letters, 18(9), 859–864. https://doi.org/10.1080/13504851.2010.508712
- Masron, T., & Subramaniam, Y. (2018). The environmental Kuznets curve in the presence of corruption in developing countries. Environmental Science and Pollution Research, 25(13), 12491–12506. https://doi.org/10.1007/s11356-018-1473-9
- Murshed, M., Haseeb, M., & Alam, M. (2021). The environmental Kuznets curve hypothesis for carbon and ecological footprints in South Asia: The role of renewable energy. GeoJournal, 87(3), 2345–2372. (forthcoming). https://doi.org/10.1007/s10708-020-10370-6
- Nathaniel, S. (2021a). Economic complexity versus ecological footprint in the era of globalization: Evidence from ASEAN countries. Environmental Science and Pollution Research, 28(45), 64871–64881. https://doi.org/10.1007/s11356-021-15360-w
- Nathaniel, S. (2021b). Natural resources, urbanization, economic growth and the ecological footprint in South Africa: The moderating role of human capital. Quaestiones Geographicae, 40(2), 63–76. https://doi.org/10.2478/quageo-2021-0012
- Okeke-Ogbuafor, N., & Gray, T. (2021). Is community-based management of small-scale fisheries in Sierra Leone the answer to their problems? World Development Perspectives, 21, e100292. https://doi.org/10.1016/j.wdp.2021.100292
- Okeke-Ogbuafor, N., Gray, T., & Stead, S. (2020). the controversial role of foreign fisheries consultants in Sierra Leone’s coastal waters. Marine Policy, 118, e103399. https://doi.org/10.1016/j.marpol.2018.12.018
- Ozturk, I., Al-Mulali, U., & Saboori, B. (2016). Investigating the environmental Kuznets curve hypothesis: The role of tourism and ecological footprint. Environmental Science and Pollution Research, 23(2), 1916–1928. https://doi.org/10.1007/s11356-015-5447-x
- Park, S., & Lee, Y. (2011). Regional model of EKC for air pollution: Evidence from the Republic of Korea. Energy Policy, 39(10), 5840–5849. https://doi.org/10.1016/j.enpol.2011.06.028
- Peng, D., Yang, Q., Yang, H., Liu, H., Zhu, Y., & Mu, Y. (2020). Analysis on the relationship between fisheries economic growth and marine environmental pollution in China’s coastal regions. Science of the Total Environment, 713, e136641. https://doi.org/10.1016/j.scitotenv.2020.136641
- Pincheira, R., & Zuniga, F. (2021). Environmental Kuznets curve bibliographic map: A systematic literature review. Accounting and Finance, 61(S1), 1931–1956. https://doi.org/10.1111/acfi.12648
- Pomeroy, R., Parks, J., Mrakovcich, K., & LaMonica, C. (2016). Drivers and impacts of fisheries scarcity, competition, and conflict on maritime security. Marine Policy, 67(1), 94–104. https://doi.org/10.1016/j.marpol.2016.01.005
- Rafindadi, A., & Usman, O. (2021). Toward sustainable electricity consumption in Brazil: The role of economic growth, globalization and ecological footprint using a nonlinear ARDL approach. Journal of Environmental Planning and Management, 64(5), 905–929. https://doi.org/10.1080/09640568.2020.1791058
- Rahman, S., Chen, S., Saud, S., Saleem, N., & Bari, M. (2019). Nexus between financial development, energy consumption, income level, and ecological footprint in CEE countries: Do human capital and biocapacity matter? Environmental Science and Pollution Research, 26(31), 31856–31872. https://doi.org/10.1007/s11356-019-06343-z
- Rashdan, M., Faisal, F., Tursoy, T., & Pervaiz, R. (2021). Investigating the N-shape EKC using capture fisheries as a biodiversity indicator: Empirical evidence from selected 14 emerging countries. Environmental Science and Pollution Research, 28(27), 36344–36353. https://doi.org/10.1007/s11356-021-13156-6
- Sabir, S., & Gorus, M. (2019). The impact of globalization on ecological footprint: Empirical evidence from the South Asian countries. Environmental Science and Pollution Research, 26(32), 33387–33398. https://doi.org/10.1007/s11356-019-06458-3
- Saqib, M., & Benhmad, F. (2021). Updated meta-analysis of environmental Kuznets curve: Where do we stand? Environmental Impact Assessment Review, 86, e106503. https://doi.org/10.1016/j.eiar.2020.106503
- Sarkodie, S., & Strezov, V. (2019). A review on Environmental Kuznets curve hypothesis using bibliometric and meta-analysis. Science of the Total Environment, 649(1), 128–145. https://doi.org/10.1016/j.scitotenv.2018.08.276
- Shahzad, U., Fareed, Z., Shahzad, F., & Shahzad, K. (2021). Investigating the nexus between economic complexity, energy consumption and ecological footprint for the United States: New insights from quantile methods. Journal of Cleaner Production, 279, e123806. https://doi.org/10.1016/j.jclepro.2020.123806
- Sharif, A., Baris-Tuzemen, O., Uzuner, G., Ozturk, I., & Sinha, A. (2020). Revisiting the role or renewable and non-renewable energy consumption on Turkey’s ecological footprint: Evidence from quantile ARDL approach. Sustainable Cities and Society, 57, e102138. https://doi.org/10.1016/j.scs.2020.102138
- Sheeshka, J., & Murkin, E. (2002). Nutritional aspects of fish compared with other protein sources. Comments on Toxicology, 8(4–6), 375–397. https://doi.org/10.1080/08865140215065
- Shehzad, K., Zeraibi, A., & Zaman, U. (2022). Testing the N-shaped environmental Kuznets curve in Algeria: An imperious role of natural resources and economic globalization. Resource Policy, 77, e102700. https://doi.org/10.1016/j.resourpol.2022.102700
- Sugiawan, Y., Islam, M., & Managi, S. (2017). Global marine fisheries with economic growth. Economic Analysis and Policy, 55, 158–168. https://doi.org/10.1016/j.eap.2017.08.004
- Udemba, E. (2020). A sustainable study of economic growth and development amidst ecological footprint: New insight from Nigerian perspective. Science of the Total Environment, 732, e139270. https://doi.org/10.1016/j.scitotenv.2020.139270
- Ulucak, R., & Bilgili, F. (2018). A reinvestigation of EKC model by ecological footprint measurement for high, middle and low income countries. Journal of Cleaner Production, 188, 144–157. https://doi.org/10.1016/j.jclepro.2018.03.191
- Usman, M., Makhdum, M., & Kousar, R. (2021). Does financial inclusion, renewable and non-renewable energy utilization accelerate ecological footprints and economic growth? Fresh evidence from 15 highest emitting countries. Sustainable Cities and Society, 65, e102590. https://doi.org/10.1016/j.scs.2020.102590
- Wang, Y., Kang, L., Wu, X., & Xiao, Y. (2013). Estimating the environmental Kuznets curve for ecological footprint at the global level: A spatial econometric approach. Ecological Indicators, 34, 15–21. https://doi.org/10.1016/j.ecolind.2013.03.021
- Wang, Q., Wang, X., & Li, R. (2022). Does urbanization redefine the environmental Kuznets curve? An empirical analysis of 134 countries. Sustainable Cities and Society, 76, e103382. https://doi.org/10.1016/j.scs.2021.103382
- Yang, B., Jahanger, A., & Ali, M. (2021). Remittances inflows affect the ecological footprint in BICS countries: Do technological innovation and financial development matter? Environmental Science and Pollution Research, 28(18), 23482–23500. https://doi.org/10.1007/s11356-021-12400-3
- Zia, S., Rahman, M., Noor, M., Khan, M., Bibi, M., Godil, D., Quddoos, M., & Anser, M. (2021). Striving towards environmental sustainability: How natural resources, human capital, financial development, and, economic growth interact with ecological footprint in China. Environmental Science and Pollution Research, 28(37), 52499–52513. https://doi.org/10.1007/s11356-021-14342-2