
 ?Mathematical formulae have been encoded as MathML and are displayed in this HTML version using MathJax in order to improve their display. Uncheck the box to turn MathJax off. This feature requires Javascript. Click on a formula to zoom.
Abstract
This study examines the relationship between income inequality and economic growth in South Africa for the period 1989 to 2018. The study is motivated by the high disparity in income inequality and stagnant economic growth that South Africa is experiencing. Using the autoregressive distributed lag (ARDL) bounds testing technique, we established a long-run relationship between economic growth and income inequality. The results revealed that income inequality has a negative impact on economic growth in the long run, and no effect in the short run. These results are robust with an estimation of the ARDL procedure that considers structural breaks. Therefore, policymakers should employ strategies that entail a double effect of growth in national income and consider the distribution of income in the long run. These policies include human capital accumulation, easily accessible education, and reduction in labour market dualism.
PUBLIC INTEREST STATEMENT
South Africa has been ranked highest among the unequal countries globally; it has the highest Gini coefficient compared with other countries. Over the past few decades, it has experienced sluggish economic growth. Motivated by the high disparity in income inequality and stagnant economic growth, we investigate the relationship between income inequality and economic growth in South Africa from 1989-2018. Our findings show that income inequality has a negative impact on economic growth in the long run, but no impact in the short run. Therefore, policymakers should employ strategies that entail a double effect of growth in national income and consider the distribution of income in the long run. These policies include human capital accumulation, easily accessible education, and reduction in labour market dualism.
1. Introduction
This study examines the relationship between income inequality and economic growth in South Africa. Income inequality is a challenge for countries across the world. The gap between the rich and the poor continues to increase, irrespective of the level of economic growth and development (Dabla-Norris et al., Citation2015). Many reasons have been brought forward by researchers in favour of low income inequality. Existing literature has found that economies with high-income inequality have high rates of political and social instability (Barro, Citation2000; Keefer & Knack, Citation2000). In the presence of high-income inequality, strikes arise due to the dissatisfaction of the population and the implementation of poor policies that do not serve the interests of the entire population (Barro, Citation2000; Perotti, Citation1996). Furthermore, there tends to be corrupt behaviour, where the rich influence the law and distribution policies to increase their wealth at the expense of the poor. This leads to uncertainty that causes low domestic and foreign investor confidence and hence a fall in growth in the long run (Alesina & Perotti, Citation1996; Barro, Citation2000; Claessens & Perotti, Citation2007).
South Africa has the most income inequality in the world, with a Gini coefficient above 50 percent, which is considered a major policy challenge (World Bank, Citation2018a, Citation2018b). In South Africa, income inequality is a legacy of apartheidFootnote1 and it has been increasing since the advent of democracy, making it the most unequal country in the world (World Bank, Citation2019a, Citation2019b; Ntuli & Kwenda, Citation2013). As a result, it modelled the development of inequality-perpetuated economic growth causing a long lasting footprint of rising (income) inequality (Leibbrandt et al., Citation2012; Van der Berg, Citation2011). This left the country with unequal opportunities among the population, social instability, uncertainty, and undermines the reducing effect of growth on poverty reduction (Keefer and Knack, Citation2000; World Bank, Citation2012; World Bank, Citation2019a; Citation2019b).
Because of the potential impact of income inequality on economic growth, there has been a growing number of studies, which examined theoretically and empirically the relationship between income inequality and economic growth. Some empirical studies have shown that the effect of income inequality on economic growth can be positive (Forbes, Citation2000; Hailemariam et al., Citation2021; Li & Zou, Citation1998; Majeed, Citation2016; Partridge, Citation1997; Shahbaz, Citation2010), negative (Alesina & Rodrik, Citation1994; Braun et al., Citation2019; Perotti, Citation1996; Persson & Tabellini, Citation1994; Topuz, Citation2022), inconclusive (Barro, Citation2000, Castelló-Climent, 2010; Hailemariam & Dzhumashev, Citation2020; Ostry et al., 2014) or there can be no impact (Benos & Karagiannis, Citation2018; Niyimbanira, Citation2017). Additionally, some studies, such as Aghion et al. (Citation1998), Ahluwalia (Citation1976), Galor and Tsiddon (Citation1997), Helpman (Citation1997), Kuznets (Citation1955), and Robinson (Citation1976), found that income inequality varies along economic development stages and technological advancement.
There are various reasons as to why these studies found mixed results. The main reason is the lack of comparability of the data sets as some studies used expenditure data, while some used gross income data. Expenditure data is more equally distributed than gross income; these differences in the distribution of income may cause mixed findings (Atkinson and Brandolini, 2001; Knowles, Citation2005). Another reason is the different methodological procedures, which may result in different results. Early studies used cross-sectional data and employed ordinary least squares and two-stage least squares estimation techniques (Alesina & Rodrik, Citation1994; Perotti, Citation1996; Persson & Tabellini, Citation1994). Later studies shifted to the usage of panel data due to its benefit of estimating the effect of a change in a country’s level of inequality on growth in a specific country (Barro, Citation2000; Forbes, Citation2000; Li & Zou, Citation1998). However, studies that used panel data employed various estimation techniques such as fixed effects (FE), random effects (RE), and generalised methods of moments (GMM) with varying assumptions (Neves & Silva, Citation2014). In addition, the use of a panel study may result in the loss of country specific information due to grouping different countries together (Ho, Citation2018; Hsiao, Citation2005). Provided that the effect of inequality on growth differs across countries due to various country specific circumstances, the result may differ across the studies.
In this paper, we contribute to the inequality-growth debate by examining this relationship in an individual country, South Africa. We overcome the data limitation challenge by collecting data from various reliable sources such as Atkinson et al. (Citation2017), Quantec EasyData (Citation2022) and the Standardized World Income Inequality Database (SWIID) 9.2. Our study extends existing literature by using a time series technique that will allow us to examine the relationship at national level, so that we can identify the effects of income inequality on growth in a specific country. The technique allows us to examine both the short and long-run impact of income inequality and economic growth. Our main finding reveals that income inequality has a negative effect on economic growth in the long run, and has no impact in the short run. Our findings are consistent across the main estimation method and robustness check.
The remainder of the paper is arranged as follows: Section 2 provides an overview of development of income inequality and economic growth in South Africa. Section 3 presents a theoretical and empirical literature review on income inequality and economic growth. Sections 4 and 5 provide the methodology and an analysis of the empirical results, while Section 6 concludes.
2. Overview of income inequality and economic growth in South Africa
South Africa has been ranked highest among the unequal countries globally; it has the highest Gini coefficient compared to other countries (World Bank, Citation2019a, Citation2019b). The roots of inequality have been traced back to racial and wage inequality that characterised the country during the apartheid era, where benefits were distributed and classified according to racial groups. This resulted in economic growth that is not pro-poor and that cannot create sustainable job opportunities (World Bank, Citation2019a, Citation2019b; Ntuli & Kwenda, Citation2013). The existing literature noted that inequality is embedded in the structures of the economy because policies and structures of apartheid modelled a development of inequality perpetuated growth (Leibbrandt et al., Citation2012; Van der Berg, Citation2011). Hence, despite the post-apartheid policy interventions by the democratic government to reduce inequality, there is a long-term footprint of continuous rising inequality that is posing a challenge to reverse.
Owing to policy interventions such as the Reconstruction and Development Programme (RDP), Growth, Employment, and Redistribution (GEAR), Accelerated and Shared Growth Initiative for South Africa (ASGISA) and the National Development Plan (NDP) implemented since 1994 to reduce the income inequality gap, inequality has changed its nature (SAHO, Citation1994a, SAHO, Citation1994b). Income distribution between races has improved, while income inequality within race groups continues to worsen, especially among the black African population. The literature states that within racial groups, inequality is the root of the persistent increasing income inequality (Leibbrandt et al., Citation2000, Government Communication and Information System, Citation2010; Chapman, Citation2012). The cause of racial income inequality is attributed to the growth in the black middle-income class that is more than what the Black Economic Empowerment (BEE) policies can accommodate and the increasing unemployment within the race (Bhorat et al., Citation2009; Van der Berg, Citation2011).
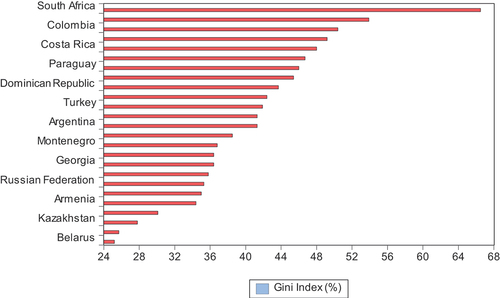
Figure displays the trends of income inequality and economic growth between 1989 and 2018. The data confirm that South Africa has the highest percentage of income inequality and sluggish economic growth. Figure shows that South Africa had more than a decade of increasing income inequality, which started from 1995 to 2005, where it reached a high percentage that exceeded 70 percent and has remained high. The increasing disparity could be attributed to skills mismatch (that results in an unnecessary shortage of skills), the labour market, and high unemployment (Landman et al., Citation2003; Leibbrandt & Woolard, Citation2001; Naudé & Coetzee, Citation2004; Ntuli & Kwenda, Citation2013). Economic growth, on the other hand, has been in a weak position. As shown in Figure , growth drastically fell between 1989 and 1992 reaching a −2.1 percent, after which it had a period of upswings and downswings until 2008 when the financial crisis began. From 2008 to 2018, the country experienced a decade of low and stagnant economic growth due to the economic sectors that were not growing at the same rate, and external and internal economic shocks that destabilised economic performance (World Bank, Citation2021). The economy of South Africa has faced numerous positive periods of growth and a few periods of low growth, as shown in Figure . Existing studies have documented that economic growth in South Africa depends on several sectors: finance, government, trade, manufacturing, transport and communication, mining, personal services, construction, electricity and agriculture (South African Embassy in the Netherlands, Citation2013; Brand South Africa, Citation2018). These are the sectors that drive the economy of the country. Over the years, South Africa has seen a shift in economic activity and drivers. Historically, South Africa’s economy has shifted from being driven by the agricultural sector during the 1990s to being driven by the tertiary sector during the 2000s. Today, it is focused on technological advancement activities (embracing the fourth industrial revolution era), e-commerce, and the financial sector (South African Embassy in the Netherlands, Citation2013). As shown in Figure , South Africa has been ranked the highest and most unequal country among the upper-middle-income countries globally (World Bank, Citation2022b).
Figure 1. Gini coefficient and growth rate of real GDP of South Africa for the period 1989 to 2018.
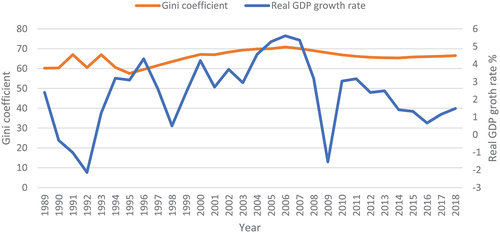
Figure 2. Gini index of upper-middle-income countries for 2018.
3. Literature review of income inequality and economic growth
Various theoretical studies have identified the transmission mechanisms in which income inequality is linked to economic growth. These mechanisms include economic development, technological development, social-political unrest, political economy, imperfection of credit markets, savings, and institutions.
An early study by Kuznets (Citation1955) explored the relationship between income inequality and growth through the level of the development stage of the economy. Kuznets found a differential link between income inequality and economic growth, with a positive impact and a negative impact during the early stages and later stages of economic development, respectively. As labour moves from the agricultural sector to other economic sectors, the per capita income of those individuals increases, and those left in the agricultural sector earn less income, widening the inequality gap. As the economy develops and individuals continue to move away from the agricultural sector, the low supply of labour will cause those who remain in the agricultural sector to earn a high income, reducing the income inequality.
Ahluwalia (Citation1976), Robinson (Citation1976), and Gupta and Singh (Citation1984) supported the above findings. Some studies have explored the relationship between income inequality and growth through the level of technology in the economy (Aghion et al., Citation1998; Galor & Tsiddon, Citation1997; Helpman, Citation1997). They argue that, at the early stages of technological development, income inequality tends to increase, because new technology requires highly skilled labour, causing an unnecessary shortage of skills by increasing income for those working in the developed sector. As the economy grows and develops, income inequality decreases because more labour moves to the technologically advanced sector. Those who remain in the sector with old technology will earn a high income due to the decrease in the supply of labour in the sector.
Some studies model the income inequality-growth relationship from the social and political perspective. They found that high-income inequality negatively affects growth through social-political unrest. This is because economies with high inequality have high levels of disturbing behaviour, such as criminal activities, strikes and other unproductive activities that lead to wastage of government resources and political instability (Barro, Citation2000; Benhabib & Rustichini, Citation1996; Venieris & Gupta, Citation1986). In contrast, some studies have demonstrated that an increase in social and political unrest can lead to the promotion of fair income distribution. To reduce the number of riots, politicians welcome redistribution—from the rich to the poor—in a transfer of payments. It will restore the people’s trust in government, and improve investment, thereby enhancing growth in the long run (Barro, Citation2000; Benhabib & Rustichini, Citation1996; Venieris & Gupta, Citation1986). In the political economy studies, high-income inequality may constrain growth (Alesina & Rodrik, Citation1994; Barro, Citation2000; Perotti, Citation1993). These models show that if the mean income is more than that of the median voter, citizens will engage in riots and other disruptive behaviour demanding redistribution from the rich to the poor. Such disruptive behaviour causes people to lose confidence in the government and its law, and hence lower growth in the long run (Banerjee & Duflo, Citation2003; Panizza, Citation2002; Perotti, Citation1993; Persson & Tabellini, Citation1994).
From a financial perspective, the models of imperfect credit markets show that high-income inequality adversely affects growth through the credit markets (Aghion & Bolton, Citation1992; Banerjee & Newman, Citation1993; Galor & Zeira, Citation1993; Panizza, Citation2002; Piketty, Citation1997). In the presence of credit market imperfection, the problem of asymmetric information will lead to high-income inequality and limit the poor from accessing credit. Laws that protect the borrower make creditors put stricter measures to acquire loans and this will limit access to credit for the poor. Given that investment in human capital (education and skills training) or property depends on the income and assets an individual has, the poor who have limited income cannot afford these investment opportunities. Therefore, high-income inequality limits investment opportunities for some individuals and leads to low economic growth eventually. Additionally, some studies show that savings rates cause income inequality to positively affect economic growth (Aghion et al., Citation1999; Barro, Citation2000; Bourguignon, Citation1981), suggesting that savings are directly proportional to an income. Therefore, with high-income inequality, rich people who earn high incomes save more, as a result, aggregate savings, and capital accumulation increases, which then leads to improved growth rates in the long run (Aghion et al., Citation1999; Bourguignon, Citation1981; Mirrlees, Citation1971; Rebelo, Citation1991).
Existing studies also showed that income inequality constrains growth through institutions (Chong & Gradstein, Citation2007; Hoff & Stiglitz, Citation2004; Sonin, Citation2003). This is because institutions drive economic growth and development, which enhances the well-being of a country (Smith, Citation1776; Acemoglu et al., Citation2005; Weil, Citation2008). Therefore, the quality of institutions is crucial for redistribution and growth. High-income inequality promotes the existence of poor institutions, which results in high levels of inefficiency, wastage of resources and funds, social dissatisfaction, and political instability due to the political decisions that favour the rich at the expense of the poor. This will exacerbate income inequality and constrain growth in the long run (Hoff & Stiglitz, Citation2004; Sonin, Citation2003). Following this argument, poor quality institutions are associated with high inequality, inefficiency, and low growth, while high quality institutions are associated with low inequality, efficiency, and hence economic growth.
The theoretical literature on the relationship between income inequality and growth proved to be inconclusive. The empirical literature also found diverse results concerning the relationship between these two variables. Many studies found a negative relationship between income inequality and economic growth (Alesina & Rodrik, Citation1994; Braun et al., Citation2019; Breunig & Majeed, Citation2020; Knowles, Citation2005; Perotti, Citation1996; Topuz, Citation2022). In contrast, some scholars such as Partridge (Citation1997), Da Silva (Citation2020), Forbes (Citation2000), Hailemariam et al. (Citation2021), Li and Zou (Citation1998), Majeed (Citation2016), Partridge (Citation1997), and Scholl and Klasen (Citation2019) found a positive relationship.. While some studies found inconclusive results on the relationship (see, for example, Barro, Citation2000; Brueckner & Lederman, Citation2018; Deininger & Squire, Citation1998; Hailemariam & Dzhumashev, Citation2020), a few studies found no link between income inequality and growth (Benos & Karagiannis, Citation2018; Niyimbanira, Citation2017). Table summarises the empirical studies on the relationship between income inequality and economic growth.
Table 1. Summary of empirical studies on the relationship between income inequality and economic growth
4. Methods
4.1. Sources of data
The study uses annual time series data from 1989 to 2018. The length of the study is based on the availability of data. We obtained the data from the World Development Indicators (World Bank) (Citation2022a), Quantec EasyData (Citation2022), Penn World Table 10.0 (Citation2022), Chartbook of Economic Inequality by Atkinson et al. (Citation2017) and Standardized World Income Inequality Database (SWIID) 9.2 by Solt (Citation2019).
4.2. Definition of the variables
4.2.1. Economic growth (Y)
The study includes the growth rate of real Gross Domestic Product (GDP) (annual percentage) as the dependent variable to denote the year-on-year changes of the GDP. The growth rate of real GDP is used as a proxy for economic growth.
The main explanatory variable is the Gini coefficient. As informed by the literature, we also include other variables such as human capital, labour, capital stock, and government expenditure as control variables.
4.2.2. Gini coefficient (GINI)
This variable measures disparities in the distribution of income. The distribution varies between 0 = perfect equality and 1 = perfect inequality. The Gini coefficient is used as a proxy for income inequality.
4.2.3. Human capital (HC)
This variable documents the skills, knowledge, and experience of individuals and has a significant impact on economic growth (Nelson and Phelps, 1966; Barro, Citation1991; Castelló and Doménech, 2002). Studies show that human capital improves productivity and competitiveness, thus improving economic growth (Lopez et al., 1998; Fedderke and Simkins, 2009). We use the human capital index to proxy for human capital.
4.2.4. Labour (POP)
Following studies by Temple and Wöβmann (Citation2006), Rajan and Zingales (Citation2008), Moral Benito (Citation2012), and Iyke and Ho (Citation2017), this study uses population growth to measure labour. Population growth has a significant impact on economic growth since a faster growth of population relative to national income will burden society and limit the availability of capital per head. It then reduces labour productivity, reducing economic growth in the long run (Mankiw, Citation2009; Mankiw et al., Citation1992; Solow, Citation1956).
4.2.5. Capital stock (K)
Capital stock is used to measure physical capital, which includes the machines, equipment, and other inventories used in production processes. Existing studies indicate that investing in capital is key to achieving growth in per capita output, which enhances growth in the long run (Mankiw et al., Citation1992; Long and Summers, Citation1991, Citation1993).
4.2.6. Government expenditure (GOVT)
Government expenditure is measured by general government final consumption expenditure, which includes expenses by government to meet the needs of the citizens. These include government transfers, the provision of education and health facilities, and safety and security. The literature documents that government spending plays a significant role in stabilising and growing the economy (Keynes, 1936). Furthermore, government spending is a function of national income; however, it adversely affects the economy in the long run (Barro, Citation2003).
4.3. Unit root testing
The study employed the Augmented Dickey Fuller Test (ADF), Perron Test (1997) and Zivot-Andrews Test (1992) for unit root testing. First, the test is conducted to observe the stationary properties of the time series in the presence of structural breaks. Second, it is to see if the variables meet the requirements of the ARDL model, which specify that variables should be integrated of order zero or one, or a mix of both and not be integrated of order two.
4.4. The Autoregressive Distributed Lag (ARDL) test for cointegration
Following the stationary test, the study employs the autoregressive distributed lag (ARDL) bounds testing technique proposed by M. H. Pesaran and Shin (Citation1999) and M. H. Pesaran et al. (Citation2001) to investigate the long-run association between income inequality and economic growth in South Africa. The study prefers to use this technique because the ARDL test can be used even if the variables combine the order of integration zero or one. Additionally, the technique can be applied to a small sample size. The ARDL equation is specified as follows:
where lnGINI, lnHC, lnPOP, lnK, lnGOVT are the logarithms of the variables. For Y, the study does not take the natural logarithm as a result of the number of negative observations during the study period. ρ, α, n, μ are the short-term coefficient, long-run coefficient, number of lags and the error term, respectively. Additionally, t and ∆ are the period and difference operator. The study bases the number of optimal lags on the Akaike Information Criterion (AIC).
First, the study tests whether the variables have a long-run relationship. That is, the null hypothesis of no cointegration given by is tested against the alternative hypothesis of cointegration given by
. Second, to accept or reject the null hypothesis, we consider the F-statistic that is compared with the two critical values proposed by M. H. Pesaran et al. (Citation2001), and B. Pesaran and Pesaran (Citation2009). These are assumed to be integrated into either order zero or one. When the F-statistic is less than the lower bound, the null hypothesis cannot be rejected. However, when the F-statistic is higher than the upper bound, the null hypothesis is rejected. If the F-statistic is between the lower and the upper bound, the results are inconclusive.
If the variables are cointegrated, we proceed to estimate the error correction model (ECM) using the following equation:
where , φ and ∆ are the short-run coefficients, the coefficient that captures the long-run variations, and the difference operator, respectively. ECM and
are the error correction term and the residual error term, respectively. The sign of the φ is expected to be negative. This coefficient measures the speed with which the variables can adjust back to long-run equilibrium.
5. Results and analysis
5.1. Stationarity test results
The study employed the ADF Test, Perron Test (1997) and Zivot-Andrews Test (1992) to test the stationarity of the observations in the presence of structural breaks. Table presents the results.
Table 2. Stationarity of the variables
Table shows that Y, lnHC and lnGOVT are stationary at the first difference, while lnGINI is stationary both at level and at first difference. For lnK and lnPOP, the variables are stationary at level. When provided with the stationarity results—where the variables are integrated of either order zero or one, and a mixture of order zero and one—the ARDL bounds testing technique can be applied.
5.2. Findings of Autoregressive Distributed Lag (ARDL): bounds testing approach to cointegration
Having found that the order of integration of the variables is zero and one, we proceed to test for cointegration between the variables using the ARDL bounds technique as proposed by M. H. Pesaran et al. (Citation1996, Citation2001), and M. H. Pesaran and Shin (Citation1999). Table provides the results of the ARDL bounds test approach for cointegration. The study estimates two equations. First, the study estimates an ARDL equation without structural breaks. Second, the study estimates an ARDL equation with the presence of structural breaks as a robustness check. The equation includes a dummy variable to capture structural breaks in Y.
Table 3. ARDL bounds test for cointegration results without structural breaks
As shown in Table , the F-statistic is 9.992, while the critical values of the lower and upper bounds are 2.26 and 3.79, respectively, at 5% level of significance. These results show that Y, lnGINI, lnHC, lnPOP, lnK and lnGOVT have a long-run relationship. Therefore, the null hypothesis is rejected because the F-statistic is higher than the lower and upper bounds. Now that the long-run relationship is established between the variables, the study proceeds to estimate the regression model using the ARDL technique. The optimal lag lengths for the study as determined by Akaike Information Criterion (AIC) are (3, 2, 2, 2, 2, 2) for Y, lnGINI, lnHC, lnPOP, lnK and lnGOVT, respectively. Table shows the estimation results of the long run and short run.
Table 4. Long-run and short-run estimation results of the model without structural breaks
Table presents estimation results showing that lnGINI, lnPOP, lnK and lnGOVT are statistically significant and negatively affect economic growth in the long run. In contrast, lnHC is statistically significant and positively affects economic growth in the long run. Regarding the Gini coefficient, the results show that as income inequality increases, economic growth falls in the long run, similar to the findings of Alesina and Rodrik (Citation1994), Perotti (Citation1996), Malinen (Citation2008), Iyke and Ho (Citation2017), Royuela et al. (Citation2019), Breunig and Majeed (Citation2020) and Topuz (Citation2022). This is because high-income inequality limits education opportunities for the poor. It results in a lack of investment in education, lack of social mobility, and hinders the development of skills. Furthermore, it increases the number of people who are unable to invest in human capital, and as a result, the productivity of labour becomes lower than expected (Cingano, Citation2014; Dabla-Norris et al., Citation2015). Additionally, high-income inequality results in high crime rates, poor health services and political instability. This is because high rates of crime create uncertainty and inefficiency, and affect the competitiveness of businesses. In turn, this lowers domestic and foreign direct investments (FDI) and causes the loss of trust in government leadership, which negatively affects the performance of the economy in the long run (Dabla-Norris et al., Citation2015; Fajnzlber et al., Citation2002; Goulas & Zervoyianni, Citation2013; Keefer & Knack, Citation2000; Philip et al., Citation2014).
Furthermore, high-income inequality hinders poverty reduction (Niyimbanira, Citation2017). It causes the population to be vulnerable and exposed to poverty as the effect of economic growth on poverty reduction is undermined (Van der Berg, Citation2010; Dabla-Norris et al., Citation2015; World Bank, Citation2019a, Citation2019b). South Africa struggles with extreme income inequality manifested through unfair income distribution, unequal opportunities and disparities across the regions. As a result, the country experiences low economic growth in the long run that is not pro-poor.
Regarding the relationship between human capital and growth, the study confirmed a positive relationship. These finds are in line with existing literature (see, for example, Grossman & Helpman, Citation1991; Lucas, Citation1988; Pelinescu, Citation2015; Romer, Citation1986, Citation1990; Seo et al., Citation2020). The results for physical capital are interesting, yet unexpected, showing a negative impact on economic growth in the case of South Africa. These findings are in contrast to what has been advocated and found by theoretical and empirical literature by De Long and Summers (Citation1991); De Long and Summers (Citation1993); Mankiw et al. (Citation1992); Mirestean and Tsangarides (Citation2016); and Iyke and Ho (Citation2017), which show that physical capital improves economic growth. In South Africa, we argue that the increase in physical capital must be accompanied by an increased level of the knowledge and skills that equip the labour force with the capabilities to efficiently use this capital. Otherwise, the available capital will be underutilised and, as a consequence, maximum output will not be achieved due to low productivity (Fedderke, Citation2005). Concerning population growth, the findings showed that the variable negatively affects growth in the long run, consistent with the strand of literature and recent findings (Breunig & Majeed, Citation2020; Iyke & Ho, Citation2017; Mankiw, Citation2009; Mankiw et al., Citation1992; Solow, Citation1956). In the case of government expenditure, the results show a negative impact on economic growth in the long run in South Africa. This supports the findings of existing literature and recent studies by Landau (Citation1985), Barro (Citation2003), Bergh and Bjørnskov (Citation2020), and Haini and Loon (Citation2022), which find that government expenditure affects economic growth negatively. This may be plausible because to finance spending, government will impose high taxes on citizens. Second, government might implement projects in which the private sector would be more productive than the public sector, thereby causing low productivity, and hence low economic growth in the long run.
The short-run results document that income inequality does not affect economic growth, while human capital, population growth and government expenditure negatively affect growth. For human capital, it may be because in the short run, the population is still acquiring the necessary skills and knowledge, and its effect on growth will not be seen in the short run. Additionally, physical capital positively affects growth in the short run. Furthermore, the error term coefficient is negative and statistically significant, which implies that when the variables deviate from the equilibrium, they adjust back at a pace of 2.34 percent.
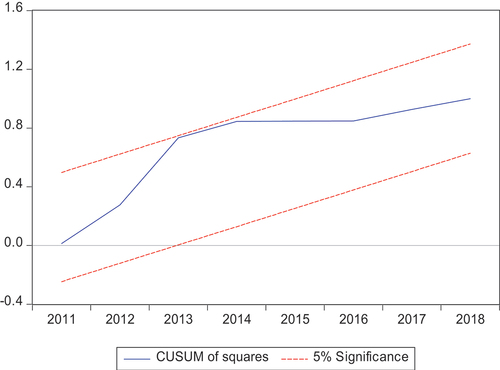
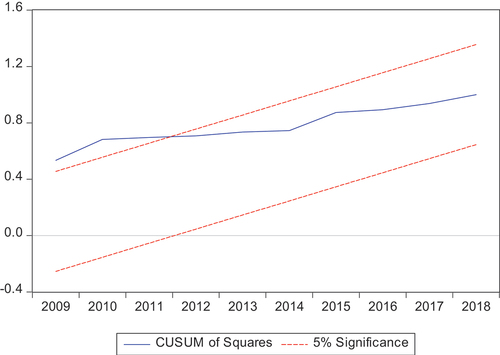
The results show that the data fit the model with an adjusted R- squared of 91 percent. The model passed the diagnostic tests for heteroskedasticity, functionality form and normality. The plots of the estimated cumulative sum of recursive residuals (CUSUM) and the plot of the cumulative sum of squares of recursive residuals (CUMSUMSQ) of the model indicate that the long-run coefficients are stable. The CUSUM and CUSUMSQ lines are between the two lines of the 5% level of significance shown in Figures .
Figure 3. The plot of the cumulative sum of the recursive residuals.
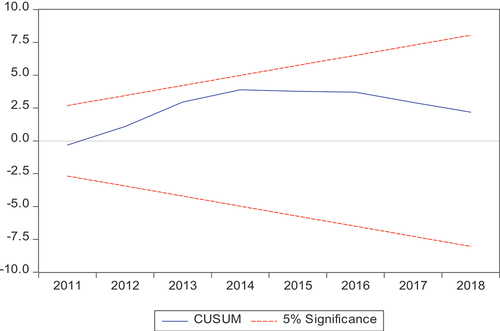
Figure 4. The plot of the cumulative sum of squares of recursive residuals.
5.3. Robustness check
In this section, the study explores the impact of income inequality on economic growth, taking into consideration the effect of structural breaks in the model. Given that South Africa is an open economy, it is sensitive to global economic conditions that may affect the economy negatively or positively. Between 1989 and 2018, major structural shifts and economic conditions—such as post-apartheid economic reforms and the global financial crisis—occurred, resulting in shocks to the economy (SAHO, 1994; Bhorat et al., Citation2020). Having found that the variables are stationary as shown in Table , the study estimates the following ARDL equation, which includes a dummy variable (), to capture the presence of structural breaks in Y.
The Perron Test (1997) and Zivot-Andrews Test (1992) identified the structural breaks in 2005, 2008, 2009 and 2010 for Y. The dummy variable will take one for years with structural breaks and zero for years without structural breaks.
The F-statistics is 14.434, which is significant at 1 percent and higher than the lower and upper bounds reported in Table above. These results show that the variables have a long-run relationship. Then we proceed to estimate the regression model using the ARDL technique. The optimal lag lengths for the study as determined by the AIC are (2, 2, 2, 2, 2, 1) for Y, lnGINI, lnHC, lnPOP, lnK and lnGOVT, respectively. Table presents estimated results of the ARDL model with structural breaks.
Table 5. Long-run and short-run results with structural breaks
Similar to the main findings, Table presents estimation results showing that, in the presence of structural breaks, lnGINI, lnPOP, lnK and lnGOVT are statistically significant and have a negative impact on growth in the long run. In contrast, lnHC is statistically significant and has a positive impact on growth in the long run. The short-run results are also similar to the main findings that income inequality has no effect on growth, while population growth, physical capital and government spending negatively affect growth in the short run. The main difference is that human capital has no effect on growth in the short run. The results show that the data fit the model with an adjusted R- squared of 88 percent. The model passed the diagnostic tests for heteroskedasticity, functionality form and normality. The CUSUM line is between the two lines of 5 percent level of significance as shown in Figure . The CUSUMSQ showed some instability, however, it returned between the two lines of the 5% level of significance in the long run as shown in Figure . Based on the above considerations, it is evident that the main results are reliable compared with the ones that accounted for the structural breaks.
Figure 5. The plot of the cumulative sum of the recursive residuals with structural breaks.
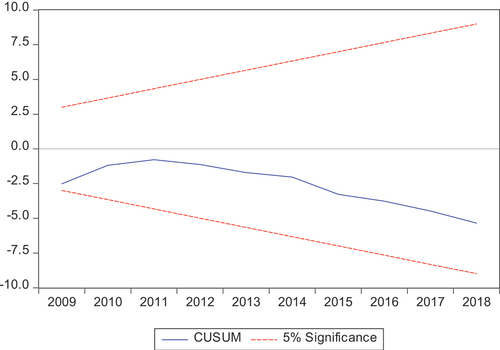
Figure 6. The Plot of the cumulative sum of squares of recursive residuals with structural breaks.
6. Conclusion
This study examined the association between income inequality and economic growth in South Africa from 1989 to 2018. Using the ARDL bounds testing technique, we found that an increase in income inequality has a significant negative impact on economic growth in the long run. In the short run income inequality has no effect on economic growth. Additionally, human capital positively affects economic growth, whereas capital stock, population growth, and government consumption inversely affect economic growth. Therefore, we recommend that policymakers pursue the implementation of policies that will not only focus on boosting the economy, but also encourage the distribution of income. According to International Monetary Fund (IMF) (Citation2020), South Africa’s income inequality persistently increases through a skewed distribution of income, unequal opportunities, high unemployment and low economic growth. Additionally, due to South Africa being a dual economy, some parts of the country are well developed, while most of the country is underdeveloped. Such development issues perpetuate social and income inequality. Thus, we recommend that social investment policies such as improved quality of health, access to services (water, electricity and sewerage, among others), and easy access to quality education be pursued to support the previously disadvantaged (Organisation for Economic Co-operation and Development (OECD), 2012; IMF 2020).
Moreover, other policies such as good governance, reduced costs of running a business, improved open market competitiveness, compensation of workers for skills and productivity, and improved state-owned enterprise efficiency, may encourage inclusive growth through human capital accumulation and reduce income inequality (OECD, Citation2012; IMF, Citation2020). Additionally, the high heterogeneity in the level of education and skills in the labour market increases income inequality. Policies such as educational coaching in the workplace will reduce this heterogeneity, which in turn will reduce income inequality in the labour market. Future studies could empirically investigate the role of the labour market in both income inequality and economic growth.
Disclosure statement
No potential conflict of interest was reported by the author(s).
Additional information
Funding
Notes on contributors
Kholeka Mdingi
Kholeka Mdingi is a lecturer at the Department of Economics, University of South Africa. She has an interest in the research field of development economics.
Sin-Yu Ho
Sin-Yu Ho is an associate professor in the Department of Economics, University of South Africa. Her research focuses on topics relating to development finance, financial economics, development economics and international economics in emerging markets and developing countries.
Notes
1. Apartheid is a system that discriminated against the population based on race. In South Africa it was introduced in 1948 by the National Party, where the government implemented policies and laws that forced different race groups to live and develop separately, with unequal opportunities in education and employment (South African History Online (SAHO), 1994).
References
- Acemoglu, D., Johnson, S., & Robinson, J. (2005). Institutions as a fundamental cause of long-run growth. In A. Aghion & S. N. Durlauf, Eds. Handbook of economic growth (Vol. 1). Elsevier. (pp. 385–21). https://doi.org/10.1016/S1574-0684(05)01006-3
- Aghion, P., & Bolton, P. (1992). An incomplete contracts approach to financial contracting. The Review of Economic Studies, 59(3), 473–494. https://doi.org/10.2307/2297860
- Aghion, P., Caroli, E., & García-Peñalosa, C. (1999). Inequality and economic growth: The perspective of the new growth theories. Journal of Economic Literature, 37(4), 1615–1660. https://doi.org/10.1257/jel.37.4.1615
- Aghion, P., Howitt, P., & Violante, G. (1998). Technology, knowledge and inequality. Mimeo, University College London.
- Ahluwalia, M. S. (1976). Inequality, poverty and development. Journal of Development Economics, 3(4), 307–342. https://doi.org/10.1016/0304-3878(76)90027-4
- Alesina, A., & Perotti, R. 1996. Income distribution, political instability and investment. National Bureau of Economic Research, working paper no. 4486.
- Alesina, A., & Rodrik, D. (1994). Distributive politics and economic growth. Quarterly Journal of Economics, 109(2), 465–490. https://doi.org/10.2307/2118470
- Atkinson, A. B., Hasell, J., Morelli, S., & Roser, M. (2017). Chartbook of economic inequality. Retrieved May 10, 2020. www.chartbookofeconomicinequality.com/.
- Banerjee, A. V., & Duflo, E. (2003). Inequality and growth: What can the data say? Journal of Economic Growth, 8(3), 267–299. https://doi.org/10.1023/A:1026205114860
- Banerjee, A. V., & Newman, A. F. (1993). Occupational choice and the process of development. Journal of Political Economy, 101(2), 274–298. https://doi.org/10.1086/261876
- Barro, R. J. (2000). Inequality and growth in a panel of countries. Journal of Economic Growth, 5(1), 5–32. https://doi.org/10.1023/A:1009850119329
- Barro, R. J. (2003). Determinants of economic growth in a panel of countries. Annals of Economics and Finance, 4(2), 231–274.
- Benhabib, J., & Rustichini, A. (1996). Social conflict and growth. Journal of Economic Growth, 1(1), 125–142. https://doi.org/10.1007/BF00163345
- Benos, N., & Karagiannis, S. (2018). Inequality and growth in the United States: Why physical and human capital matter. Economic Inquiry, 56(1), 572–619. https://doi.org/10.1111/ecin.12475
- Bergh, A., & Bjørnskov, C. (2020). Does big government hurt growth less in high-trust countries? Contemporary Economic Policy, 38(4), 643–658. https://doi.org/10.1111/coep.12467
- Besarria, C. N., Araujo, J. M., Da Silva, A. F., Sobral, E. F. M., & Pereira, T. G. (2018). Effects of income inequality on the economic growth of Brazilian states: An analysis using the cointegrated panel model. International Journal of Social Economics, 45(3), 548–563. https://doi.org/10.1108/IJSE-02-2017-0039
- Bhorat, H., Lilenstein, K., Oosthuizen, K., & Thornton, A. 2020. Structural transformation, inequality, and inclusive growth in South Africa. WIDER working paper, No. 2020/50. Helsinki: The United Nations University World Institute for Development Economics Research (UNU-WIDER).
- Bhorat, H., Van der Westhuizen, C., & Jacobs, T. 2009. Income and non-income inequality in post-apartheid South Africa: What are the drivers and possible policy interventions? DPRU Working Paper, (09/138). Development Policy Research Unit.
- Bourguignon, F. (1981). Pareto superiority of unegalitarian equilibria in Stiglitz’s model of wealth distribution with convex saving function. Econometrica: Journal of the Econometric Society, 49(6), 1469–1475. https://doi.org/10.2307/1911412
- Brand South Africa. (2018). South Africa’s key economic sectors, 02 January. Retrieved July 26, 2019. https://www.brandsouthafrica.com/investments-immigration/business/investing/economic-sectors-agricultural.
- Braun, M., Parro, F., & Valenzuela, P. (2019). Does finance alter the relation between inequality and growth? Economic Inquiry, 57(1), 410–428. https://doi.org/10.1111/ecin.12581
- Breunig, R., & Majeed, O. (2020). Inequality, poverty, and growth. International Economics, 161(C), 83–99. https://doi.org/10.1016/j.inteco.2019.11.005
- Brueckner, M., & Lederman, D. (2018). Inequality and economic growth: The role of initial income. Journal of Economic Growth, 23(3), 341–366. https://doi.org/10.1007/s10887-018-9156-4
- Chapman, G. S. 2012. The problem of income inequality in South Africa. Conference. Retrieved October 30, 2019. https://mandelainitiative.org.za/conference-2012-papers.html.
- Chong, A., & Gradstein, M. (2007). Inequality and institutions. The Review of Economics and Statistics, 89(3), 454–465. https://doi.org/10.1162/rest.89.3.454
- Cingano, F. 2014. Trends in income inequality and its impact on economic growth. OECD social, employment and migration working paper no. 163. OECD.
- Claessens, S., & Perotti, E. (2007). Finance and inequality: Channels and evidence. Journal of Comparative Economics, 35(4), 748–773. https://doi.org/10.1016/j.jce.2007.07.002
- Dabla-Norris, E., Kochhar, K., Ricka, F., Suphaphiphat, N., & Tsounta, E. 2015. Causes and consequences of income inequality: A global perspective. International Monetary Fund, 2015(13), 1–39. https://doi.org/10.5089/9781513555188.006
- Da Silva, M. E. A. (2020). Does inequality benefit growth? New evidence using a panel VAR approach. International Journal of Development Issues, 19(1), 63–76. https://doi.org/10.1108/IJDI-05-2019-0088
- Deininger, K., & Squire, L. (1998). New ways of looking at old issues: Inequality and growth. Journal of Development Economics, 57(2), 259–287. https://doi.org/10.1016/S0304-3878(98)00099-6
- De Long, J. B., & Summers, L. H. (1991). Equipment investment and economic growth. Quarterly Journal of Economics, 106(2), 445–502. https://doi.org/10.2307/2937944
- De Long, J. B., & Summers, L. H. (1993). How strongly do developing countries benefit from equipment investment? Journal of Monetary Economics, 32(3), 395–415. https://doi.org/10.1016/0304-3932(93)90024-A
- Fajnzlber, P., Lederman, D., & Loayza, N. (2002). Inequality and violent crime. Journal of Law & Economics, 45(1), 1–39. https://doi.org/10.1086/338347
- Fedderke, J. (2005). South Africa: Sources and constraints of long-term growth, 1970-2000. African Region Working Paper Series, 94(1), 1–54. http://documents.worldbank.org/curated/en/804921468101078347/South-Africa-sources-and-constraints-of-long-term-growth-1970-2000
- Forbes, K. (2000). A reassessment of the relationship between inequality and growth. The American Economic Review, 90(4), 869–887. https://doi.org/10.1257/aer.90.4.869
- Galor, O., & Tsiddon, D. (1997). Technological progress, mobility and economic growth. The American Economic Review, 87(3), 363–382.
- Galor, O., & Zeira, J. (1993). Income distribution and macroeconomics. The Review of Economic Studies, 60(1), 35–52. https://doi.org/10.2307/2297811
- Goulas, E., & Zervoyianni, A. (2013). Economic growth and crime: Does uncertainty matter? Applied Economics Letters, 20(5), 420–427. https://doi.org/10.1080/13504851.2012.709596
- Government Communication and Information System (GCIS). (2010). South African Government Plan for 5 Million New Jobs to Cut Unemployment to 15%. Published by GCIS on 26 October. 2010. accessed 24 May 2020. http://www.thepresidency.gov.za/.
- Grossman, G., & Helpman, E. (1991). Innovation and growth in the global economy. MIT Press.
- Gupta, G. S., & Singh, R. D. (1984). Income inequality across nations over time – how much and why? Southern Economics Journal, 51(1), 250–277. https://doi.org/10.2307/1058336
- Hailemariam, A., & Dzhumashev, R. (2020). Income inequality and economic growth: Heterogeneity and nonlinearity. Studies in Nonlinear Dynamics & Econometrics, 24(3), 1–33. https://doi.org/10.1515/snde-2018-0084
- Hailemariam, A., Sakutukwa, T., & Dzhumashev, R. (2021). Long-term determinants of income inequality: Evidence from panel data over 1870-2016. Empirical Economics, 61(4), 1935–1958. https://doi.org/10.1007/s00181-020-01956-7
- Haini, H., & Loon, P. W. (2022). Examining the impact of government spending on the finance-growth nexus: Evidence from post-communist economies. Post-Communist Economies, 34(6), 756–778. https://doi.org/10.1080/14631377.2021.2006491
- Helpman, E. (1997). General purpose technologies and economic growth. MIT Press.
- Ho, S.-Y. (2018). Macroeconomic determinants of stock market development in South Africa. International Journal of Emerging Markets, 14(2), 322–342. https://doi.org/10.1108/IJoEM-09-2017-0341
- Hoff, K., & Stiglitz, J. E. (2004). After the big bang? Obstacles to the emergence of the rule of law in post-communist societies. The American Economic Review, 94(3), 753–763. https://doi.org/10.1257/0002828041464533
- Hsiao, C. (2005). Why panel data? The Singapore Economic Review, 50(2), 143–154. https://doi.org/10.1142/S0217590805001937
- International Monetary Fund. (2020). Six charts explain South Africa’s inequality. IMF country focus. Retrieved May 7, 2022. https://www.imf.org/en/News/Articles/2020/01/29/na012820six-charts-on-south-africas-persistent-and-multi-faceted-inequality.
- Iyke, B. N., & Ho, S.-Y. (2017). Income inequality and growth: New insights from Italy. Economia Internazionale/International Economics, 70(4), 419–442.
- Keefer, P., & Knack, S. 2000. Polarisation, politics and property rights: Links between inequality and growth. Policy Research Working Papers, 2418. Development Research Group, Regulation and Competition Policy. World Bank,
- Knowles, S. (2005). Inequality and economic growth: The empirical relationship is reconsidered in the light of comparable data. The Journal of Development Studies, 41(1), 135–159. https://doi.org/10.1080/0022038042000276590
- Kuznets, S. (1955). Economic growth and income inequality. The American Economic Review, 45(1), 1–28.
- Landau, D. L. (1985). Government expenditure and economic growth in the developed countries: 1952-1976. Public Choice, 47(3), 459–477. https://doi.org/10.1007/BF00182148
- Landman, J. P., Bhorat, H., Van der Berg, S., & Van Aardt, C. (2003, December). Breaking the grip of poverty and inequality in South Africa 2004-2014 Current trends, issues and future policy options. EFSA Institute.
- Leibbrandt, M., Finn, A., & Woolard, I. (2012). Describing and decomposing post-apartheid income inequality in South Africa. Development Southern Africa, 29(1), 19–34. https://doi.org/10.1080/0376835X.2012.645639
- Leibbrandt, M., & Woolard, I. (2001). The labour market and household income inequality in South Africa: Existing evidence and new panel data. Journal of International Development, 13(6), 671–689. https://doi.org/10.1002/jid.806
- Leibbrandt, M., Woolard, I., & Bhorat, H. (2000). Understanding contemporary household inequality in South Africa. Journal for Studies in Economic and Econometrics, 24(3), 31–51. https://doi.org/10.1080/03796205.2000.12129275
- Li, H., & Zou, H. (1998). Income inequality is not harmful for growth: Theory and evidence. Review of Development Economics, 2(3), 318–334. https://doi.org/10.1111/1467-9361.00045
- Lucas, R. (1988). On the mechanics of economic development. Journal of Monetary Economics, 22(1), 3–42. https://doi.org/10.1016/0304-3932(88)90168-7
- Majeed, M. T. (2016). Economic growth and income inequality nexus: An empirical analysis for Pakistan. Kashmir Economic Review, 25(1), 1–12.
- Malinen, T. 2008. Estimating the long-run relationship between income inequality and economic development. Discussion paper no. 634, University of Helsinki,
- Mankiw, N. G. (2009). Macroeconomics (7th ed.). Worth Publishers.
- Mankiw, N. G., Romer, D., & Weil, D. N. (1992). A contribution to the empirics of economic growth. Quarterly Journal of Economics, 107(2), 407–437. https://doi.org/10.2307/2118477
- Mdingi, K., & Ho, S.-Y. (2021). Literature review on income inequality and economic growth. MethodsX, 8, 1–12. https://doi.org/10.1016/j.mex.2021.101402
- Mirestean, A., & Tsangarides, C. G. (2016). Growth determinants revisited using limited‐information Bayesian model averaging. Journal of Applied Econometrics, 31(1), 106–132. https://doi.org/10.1002/jae.2472
- Mirrlees, J. A. (1971). An exploration in the theory of optimum income taxation. Oxford Journals, 38(2), 175–208. https://doi.org/10.2307/2296779
- Moral Benito, E. (2012). Determinants of economic growth: A Bayesian panel data approach. The Review of Economics and Statistics, 94(2), 566–579. https://doi.org/10.1162/REST_a_00154
- Naudé, W., & Coetzee, R. (2004). Globalisation and inequality in South Africa: Modelling the labour market transmission. Journal of Policy Modelling, 26(8–9), 911–925. https://doi.org/10.1016/j.jpolmod.2004.07.002
- Neves, P. C., & Silva, S. M. T. (2014). Inequality and growth: Uncovering the main conclusions from the empirics. The Journal of Development Studies, 50(1), 1–21. https://doi.org/10.1080/00220388.2013.841885
- Niyimbanira, F. (2017). Analysis of the impact of economic growth on income inequality and poverty in South Africa: The case of Mpumalanga Province. International Journal of Economics and Financial Issues, 7(4), 254–261.
- Ntuli, M., & Kwenda, P. 2013. Labour unions and wage inequality among African men in South Africa. Development Policy Research Unit, Working Paper 13/159. DPRU, University of Cape Town.
- OECD. (2012). Reducing income inequality while boosting economic growth: Can it be done?, in Economic Policy Reforms 2012: Going for Growth. OECD Publishing. https://doi.org/10.1787/growth-2012-47-en
- Panizza, U. (2002). Income, inequality and economic growth: Evidence from American data. Journal of Economic Growth, 7(1), 25–41. https://doi.org/10.1023/A:1013414509803
- Panzera, D., & Postiglione, P. (2022). The impact of regional inequality on economic growth: A spatial econometric approach. Regional Studies, 56(5), 687–702. https://doi.org/10.1080/00343404.2021.1910228
- Partridge, M. (1997). Is inequality harmful for growth? Comment. The American Economic Review, 87(5), 1019–1032.
- Pelinescu, E. (2015). The impact of human capital on economic growth. Procedia Economics and Finance, 22, 184–190. https://doi.org/10.1016/S2212-5671(15)00258-0
- Penn world table, version 10.0.2022. www.ggdc.net/pwt [Retrieved March 20, 2022].
- Perotti, R. (1993). Political equilibrium, income distribution and growth. The Review of Economic Studies, 60(4), 755–776. https://doi.org/10.2307/2298098
- Perotti, R. (1996). Growth, income distribution and democracy: What the data say. Journal of Economic Growth, 1(2), 149–187. https://doi.org/10.1007/BF00138861
- Persson, T., & Tabellini, G. (1994). Is inequality harmful for growth? Theory and evidence. The American Economic Review, 84(3), 600–621.
- Pesaran, B., & Pesaran, M. H. (2009). Time series econometrics using microfit 5.0. Oxford University Press.
- Pesaran, M. H., & Shin, Y. (1999). An autoregressive distributed lag modelling approach to cointegration analysis. In S. Strom (Ed.), Econometrics and economic theory in the 20th century: The Ragnar Frisch Centennial Symposium, Cambridge (pp. 371–413). Cambridge University Press.
- Pesaran, M. H., Shin, Y. C., & Smith, R. (2001). Bound testing approaches to the analysis of level relationships. Journal of Applied Econometrics, 16(3), 289–326. https://doi.org/10.1002/jae.616
- Pesaran, M. H., Shin, Y., & Smith, R. J. 1996. Testing for the existence of a long-run relationship. Cambridge Working Papers in Economics, No. 9622. Faculty of Economics, University of Cambridge.
- Philip, K., Tsedu, M., & Zwane, M. (2014). The impacts of social and economic inequality on economic development in South Africa. United Nations Development Programme (UNDP). Retrieved October 25, 2019. https://www.undp.org/content/dam/south_africa/docs/Reports/UNDP%20Inequality%20South%20Africa.pdf.
- Piketty, T. (1997). The dynamics of the wealth distribution and the interest rate with credit rationing. The Review of Economic Studies, 64(2), 173–189. https://doi.org/10.2307/2971708
- Quantec EasyData. (2022). Development indicators. Retrieved April 23, 2022. www.easydata.co.za/dataset/RGIN/.
- Rajan, R. G., & Zingales, L. (2008). Financial dependence and growth. The American Economic Review, 88(3), 559–586.
- Rebelo, S. (1991). Long-run policy analysis and long-run growth. Journal of Political Economy, 99(3), 500–521. https://doi.org/10.1086/261764
- Robinson, S. (1976). A note on the U-hypothesis relating inequality and economic development. The American Economic Review, 66(3), 437–440.
- Romer, P. (1986). Increasing returns and long run growth. Journal of Political Economy, 94(5), 1002–1037. https://doi.org/10.1086/261420
- Romer, P. (1990). Endogenous technological change. Journal of Political Economy, 98(52), S71–S102. https://doi.org/10.1086/261725
- Royuela, V., Veneri, P., & Ramos, R. (2019). The short-run relationship between inequality and growth: Evidence from OECD regions during the great recession. Regional Studies, 53(4), 574–586. https://doi.org/10.1080/00343404.2018.1476752
- Scholl, N., & Klasen, S. (2019). Re-estimating the relationship between inequality and growth. Oxford Economic Papers, 71(4), 824–847. https://doi.org/10.1093/oep/gpy059
- Seo, H.-J., Kim, H. S., & Lee, Y. S. (2020). The dynamic relationship between inequality and sustainable economic growth. Sustainability Journal, 12 (14), 1–16. https://doi.org/10.3390/su12145740.
- Shahbaz, M. (2010). Income inequality, economic growth and nonlinearity: A case of Pakistan. International Journal of Social Economics, 37(8), 613–636. https://doi.org/10.1108/03068291011060652
- Shen, C., & Zhao, X. (2022). How does income inequality affects economic growth at different income levels? Economic Research-Ekonomska Istraživanja, 36(1), 864–884. https://doi.org/10.1080/1331677X.2022.2080742
- Solow, R. (1956). A contribution to the theory of economic growth. Quarterly Journal of Economics, 70(1), 65–94. https://doi.org/10.2307/1884513
- Solt, F. (2019). The standardized world income inequality database. Versions 8-9 Available at Harvard Dataverse, V9.2. [accessed 20 March 2022]. https://doi.org/10.7910/DVN/LM4OWF
- Sonin, K. (2003). Why the rich may favour poor protection of property rights. Journal of Comparative Economics, 31(4), 715–731. https://doi.org/10.1016/j.jce.2003.09.005
- South African Embassy in the Netherlands. (2013). Key sectors. Retrieved March 10, 2020 https://www.zuidafrika.nl/key-sectors.
- South African History Online (SAHO). (1994a). Heritage and identity of provinces. Retrieved July25, 2019. www.sahistory.org.za/article/heritage-and-identity-provinces.
- South African History Online (SAHO). (1994b). A history of apartheid in South Africa. Retrieved April 16, 2020. https://www.sahistory.org.za/article/history-apartheid-south-africa.
- Temple, J., & Wößmann, L. (2006). Dualism and cross-country growth regressions. Journal of Economic Growth, 11(3), 187–228. https://doi.org/10.1007/s10887-006-9003-x
- Topolewski, Ł. (2020). The impact of income inequalities on economic growth. Economics and Law, 19(2), 355–365. https://doi.org/10.12775/EiP.2020.024
- Topuz, S. G. (2022).Retrieved December 21, 2022 The relationship between income inequality and economic growth: Are transmission channels effective? Social Indicators Research, 162, 1177–1231. https://doi.org/10.1007/s11205-022-02882-0
- Van der Berg, S. (2011). Current poverty and income distribution in the context of South African history. Economic History of Developing Regions, 26(1), 120–140. https://doi.org/10.1080/20780389.2011.583018
- Venieris, Y. P., & Gupta, D. K. (1986). Income distribution and socio-political instability as determinants of savings: A cross-sectional model. Journal of Political Economy, 94(4), 873–883. https://doi.org/10.1086/261412
- Weil, D. N. (2008). Economic growth. Pearson.
- World Bank. (2012). South Africa – Economic Update: Focus on inequality of opportunity. The International Bank for Reconstruction and Development/The World Bank. Retrieved December 20, 2022. https://openknowledge.worldbank.org/handle/10986/26076.
- World Bank. (2018a). Overcoming poverty and inequality in South Africa: An assessment of drivers, constraints and opportunities. Retrieved June 10, 2019. http://documents.worldbank.org/curated/en/530481521735906534/pdf/124521-REV-OUO-South-Africa-Poverty-and-Inequality-Assessment-Report-2018-FINAL-WEB.pdf.
- World Bank. (2018b). South Africa – Economic update. World Bank. Retrieved October 31, 2019. https://pubdocs.worldbank.org/en/798731523331698204/South-Africa-Economic-Update-April-2018.pdf.
- World Bank. (2019a). South Africa: Overview. World Bank. Retrieved July 15, 2019. https://www.worldbank.org/en/country/southafrica/overview.
- World Bank. (2019b). World development indicators. World bank data. Retrieved July 25, 2019. https://databank.worldbank.org/source/world-development-indicators#.
- World Bank. (2021). South Africa overview: Development news, research, data. World Bank 2021. Retrieved March 5, 2022. https://www.worldbank.org/en/country/southafrica/overview#1.
- World Bank. (2022a). New world bank report assesses sources of inequality in five countries in Southern Africa. World Bank Data. Retrieved May 19, 2022. https://www.worldbank.org/en/news/press-release/2022/03/09/new-world-bank-report-assesses-sources-of-inequality-in-five-countries-in-southern-africa.
- World Bank. (2022b). World development indicators. World Bank Data. Retrieved May 19, 2022. https://databank.worldbank.org/reports.aspx?source=2&series=SI.POV.GINI&country=#.
- World Bank. (2022c). World Development Indicators World Bank Data. https://databank.worldbank.org/source/world-development-indicators# [Retrieved March 10, 2022].
Appendix
Table A1. Descriptive statistics of economic growth, income inequality, human capital, population growth physical capital, and government expenditure, 1989–2018
