?Mathematical formulae have been encoded as MathML and are displayed in this HTML version using MathJax in order to improve their display. Uncheck the box to turn MathJax off. This feature requires Javascript. Click on a formula to zoom.
Abstract
The current study aims to analyze the factors influencing ASEAN economic growth and integration. Specifically, the variables of inter-regional trade, human resource development, and corruption were investigated in six lower-middle-income countries from 1996 to 2019 through Driscoll and Kraay’s, Newey and West’s, and Dumitrescu and Hurlin’s as causal analysis. The study’s results found that capital had an impact of 0.248%, labor had an impact of 0.467%, human development had 3.010%, intra-regional trade had an impact of 0.014%, and corruption control had 0.260%. Statistically, all variables have a significant effect except for inflation. Furthermore, a bidirectional found in economic growth from the capital, corruption control, and intra-trade. A unidirectional was found for economic growth between the labor force and human development. At the same time, a neutral relationship was found between inflation and economic growth. Based on these findings, strengthening the economy in the integration area needs to be done, even if it’s only trading with fellow LMIs. Besides that, there is an increasing need to increase the allocation of education and health, which stimulates productivity. The government also needs to strengthen corruption control, which is detrimental to developing nations and economic growth.
PUBLIC INTEREST STATEMENT
Integration is defined as the interconnection of several regions with the same goal of ensuring the economy’s continued development. ASEAN is one of them. Each country has unique characteristics in terms of capital, labor, human development, trade performance, corruption control, and inflation. This study examines ASEAN integration from 1996 to 2020, with a focus on low-middle income countries. According to the study’s findings, all research variables stimulate economic growth (except inflation), and there is a causal relationship between variables in both directions and one direction. The study’s findings are expected to be helpful for policymakers in encouraging economic growth.
1. Introduction
Integration is interconnection of numerous aspects for the simultaneous achievement of multiple goals among individuals and groups. For example, Association of Southeast Asian Nations or in short is ASEAN. Essentially, ASEAN focuses on the economic and trade sectors to resolve increasing liberalization challenges in interstate cooperation. The integration is anticipated to establish a stable, open, vibrant, and resilient regional economic community, which promotes economic growth in the ASEAN region.
ASEAN countries developed and adhered to the ASEAN Free Trade Agreement (AFTA) in 1993. Contemporarily, 10 ASEAN member countries, namely the Philippines, Vietnam, Myanmar, Cambodia, Laos, Malaysia, Singapore, Brunei Darussalam, Indonesia, and Thailand, continues economic cooperation to elevate economic growth and competitiveness in producing quality goods and services. Concurrently, ASEAN countries cooperate with other nations, such as China and India by forming ASEAN-Plus to further stimulate economic development.
Integration is become a hot topic of theoretical discourse regarding the economic community due to the positive economic benefits generated for each member country (Bong & Premaratne, Citation2018; Shah, Citation2021). One of the advantages is that each member country can trade with member countries without any obstacles to either the same economy or a higher economy. However, the consistency of this positive impact does not always occur. Obasaju et al. (Citation2021) found that integration does not benefit state members because each member has a different character. These differences may include natural resources, human resources, skills, technology, bureaucratic quality, corruption control, etc. This difference greatly determines the country’s ability to obtain high economic growth (Jahanger et al., Citation2022).
These characteristic differences exist in the ASEAN region dominated by developing countries. Most member developing countries, especially lower middle income, have low capability of human resources and technology that encourages inefficiency. Not only in terms of weakened productivity but also leading the use of natural resources (include non-renewable energy) to become wasteful (Chen et al., Citation2022; Rafei et al., Citation2022). In addition, often unstable political turbulence (in the control of corruption) causes economic performance not to be achieved. In the long term, more massive environmental damage is the most worrying (Wang et al., Citation2023; Wang et al., Citation2023) and gives causal to the economy (Jahanger et al., Citation2022; Li et al., Citation2021).
Based on above background analysis, this paper is dedicated to solving three problem as follows:
Does intra trade between lower-middle-income countries drive economic growth during the integration period?
Are human development and control of corruption important to boost economic growth during the integration period?
Does the research variable have a causal relationship with economic growth during the integration period?
This study contributes to the literature about economic growth by presenting the case of ASEAN integration area, especially lower-middle income countries. To the best of the author’s knowledge, this study pioneered the examination of the aforementioned issues and relevant impacts, as previous researchers investigated the issues without considering each ASEAN country status (see Bong & Premaratne, Citation2018; Masron, Citation2013; Nguyen & Bui, Citation2022; Okabe & Urata, Citation2014; Huang; Citation2016). Therefore, the present study bridged the economic literature gap on integration and the issues underlying human resource development and corruption control. Gründler and Potrafke (Citation2019) explicated that corruption would significantly disrupt the national economy owing to production inefficiencies. Correspondingly, the present study employed Driscoll and Kraay’s (Citation1998) and Newey and West’s (Citation1987) panel as an analytical tool for controlling the linkage problem between investigation areas. Furthermore, this study incorporated the Granger panel method by Dumitrescu and Hurlin (Citation2012) to reveal causal relationships.
The remainder of this paper is organized as follow. Section 1 describes an overview of the AFTA and lower-middle-income ASEAN nations. Section 2 conducts a reviews of the relevant literature and hypothesis. Section 3 describes econometric data and strategies. Section 4 reports and discusses the results. Finally, Section 5 draws conclusions and pertinent policy recommendations.
2. An overview of the AFTA and lower-middle-income ASEAN countries
The ASEAN Free Trade Agreement (AFTA) is an agreement between several ASEAN countries from 1993 until recently, which aims to boost ASEAN economic growth by expanding trade routes and networks to other member countries, eliminating tariffs, and increasing production efficiency (Okabe & Urata, Citation2014). In addition, AFTA removes barriers for member countries to obtain foreign investment (Masron, Citation2013). While the initial AFTA was developed based on the trading of goods, the agreement was proposed to be expanded to service trades in 2020 with a relevant consensus remaining in negotiation. Nevertheless, policymakers realize the AFTA benefits and instrumentality for future economic development, as demonstrated by the Singaporean share of exports in 1990 among ASEAN member countries being elevated to 39.8% currently. In 2010, the share was reduced to 23.2% due to the active Indonesian contribution in the export sector achieving 19% of the share (Okabe & Urata, Citation2014).
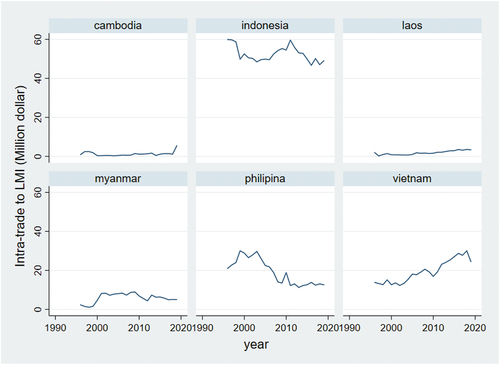
Cambodia, Indonesia, Laos, Myanmar, the Philippines, and Vietnam are developing lower-middle-income nations. Nevertheless, each country exhibits highly stable economic performance with an average of 5% annual growth (see Appendix A1), especially Laos, Vietnam, and Cambodia, while the remaining fluctuated in the first 10 years before stabilizing in the following years. These six countries compete with each other for market share (see Appendix A4). Although positive economic growth with increasing trade resulted from AFTA, the six countries possess different quality human resources (see Appendix A2) with varying development. Meanwhile, corruption control highly varies among the six nations within the negative range (see Appendix A3) owing to different political situations.
3. Literature review
3.1. Economic growth, capital, and labor
Economic growth denotes the output of an activity in a certain period, while the classical theory expounds economic output being determined by capital and labor formulated mathematically in Equationequation (1)(1)
(1) as follows:
Where Y, K, and L represent economic growth, capital, and labor respectively, which depicts the positive effect of the two variables on economic growth. Several previous studies corroborated the equation like Ahmed et al. (Citation2016), Solarin (Citation2020), Minh and Van (Citation2023). Ahmed et al. (Citation2016) assessed capital and labor via the Bayer-Hanck cointegration approach in Iran between 1965 and 2011. The results demonstrated that capital and labor significantly and positively impact economic growth. Similarly, Solarin (Citation2020) performed a relevant investigation in the United Stated through maximum likelihood analysis from the first quarter of 2002 to the fourth quarter of 2019, which revealed a similar positive impact of capital and labor on long-term economic growth. Recently, Minh and Van (Citation2023) discovered that only capital significantly and positively influences long-term Vietnamese economic growth based on the ARDL method from 1995 to 2019. Accordingly, two relevant hypotheses were proposed:
H1:
Capital positively influences economic growth.
H2:
Labor positively impacts economic growth.
3.2. The human development index and economic growth
Human development is integral to increased workforce productivity and efficiency before positively impacting economic growth, in example, Čadil et al. (Citation2014) examined human capital as a human development indicator in Europe from 2004 to 2008 via a robust regression model, which discovered a significant negative effect regionally and a significant positive influence in clusters. Concurrently, Fleisher et al. (Citation2010) revealed through the fixed effect model that human capital significantly and positively influenced economic growth, wherein an increase in human capital in the surrounding area would encourage relevant economic growth. Colantonio et al. (Citation2010) also studied African human capital via the matrix correlation method and corroborated that human capital in the healthcare and education sectors was correlated to economic growth by 85%.
Qadri and Waheed (Citation2014) manifested that Pakistani human capital significantly and positively influenced economic growth through multiple regression. Nevertheless, Pelinescu (Citation2015) through the Pooled Least Square approach disclosed that elevating human capital in 28 European regions from 2002 to 2012 significantly and negatively influenced economic growth. Fang and Chang (Citation2016) discovered no positive effect of human capital on economic growth in the Asia-Pacific region through the Continuously Updated Fully Modified (CUP-FM) and Fully Modified Ordinary Least Square (FMOLS), as the finding revealed that human capital insignificantly impacted economic growth. Meanwhile, Sultana et al. (Citation2022) discovered via the GMM System that human capital proxied by the average schooling length in 141 developing and developed countries produced a positive effect only in developing countries, while developed countries received an insignificant effect. Although previous literature demonstrated mixed findings, the current study proposed as follows:
H3:
The Human Development Index positively influences economic growth.
3.3. The inter-regional trade and economic growth
Exports occur not only because of the requests from other countries but due to the cooperation agreement. Although each country possesses different productivity levels, positive competitiveness in producing quality goods is encouraged (Okoro et al., Citation2020). Although limited studies investigated the relationship between exports and economic growth, Bhattacharyya (Citation2005) demonstrated a positive relationship between industrial sector exports and economic growth in South Korea through the Johansen cointegration. Similarly, Wooster et al. (Citation2011) predicted a positive effect of exports on economic growth in 13 European countries from 1980 to 2003 via regression.
Tahernejad et al. (Citation2017) revealed that certain countries, such as Iran, Indonesia, and Malaysia in the D-8 country integration area exhibited a significant positive impact of inter-regional trade on economic growth. Okoro et al. (Citation2020) also manifested via the Generalized Methods of Moment (GMM) that the West African regional trade significantly and positively influenced economic growth. Contrarily, Miron et al. (Citation2010) did not reveal a similarly significant relationship in Romania through the logistical approach. Meanwhile, Zahonogo (Citation2017) demonstrated through the panel mean group method that inter-regional trade would only produce a significant positive impact on economic growth in active trade liberalization among 42 sub-Saharan African nations between 1998 and 2012. Summarily, despite past mixed results, a hypothesis was proposed as follows:
H4:
Inter-regional trade positively impacts economic growth.
3.4. Corruption control and economic growth
Developing countries are ineffective in controlling corruption, which aggravates the issues of inflation and poverty before negatively impacting economic growth. Although relevant studies are limited, Farooq et al. (Citation2013) disclosed through the Autoregressive Distributed Lag (ARDL) that corruption control positively impacted long-term Pakistani economic growth from 1987 to 2009. Cieślik and Goczek (Citation2018) studied 141 countries from 1994–2012 using the GMM method. Contrastingly, Nguyen and Bui (Citation2022) revealed via the GMM that corruption control negatively influenced economic growth in 16 emerging countries from 2000 to 2019. Nevertheless, Sharma and Mitra (Citation2019) tested the relationship globally by employing the same analysis method, which demonstrated that corruption control significantly and positively influences economic growth. Contrarily, another global study by Uberti (Citation2022) discovered the significant negative effect of corruption control on economic growth from the historical data analyzed through regression. Although previous studies manifested mixed findings, the current study hypothesized as follows:
H5:
Corruption control positively influences economic growth.
3.5. Literature gap
After summarizing the relevant literature studies, the literature gaps include the following: (1). The literature on independent variables on economic growth has different findings between studies, so it is inconsistent. (2) It can be seen that integration studies are rarely discussed, especially ASEAN with sub-status state income. (3) Most of the previous studies used dynamic panels and time series models as analytical tools. Based on these gaps, this study examines this relationship using Driscoll and Kraay’s (Citation1998) and Newey and West’s (Citation1987) approaches and the Dumitrescu and Hurlin (Citation2012) causality panel from 1996–2020. This method uses specific criteria to obtain important information about the current economy.
4. Data and econometric strategy
4.1. Data analysis
The current study analyzed actual economic growth in six lower-middle-income ASEAN countries, namely Cambodia, Indonesia, Laos, Myanmar, Philippines, and Vietnam, from 1996 to 2019 based on the available observational data illustrating the AFTA period. The selected countries based on the World Bank classification (2021) were appraised on capital, labor, human resource development, inter-regional trade, corruption control, and inflation with relevant details on definitions and data sources presented in Table .
Table 1. Descriptive variables and data sources
4.2. Econometric strategies
The present study was initiated with the neoclassical production function, which describes A as a constant technology, with K and L being changed by assuming a constant return to the scale as follows:
EquationEquation (2)(2)
(2) is extended via several variables to be examined, namely human resource development, inter-regional trade, corruption control, and inflation, as delineated in Equationequation (3)
(3)
(3) . Given that Equationequation (3)
(3)
(3) is non-linear, the researcher transformed the equation into a natural logarithm (ln) as Equationequation (4)
(4)
(4) :
is considered a constant coefficient
, with
as the coefficient of each variable. i represents 10 countries and t portrays the period from 1996 to 2019, with all coefficients interpreted in percentage. Countries in the same groups generally possess linkages with other countries (Fachrurrozi et al., Citation2022), although each country reflects different economic structures. Thus, several stages of testing are required to ensure zero errors in estimations, in which several procedures, such as the cross-sectional dependence test, stationarity panel testing, cointegration panels, long-term estimation methods, and causality panel testing were performed before estimating Equationequation (4)
(4)
(4) .
4.2.1. Cross-sectional dependence tests
Regarding the panel data, economic relations between countries would likely occur, especially among countries with inter-regional cooperation agreements (Fachrurrozi et al., Citation2022; Ozcan & Ozturk, Citation2019). The conventional method assumes no relationship between regions, which leads to unreliable estimation findings in panel data model (Wang et al., Citation2023), especially in the long term (Wang et al., Citation2022). Hence, the cross-sectional dependence test was conducted through two approaches, namely the Lagrange Multiplier (LM) test (Breusch & Pagan, Citation1980) and the statistical CD test (Pesaran, Citation2021) with the following computations:
EquationEquations (5)(5)
(5) and (Equation6
(6)
(6) ) elucidate that N is the number of countries, T is the time, and
is the residual correlation between regions i and j. The null hypothesis of the tests is that no correlation exists between regions, while the alternative hypothesis postulates a significant correlation between each region.
4.2.2. Panel unit root tests
Stationarity testing on data is highly necessary before assessing the model, although stationarity tests, such as Levin-Lin-Chu (LLC) and Im-Pesaran-Shin (IPS) could not be performed to determine the correlation between regions. Therefore, Pesaran (Citation2007) recommended employing Cross-sectional Augmented Dickey-Fuller (CADF) and Cross-sectional IPS (CIPS) stationarity tests, which address both regional correlations and heteroscedasticity. The null hypothesis of the tests is data non-stationary, whereas the alternative hypothesis is data stationary. The CADF statistical computation is conducted as per the following equation:
Where is the difference, Y is the dependent variable, and
are residuals. Based on the CADF computation, the CIPS calculation is expressed as follows:
4.2.3. Panel cointegration tests
Cointegration testing is employed when all variables possess the same integration level (first difference). Wang, et al. (Citation2023) explained that cointegration can occur in the same order of integration so that a long-term relationship is possible. Numerous researchers, such as Pedroni (Citation2004), Kao (Citation1999), and Johansen (Citation1991), conducted cointegration as a test tool. Nevertheless, the test results would be unreliable when a correlation exists between regions, which requires Westerlund’s (Citation2007) method as a solution. The Westerlund cointegration calculation is performed in the ECM model as follows:
Where Y is the dependent variable, X is the independent variable, i is the region, t is the time, and αi is the speed of error correction. The Westerlund cointegration method consists of two components, namely statistical groups (Gt and Ga) and statistical panels (Pt and Pa). The null hypothesis proposes no cointegration exists while the alternative hypothesis posits a cointegration relationship across all panels. Resultantly, the cointegration test exists although one of the four statistics is insignificant. The group calculations and statistical panels are expressed as follows:
4.2.4. Long-term estimation methods
To achieve the first and second objectives, we use Driscoll and Kraay’s (Citation1998) and Newey and West’s (Citation1987). This method was employed to perform the long-term estimation, which discusses panel estimation with issues involving autocorrelation, heteroscedasticity, and cross-sectional dependence (Rahman et al., Citation2022). In addition, the method could resolve missing and imbalanced data (Chandio et al., Citation2022) that are irresolvable by previous panel methods, including pooled ordinary least squares (OLS), fixed effects, and random effects (Djoukouo, Citation2021). The equation is illustrated as follows:
Where y is the dependent variable (Economic Growth), x represents the independent variables (K, L, HDI, ITR, CC, INF) with the vector of (K +1) times the first element (1), and β corresponds to the vector of (K +1) times (1) as the estimated coefficient. The regressors xit and εit are assumed for all uncorrelated i and t (assumed to be exogenous). Meanwhile, εit possesses autocorrelation, heteroscedasticity, and cross-sectional dependence. Based on the OLS estimation consistency, β could be derived as follows (Hoechle, Citation2007):
The estimated coefficients fromDriscoll and Kraay’s (Citation1998) standard errors are derived from the “square root of the diagonal elements of the asymptotic covariance matrix” (Hoechle, Citation2007: 287) expressed as follows:
The fixed effect estimators, namely the weighted least squares (WLS) estimators, could be calculated upon applying the transformation (the WLS transformation) to all model variables estimated by the OLS pool with Driscoll-Kraay’s standard errors (Djoukouo, Citation2021). The temporary was defined byNewey and West (Citation1987) as follows:
4.2.5. Dumitrescu-Hurlin causality test
Last objective, cointegration indicates a long-term relationship between variables without signifying the direction of each variable However, there may be several directions in the variable that is important in policy (Li et al., Citation2021). Thus, directional testing, namely the Dumitrescu-Hurlin (Dumitrescu & Hurlin, Citation2012) panel causality, was conducted to appraise the panel data applicable to both N > T and T > N cases (Haseeb et al., Citation2018; Wang et al., Citation2022) as follows:
Where is constant,
is the lag coefficient of Y, k is the optimal lag, and
is the X coefficient.
and
delineate the differences between each region, with the null and alternative hypotheses presented as follows:
The null hypothesis propounds that no causal relationship exists in the panel data, whereas the alternative proposes causality between the panel data for at least one region. The Wald statistic is recommended calculating the DH panel causality by determining the average Wald statistic value for each region. is employed if N > T [Equationequation (19)
(19)
(19) ] is temporary and
(the corresponding standard statistic) is performed with T > N [Equationequation (20)
(20)
(20) ] as follows:
Table presents a summary of the research data and correlation matrix between variables. Standard deviation values explain data fluctuations, which highlight that inter-regional inflation is more turbulent than the variables of economic growth, capital, labor, human resource development, and corruption. Nonetheless, all variables are not normally distributed where the Jarque-Berra (JB) probability value is below 1% significance. Table also demonstrates the correlation matrix between interrelated variables, except for inflation which is correlated with economic growth and human resource development.
Table 2. Descriptive statistics and the correlation matrix
5. Results and discussion
5.1. Results
5.1.1. Preliminary results
The pre-analytical stages, namely autocorrelation and heteroscedasticity, were conducted before analyzing the panel data to ensure the selected analysis tools would be appropriate while avoiding any potential analysis errors. Moreover, both tests of assumptions are crucial to the panel data (Djoukouo, Citation2021; Rahman & Alam, Citation2022). At a 1% significance level, the Woolridge test approach for autocorrelation discovered a statistical lift of 33,042, while the Modified Wald test for heteroscedasticity revealed a statistic of 193.31, which suggested the existence of autocorrelation and heteroscedasticity issues (see Table ). Thus, conventional panel analysis methods would not be performed in the present study.
Table 3. Autocorrelation dan heteroscedasticity tests
5.1.2. The cross-sectional dependence results
The subsequent pre-analysis test was the cross-sectional dependence test through the LM and CD approaches with relevant findings presented in Table . The findings manifested that all variables were significant, which provided concrete evidence of cross-sectional dependence on each variable in the panel data. This shows that each country is interconnected.
Table 4. Cross-sectional dependence tests
5.1.3. Panel unit root results
Table depicts the results of CADF and CIPS stationarity testing to avoid estimation errors (Fachrurrozi et al., Citation2022; Ikhsan et al., Citation2022). Specifically, the findings suggested rejecting the null or stationary hypothesis at the first difference level, which indicates that the variables of economic growth, capital, labor, human resource development, inter-regional trade, corruption control, and inflation are integrated at the first level.
Table 5. Panel unit root tests
5.1.4. Cointegration results
Due to the cross-sectional dependence issues, cointegration testing was performed subsequently to observe the estimation through the Westerlund cointegration test, as portrayed in Table . The findings demonstrated that the Ga, Gt, Pa, and Pt statistics rejected the null hypothesis at the 1% significance level, which confirms the existence of cointegration at least once in the research area.
Table 6. The Westerlund cointegration test
5.1.5. Long-term panel estimation
To answer research objectives one and two, Driscoll-Kraay’s method and Newey-West’s test were conducted for long-term panel estimation, as illustrated in Table . Particularly, the Driscoll-Kraay estimation revealed that the capital variable produced a positive and significant influence at the 1% significance level, wherein a 1% increase in capital would lead to a 0.24% increase in economic growth by assuming ceteris paribus. Meanwhile, labor demonstrated a significant positive effect at the 1% significance level, which propounded that a 1% increase in labor productivity would result in a 0.46% increase in economic growth with the ceteris paribus assumption.
Table 7. Results of Driscoll-Kraay’s and Newey-West’s standard error estimations
Furthermore, HDI reflected a higher positive effect compared to other variables, in which a 1% increase in HDI would contribute to a 3.01% increase in economic growth by assuming ceteris paribus. The finding is concurrent with Fleisher et al. (Citation2010) and Sultana et al. (Citation2022) while contrasting with Fang and Chang (Citation2016). Summarily, human resources are pivotal to the six countries (Cambodia, Indonesia, Laos, Myanmar, the Philippines, and Vietnam) due to the highly significant impact on economic growth, which could be elevated through sufficient education and healthcare in driving labor productivity (Ogundari & Awokuse, Citation2018).
The variable of inter-regional trade demonstrated a significant positive effect on economic growth at the 5% significance level, wherein economic growth would increase by 0.014% with a 1% increase in inter-regional trade. The findings correspond to Bhattacharyya (Citation2005), Wooster et al. (Citation2008), Tahernejad et al. (Citation2017), and Okoro et al. (Citation2020) but contradicted Miron et al. (Citation2010). These findings show that integration provides benefits for lower middle income countries. However, the resulting impact is shallow when compared to other variables. One of the reasons is that these member countries have the same status and thus show similar selling power of raw goods and production, even though all the related transactions that complement the increasing domestic demand for certain goods.
Meanwhile, corruption control produced a significant positive impact at the 1% significance level, in which economic growth would be elevated by 0.26% with a 1% increase in corruption control by assuming ceteris paribus. The finding is in line with Farooq et al. (Citation2013) and Cieślik and Goczek (Citation2018), although contrary to Nguyen and Bui (Citation2022). Controlling corruption is a crucial element in economic development. The variable reflects how the economy works. If control is low, market stability will be directly disrupted due to rising prices, scarcity of goods, and loss of opportunities for cooperation with fellow members and other countries that can help boost economic growth. Nonetheless, the control variable, namely inflation, generated an insignificant effect on economic growth. Summarily, the Newey-West estimation results explicated all variables through the consistent findings discovered via the Driscoll-Kraay method. Although controlling corruption and human capital is a challenge for the six countries, adequate efforts would generate positive impacts on the economy.
5.1.6. Panel causality results
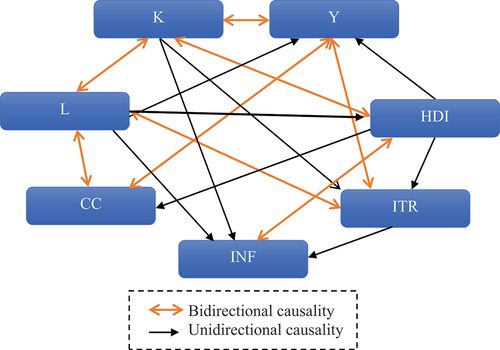
In this sub-chapter, we analyze the third goal, namely the relationship between research variables with the Dumitrescu-Hurlin (DH) causality approach. The aim is to provide information and strategies for policymakers. The estimation results are presented in Table where there is a bidirectional between Y and K, Y and ITR, Y and CC, K and HDI, L and K, L and CC, L and ITR, and INF and HDI. Meanwhile, a unidirectional was found from L to Y, L to INF, L to HDI, K to INF, HDI to Y, HDI to ITR, and ITR to INF. Neutral relationships were found between INF and Y, CC and ITR, as well as INF and CC. The relationship between economic growth and trade is in line with the study by Wooster et al. (Citation2011) but different from Li et al. (Citation2021) on the LMI study. Meanwhile, the relationship between corruption control and economic growth is in line with Farooq et al. (Citation2013) and Song et al. (Citation2021).
Table 8. The panel causality test results
Visualization of this causality relationship is presented in Figure . Indirectly, economic integration in ASEAN has a different relationship from other integration areas by Bong and Premaratne (Citation2018) and Shah (Citation2021). The impetus for economic growth in the LMI case can occur directly or indirectly. It can be seen that economic growth and intra-trade are interrelated, and when this happens, the absorption of labor will have an impact on economic growth. However, the consequence is inflation because people have high purchasing power. On the other hand, economic growth can weaken if corruption control is low. The indications explained are the reduced availability of jobs due to corruption and causing unemployment. Fewer workers drive trade not to run and affect workers in getting skills.
Figure 1. Summary panel causality ASEAN low middle income.
6. Conclusion and policy implications
The present study investigated the influences of inter-regional trade and corruption control on real economic growth in six lower-middle-income ASEAN countries. This study also discovered the latest findings for the economic integration literature through Driscoll and Kraay’s (Citation1998) and Newey and West’s (Citation1987) approaches with several econometric tests on cross-sectional dependence. Specifically, the fundamental criteria stipulated by each test were fulfilled before employing the analytical model to resolve the violation of autocorrelation and heteroscedasticity assumptions. Meanwhile, the linkages between regions were integrated at the first level until a cointegration existed between the studied variables.
The empirical results demonstrated that capital, labor, the HDI, inter-regional trade, and corruption control significantly and positively impacted real economic growth, whereas inflation as a controlling indicator produced a significant negative effect on economic growth. The study’s results found that capital had an impact of 0.248%, labor had an impact of 0.467%, human development had 3.010%, intra-trade had an impact of 0.014%, and corruption control had 0.260%. In addition, the DH test revealed causality in the relationships between capital and economic growth, inter-regional trade and economic growth, corruption control and economic growth, and inflation and economic growth. Resultantly, lower-middle-income countries could continue the AFTA benefits although the effect was minimal. Nonetheless, the national economy would be boosted, which requires the government to further enhance cooperation with ASEAN member nations. Concurrently, the government should improve human resource development by increasing allocated budgets on education and healthcare to encourage higher labor productivity, while strengthening corruption control to prevent relevant detrimental effects on economic growth, especially in developing countries.
The findings of this study show that intra-trade, corruption control and human development can increase economic growth, especially for low-income countries in the ASEAN integration region. However, there are several limitations. First, this study only uses intra-trade, corruption control, and human development. Researchers can review institutional quality, foreign direct investment, and political stability for the next study. These variables are very important in driving economic growth. Second, future researchers can develop analytical methods such as asymmetric and threshold panels to get new perspectives in filling the literature on economic growth. Third, the next researcher can add several ASEAN members as comparison study.
Acknowledgments
The authors would like to thank two anonymous reviewers for their valuable comments on our first manuscript.
Disclosure statement
No potential conflict of interest was reported by the author(s).
Additional information
Funding
Notes on contributors
Nurjannah Nurjannah
Nurjannah Nurjannah is a lecturer in Development Economics, Faculty of Economics, Universitas Samudra. Her interest research are macroeconomics, monetary economics, and international economics.

Raja Masbar
Raja Masbar is a professor in microeconomics, Universitas Syiah Kuala. He completed his doc-toral program in Microeconomics at University of Kentucky, Lexington, USA.
M. Shabri Abd. Majid
M. Shabri Abd. Majid is a professor in Islamic economics, Universitas Syiah Kuala. He completed Ph.D. in Financial Economics from the International Islamic University, Malaysia.
Suriani Suriani
Suriani Suriani is a lecturer in Development Economics, Faculty of Economics and Business, Universitas Syiah Kuala. Her interest are micro and macro economics, monetary economics, development economics, banks and financial institutions, Islamic economics, industrial economics and central of banking.
References
- Ahmed, K., Mahalik, M. K., & Shahbaz, M. (2016). Dynamics between economic growth, labor, capital and natural resource abundance in Iran: An application of the combined cointegration approach. Resources Policy, 49, 213–19. https://doi.org/10.1016/j.resourpol.2016.06.005
- Bhattacharyya, R. (2005). Economic development and intra-industry trade in the Republic of Korea. Journal of Economic Integration, 20(4), 809–831. https://doi.org/10.11130/jei.2005.20.4.809
- Bong, A., & Premaratne, G. (2018). Regional integration and economic growth in Southeast Asia. Global Business Review, 19(6), 1403–1415. https://doi.org/10.1177/0972150918794568
- Breusch, T. S., & Pagan, A. R. (1980). The LaGrange multiplier test and its applications to model specification in econometrics. The Review of Economic Studies, 47(1), 239. https://doi.org/10.2307/2297111
- Čadil, J., Petkovová, L., & Blatná, D. (2014). Human capital, economic structure and growth. Procedia Economics and Finance, 12, 85–92. https://doi.org/10.1016/S2212-5671(14)00323-2
- Chandio, A. A., Sethi, N., Prasad Dash, D., & Usman, M. (2022). Towards sustainable food production: What role ICT and technological development can play for cereal production in Asia–7 countries? Computers and Electronics in Agriculture, 202(September), 107368. https://doi.org/10.1016/j.compag.2022.107368
- Chen, F., Ahmad, S., Arshad, S., Ali, S., Rizwan, M., Hamzah Saleem, M., Driha, O. M., & Balsalobre-Lorente, D. (2022). Towards achieving eco-efficiency in top 10 polluted countries: The role of green technology and natural resource rents. Gondwana Research, 110, 114–127. https://doi.org/10.1016/j.gr.2022.06.010
- Cieślik, A., & Goczek, Ł. (2018). Control of corruption, international investment, and economic growth – Evidence from panel data. World Development, 103, 323–335. https://doi.org/10.1016/j.worlddev.2017.10.028
- Colantonio, E., Marianacci, R., & Mattoscio, N. (2010). On human capital and economic development: Some results for Africa. Procedia - Social & Behavioral Sciences, 9, 266–272. https://doi.org/10.1016/j.sbspro.2010.12.148
- Djoukouo, A. F. D. (2021). Relationship between methane emissions and economic growth in Central Africa countries: Evidence from panel data. Global Transitions, 3(2021), 126–134. https://doi.org/10.1016/j.glt.2022.02.001
- Driscoll, J. C., & Kraay, A. C. (1998). Consistent covariance matrix estimation with spatially dependent panel data. Review of Economics and Statistics, 80(4), 549–560. https://doi.org/10.1162/003465398557825
- Dumitrescu, E. I., & Hurlin, C. (2012). Testing for granger non-causality in heterogeneous panels. Economic Modelling, 29(4), 1450–1460. https://doi.org/10.1016/j.econmod.2012.02.014
- Fachrurrozi, K., Masbar, R., Aliasuddin, & Seftarita, C. (2022). Energy-growth-globalization (EGG) nexus in N-11 countries. Heliyon, 8(9), e10522. https://doi.org/10.1016/j.heliyon.2022.e10522
- Fang, Z., & Chang, Y. (2016). Energy, human capital and economic growth in Asia Pacific countries - evidence from a panel cointegration and causality analysis. Energy Economics, 56, 177–184. https://doi.org/10.1016/j.eneco.2016.03.020
- Farooq, A., Shahbaz, M., Arouri, M., & Teulon, F. (2013). Does corruption impede economic growth in Pakistan? Economic Modelling, 35, 622–633. https://doi.org/10.1016/j.econmod.2013.08.019
- Fleisher, B., Li, H., & Zhao, M. Q. (2010). Human capital, economic growth, and regional inequality in China. Journal of Development Economics, 92(2), 215–231. https://doi.org/10.1016/j.jdeveco.2009.01.010
- Gründler, K., & Potrafke, N. (2019). Corruption and economic growth: New empirical evidence. European Journal of Political Economy, 60(August), 101810. https://doi.org/10.1016/j.ejpoleco.2019.08.001
- Haseeb, A., Xia, E., Danish, B., A., M., & Abbas, K. (2018). Financial development, globalization, and CO2 emission in the presence of EKC: Evidence from BRICS countries. Environmental Science and Pollution Research, 25(31), 31283–31296. https://doi.org/10.1007/s11356-018-3034-7
- Hoechle, D. (2007). Robust standard errors for panel regressions with cross-sectional dependence. Stata Journal, 7(3), 281–312. https://doi.org/10.1177/1536867x0700700301
- Huang, C. J. (2016). Is corruption bad for economic growth? Evidence from Asia-Pacific countries. The North American Journal of Economics & Finance, 35(100), 247–256. https://doi.org/10.1016/j.najef.2015.10.013
- Ikhsan, I., Fachrurrozi, K., Nasir, M., Elfiana, E., & Nurjannah, N. (2022). Energy-growth Nexus in Indonesia: Fresh evidence from asymmetric causality test. International Journal of Energy Economics & Policy, 12(1), 396–400. https://doi.org/10.32479/ijeep.11837
- Jahanger, A., Usman, M., & Balsalobre-Lorente, D. (2022). Linking institutional quality to environmental sustainability. Sustainable Development, 30(6), 1749–1765. https://doi.org/10.1002/sd.2345
- Johansen, S. (1991). Estimation and hypothesis testing of cointegration vectors in Gaussian vector autoregressive models. Econometrica, 59(6), 1551–1580. https://doi.org/10.2307/2938278
- Kao, C. (1999). Spurious regression and residual-based tests for cointegration in panel data. Journal of Econometrics, 90(1), 1–44. https://doi.org/10.1016/S0304-40769800023-2
- Li, R., Wang, Q., Liu, Y., & Jiang, R. (2021). Per-capita carbon emissions in 147 countries: The effect of economic, energy, social, and trade structural changes. Sustainable Production and Consumption, 27, 1149–1164. https://doi.org/10.1016/j.spc.2021.02.031
- Masron, T. A. (2013). Promoting intra-ASEAN FDI: The role of AFTA and AIA. Economic Modelling, 31(1), 43–48. https://doi.org/10.1016/j.econmod.2012.11.050
- Minh, T. B., & Van, H. B. (2023). Evaluating the relationship between renewable energy consumption and economic growth in Vietnam, 1995 – 2019. Energy Reports, 9, 609–617. https://doi.org/10.1016/j.egyr.2022.11.074
- Miron, D., Dima, A. M., & Vasilache, S. (2010). Models of the intra-regional trade influence on economic sustainable development in Romania. Amfiteatru Economic, 12(27), 27–35.
- Newey, W. K., & West, K. D. (1987). A simple, positive semi-definite, heteroskedasticity and autocorrelation consistent covariance matrix. Econometrica, 55(3), 703–708. https://doi.org/10.2307/1913610
- Nguyen, M. L. T., & Bui, N. T. (2022). Government expenditure and economic growth: Does the role of corruption control matter? Heliyon, 8(10), e10822. https://doi.org/10.1016/j.heliyon.2022.e10822
- Obasaju, B. O., Olayiwola, W. K., Okodua, H., Adediran, O. S., & Lawal, A. I. (2021). Regional economic integration and economic upgrading in global value chains: Selected cases in Africa. Heliyon, 7(2), e06112. https://doi.org/10.1016/j.heliyon.2021.e06112
- Ogundari, K., & Awokuse, T. (2018). Human capital contribution to economic growth in Sub-Saharan Africa: Does health status matter more than education? Economic Analysis and Policy, 58, 131–140. https://doi.org/10.1016/j.eap.2018.02.001
- Okabe, M., & Urata, S. (2014). The impact of AFTA on intra-AFTA trade. Journal of Asian Economics, 35, 12–31. https://doi.org/10.1016/j.asieco.2014.09.004
- Okoro, A. S., Ujunwa, A., Umar, F., & Ukemenam, A. (2020). Does regional trade promote economic growth? Evidence from Economic Community of West African States (ECOWAS). Journal of Economics and Development, 22(1), 131–147. https://doi.org/10.1108/jed-10-2019-0039
- Ozcan, B., & Ozturk, I. (2019). Renewable energy consumption-economic growth nexus in emerging countries: A bootstrap panel causality test. Renewable and Sustainable Energy Reviews, 104(January), 30–37. https://doi.org/10.1016/j.rser.2019.01.020
- Pedroni, P. (2004). Panel cointegration: Asymptotic and finite sample properties of pooled time series tests with an application to the PPP hypothesis. Econometric Theory, 20(3), 597–625. https://doi.org/10.1017/S0266466604203073
- Pelinescu, E. (2015). The impact of human capital on economic growth. Procedia Economics and Finance, 22, 184–190. https://doi.org/10.1016/s2212-5671(15)00258-0
- Pesaran, M. H. (2021). General diagnostic tests for cross-sectional dependence in panels. Empirical Economics, 60(1), 13–50. https://doi.org/10.1007/s00181-020-01875-7
- Qadri, F. S., & Waheed, A. (2014). Human capital and economic growth: A macroeconomic model for Pakistan. Economic Modelling, 42, 66–76. https://doi.org/10.1016/j.econmod.2014.05.021
- Rafei, M., Esmaeili, P., & Balsalobre-Lorente, D. (2022). A step towards environmental mitigation: How do economic complexity and natural resources matter? Focusing on different institutional quality level countries. Resources Policy, 78(43), 102848. https://doi.org/10.1016/j.resourpol.2022.102848
- Rahman, M. M., & Alam, K. (2022). Effects of corruption, technological innovation, globalisation, and renewable energy on carbon emissions in asian countries. Utilities Policy, 79(October), 101448. https://doi.org/10.1016/j.jup.2022.101448
- Shah, M. I. (2021). Investigating the role of regional economic integration on growth: Fresh insights from South Asia. Global Journal of Emerging Market Economies, 13(1), 35–57. https://doi.org/10.1177/0974910120974800
- Sharma, C., & Mitra, A. (2019). Corruption and economic growth: Some new empirical evidence from a global sample. Journal of International Development, 31(8), 691–719. https://doi.org/10.1002/jid.3433
- Solarin, S. A. (2020). The effects of shale oil production, capital and labour on economic growth in the United States: A maximum likelihood analysis of the resource curse hypothesis. Resources Policy, 68, 101799. November 2019. https://doi.org/10.1016/j.resourpol.2020.101799.
- Song, C. Q., Chang, C. P., & Gong, Q. (2021). Economic growth, corruption, and financial development: Global evidence. Economic modelling, 94(February 2020), 822–830. https://doi.org/10.1016/j.econmod.2020.02.022
- Sultana, T., Dey, S. R., & Tareque, M. (2022). Exploring the linkage between human capital and economic growth: A look at 141 developing and developed countries. Economic Systems, 46(3), 101017. https://doi.org/10.1016/j.ecosys.2022.101017
- Tahernejad, O., Fakheri, M., Shafaee, S. M. M., & Fallahi, A. (2017). Investigating the impact of intragroup trade on the economic growth: Evidence from D8 member countries. International Journal of Economic Perspectives, 11(4), 1116–1128.
- Uberti, L. J. (2022). Corruption and growth: Historical evidence, 1790–2010. Journal of Comparative Economics, 50(2), 321–349. https://doi.org/10.1016/j.jce.2021.10.002
- Wang, Q., Wang, L., & Li, R. (2023). Trade protectionism jeopardizes carbon neutrality – decoupling and breakpoints roles of trade openness. Sustainable Production and Consumption, 35, 201–215. https://doi.org/10.1016/j.spc.2022.08.034
- Wang, Q., Wang, X., & Li, R. (2022). Does urbanization redefine the environmental Kuznets curve? An empirical analysis of 134 Countries. Sustainable Cities and Society, 76(August 2021), 103382. https://doi.org/10.1016/j.scs.2021.103382
- Wang, Q., Yang, T., & Li, R. (2023). Does income inequality reshape the Environmental Kuznets Curve (EKC) hypothesis? A nonlinear panel data analysis. Environmental Research, 216 (October 2022) 114575. . https://doi.org/10.1016/j.envres.2022.114575.
- Wang, Q., Zhang, F., & Li, R. (2023). Revisiting the environmental kuznets curve hypothesis in 208 counties: The roles of trade openness, human capital, renewable energy and natural resource rent. Environmental Research, 216, 114637. https://doi.org/10.1016/j.envres.2022.114637
- Westerlund, J. (2007). Testing for error correction in panel data. Oxford Bulletin of Economics and Statistics, 69(6), 709–748. https://doi.org/10.1111/j.1468-0084.2007.00477.x
- Wooster, R. B., Dube, S., & Banda, T. M. (2011). The contribution of intra-regional and extra-regional trade to growth: Evidence from the European Union. SSRN Electronic Journal, 23(1), 161–182. https://doi.org/10.11130/jei.2008.23.1.161
- Zahonogo, P. (2017). Trade and economic growth in developing countries: Evidence from sub-Saharan Africa. Journal of African Trade, 3(1–2), 41. https://doi.org/10.1016/j.joat.2017.02.001
Appendix
Figure 1 Economic Growth of the ASEAN LMI from 1996 to 2019.
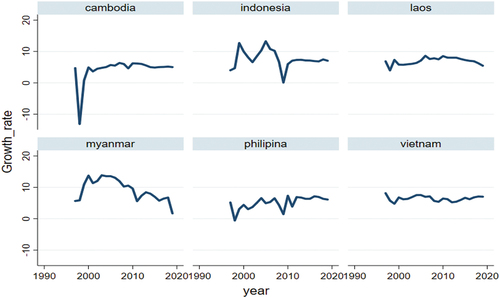
Figure 2 Human Development Index of the ASEAN LMI from (1996 to 2019).
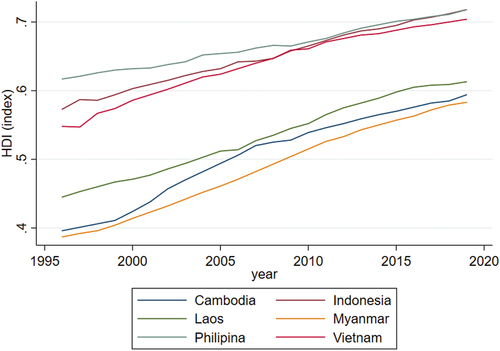
Figure 3 Corruption Control of the ASEAN LMI from (1996 to 2019).
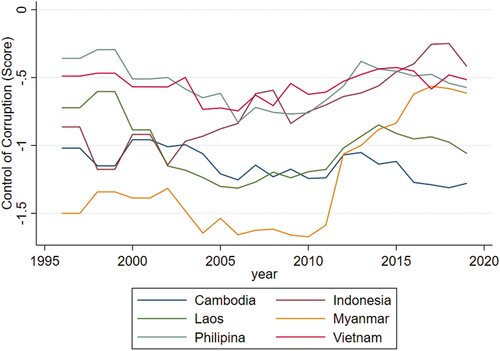
Figure 4 Inter-regional trade of the ASEAN LMI from 1996 to 2019.