
 ?Mathematical formulae have been encoded as MathML and are displayed in this HTML version using MathJax in order to improve their display. Uncheck the box to turn MathJax off. This feature requires Javascript. Click on a formula to zoom.
Abstract
The study assesses how ICT modulates the effect of informal sector on income inequality and investigates critical mass or threshold of ICT at which the diffusion of information with mobile cellular reduce income inequality. The ICT indicators are the regional ICT development index (RIDI), computer penetration and mobile cellular penetration. The empirical strategy used is Generalized Method of Moments (GMM). Covering panel data from 460 districts/cities in Indonesia for 2015–2019, the study shows that ICT measures of RIDI and computer penetration directly exacerbate income inequality, otherwise mobile cellular penetration directly reduces it. Enhancing ICT beyond certain thresholds is necessary for ICT to modulate informal sector to reduce income inequality. The corresponding ICT thresholds for the reduction of income inequality is 32.78 mobile cellular penetration per 100 people. The established thresholds make economic sense and can be feasibly implemented by policy makers to induce favourable effects on income inequality.
1. Introduction
Information and communication technology (ICT) is developing very rapidly, bringing drastic changes to the dissemination of information and communication throughout the world. ICT has a critical role in the global economy (Lee et al., Citation2005; World Bank, Citation2016), promotes economic prosperity and minimizes income inequality (Asongu et al., Citation2019; Ofori & Asongu, Citation2021; Ofori et al., Citation2022b). The wider use of ICT provides hope for reducing economic inequality. Technology is considered an equalizer that will increase access to education, jobs, and finance for people from all walks of life (Deloitte, Citation2018). However, there is skepticism regarding how ICT might help lessen economic disparity. Despite the fact that technological advancements are intended to alleviate poverty, inequality, and social exclusion, inequality and social exclusion continue to rise (Bach et al., Citation2013).
ICTs are causing a shift to more flexible work structures and contributing to an increasing prevalence of precarious or informal working conditions (Bruckner et al., Citation2017). Better access to the high-speed internet has altered the structure of work, allowing for greater access to information, increased connectedness, and improved business process efficiency. This allows for greater job flexibility for both workers and employers. Working from home has also become more convenient thanks to advances in technology. Technology also enables increased fragmentation of company models, such as by employing a contingent of people who labor on demand for a set amount of time, such as freelancers (Valsamis et al., Citation2016).
The rapid spread and acceptance of ICTs such as cellular phones is fueled by a range of types and prices of cellular phones that make them affordable to low-income individuals, as well as a reduction in cellular tariffs as a result of fierce rivalry among cellular phone carriers. Most people, even workers in the informal sector such as small dealers and housewives, can utilize user-friendly cellular phones because they just require basic literacy. Cell phones help informal workers save time and money by replacing travel with phone calls, which speeds up information flow and decision-making. Furthermore, it will be able to access a larger number of clients for the sale of goods and services, as well as for the acquisition of raw materials. Cell phones are used by many small traders, retailers, carpenters, and other informal workers to manage their businesses.
Technological advancement is the cause of rising economic inequality in diverse countries. The increase in the Gini ratio—a measure of income distribution—during the early 1980s may be attributed to technological advancements (Jaumotte et al., Citation2007). The worldwide Gini ratio has declined in recent years, from 0.80 in 1988 to 0.65 in 2013, indicating a decrease in global inequality between countries (World Bank, Citation2017). However, income inequality has increased in the majority of the 51 nations studied (Jaumotte et al., Citation2013). This phenomenon presents a paradox: do ICTs drive economic growth and lead to a reduction in global inequality while at the same time contributing to an increase in domestic income inequality? Despite the contradiction, the impact of ICTs on income growth and poverty reduction is obvious, and more adoption of ICTs by low-income groups will accelerate income growth at the bottom of the economic pyramid (Pepper & Garrity, Citation2015).
The purpose of this research is to explore if the informal sector’s adoption of ICT has a positive impact on income distribution in Indonesia, as well as to investigate the critical mass or threshold for ICT to reduce income inequality. Indonesia is an essential research topic because it is Southeast Asia’s largest internet market. Indonesia is the world’s fourth most populous country, with 270.2 million people (BPS, Citation2021). Indonesia is not only the largest ASEAN economy ($1.1 trillion nominal GDP), but it is also the only Southeast Asian country to rank among the world’s top 15 economies. However, the high GDP has not been matched by an even distribution of income.
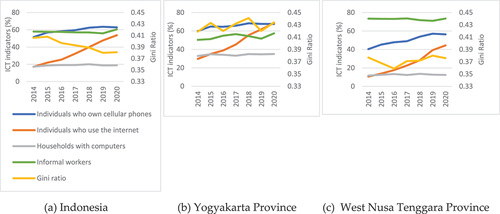
Figure shows that the contradiction at the world level also occurred in Indonesia, where national inequality fell but increased in some provinces as ICT adoption expanded, such as computer ownership, cellular phone ownership, and internet use. In Indonesia, the Gini ratio decreased from 0.406 in 2014 to 0.381 in 2020. In West Nusa Tenggara province, the Gini ratio increased from 0.377 in 2014 to 0.38 in 2020. The Gini ratio in the Yogyakarta province is the highest in Indonesia, where the value tends to fluctuate from 2014 to 2020. ICT indicators such as the percentage of individuals who own cellular phones, individuals who use the internet, and the percentage of households with computers have increased from 2014 to 2020. In Indonesia, the number of informal workers decreased from 57.92% in 2014 to 55.88% in 2019. However, this figure increased in 2020 to 60.47% due to the impact of the COVID-19 pandemic. This pattern also occurs in Yogyakarta, West Nusa Tenggara, and other provinces. So, it is obvious that the big challenge for Indonesia is to take advantage of ICT advances to reduce income inequality for a huge population spread across the sprawling archipelago nation.
Figure 1. Trend of Gini ratio, informal workers, and ICT indicators, 2014–2020.
This study varies from the few other studies on ICT and inequality in three major respects. First, the impact of ICT on inequality is investigated through the informal sector’s adoption of ICT. It is based on recent data from 460 districts/cities in Indonesia, an unusual research scale. Previous studies estimating the role of ICT on income distribution through the transmission of education and lifelong learning were conducted by Tchamyou et al. (Citation2019a), financial access by Tchamyou et al. (Citation2019a), financial inclusion by Mushtaq and Bruneau (Citation2019), the informal sector by Dell’anno and Solomon (Citation2014) at the country level and several studies examine direct effect of ICT on inequality, such as the study by Jing et al. (Citation2019) and Richmond and Triplett (Citation2018). Second, we employ three ICT indicators: the regional ICT development index, computer penetration, and mobile cellular penetration. Previous studies such as Dell’anno and Solomon (Citation2014) used the ratio between investment in telecoms with private participation and GDP; the number of Internet users per 100 people; and the ratio of patent applications by patent office as a proxy of ICT. Tchamyou et al. (Citation2019b) measured ICT using mobile phones, the internet, and a fixed broadband subscription. The study’s findings reveal how the three ICT indicators have diverse implications on inequality. Third, we estimate the ICT threshold for mobile cellular penetration, where if mobile cellular penetration surpasses the threshold then ICT adopted by the informal sector will have a favorable influence on inequality in Indonesia. This study is different from previous studies that estimate the critical mass of telecommunications infrastructure on economic growth (Roller & Waverman, Citation2001); critical mass broadband infrastructure investments on economic growth (Koutroumpis, Citation2009); and ICT thresholds to mitigate inequality in order to enhance gender economic participation (Asongu & Odhiambo, Citation2020).
2. Literature review
2.1. ICT and the informal sector
Technology diffusion will have a significant effect on ICT’s impact on the informal sector, especially in rural areas, household-based companies, and small-scale producers and service providers, where informal employment is most widespread (Bruckner et al., Citation2017). In the informal sector, ICT can have a range of implications. First, ICT can boost the amount of output in homes and small businesses, leading to the creation of new businesses. The use of ICTs can also help the formal sector grow while the informal sector shrinks in both relative and absolute terms (Garcia-Murillo & Velez-Ospina, Citation2017; La Porta & Shleifer, Citation2014; Mbuyisa & Leonard, Citation2016). Second, ICTs such as cell phones help rural and informal employees obtain critical information about prices and market conditions, as well as keep in touch with customers, hence increasing revenue potential and opportunities to transition into the formal sector (Bruckner et al., Citation2017). However, in both developed and developing nations, the increased use of digital platforms is resulting in the introduction and quick rise of new informal jobs (ILO, Citation2016).
2.2. Informal sector and income distribution
The informal sector has the potential to sway income distribution. Workers in the informal sector are under-protected, without a formal work contract, and do not pay taxes, decreasing the effectiveness of the government’s redistributive programs. A sufficiently high level of informality will reduce government revenues and put pressure on public finances, reducing the standard and quantity of products available to the general public (Gërxhani, Citation2011; Schneider & Enste, Citation2000) and possibly increasing income inequality (Belev, Citation2003; Chong & Gradstein, Citation2007; Rosser et al., Citation2000). The informal economy, specifically, causes challenges since informal employees and manufacturers don’t pay taxes and instead use public services for free. Within the provision and allocation of public resources, this can be a source of inefficiency. Insufficient public investment in physical (infrastructure), human (education, research), and social capital (poverty programs, judicial system) is hampered by lower tax revenues (Dell’anno, Citation2016).
On the other hand, the informal sector has the potential to supply jobs and boost income for people (Smith, Citation2002), particularly for the poor (Huynh & Nguyen, Citation2020). The informal sector absorbs unemployment from the formal sector, provides a source of income, and allows unskilled employees to build human capital. Informal activities, in this scenario, provide employment for people with low incomes and few job opportunities. Thus, the informal sector can have a positive impact on income distribution (Eilat & Zinnes, Citation2002).
A previous study on the relationship between the informal sector and income distribution produced mixed results, which could be owing to difficulties in measuring income distribution and informal sector proxies, as well as the nonlinear interaction between variables. Several studies showed positive relationships (Chong & Gradstein, Citation2007; Rosser et al., Citation2000); negative relationships (Dell’anno, Citation2016); insignificant results (Eilat & Zinnes, Citation2002); or ambiguous results (Dell’anno & Solomon, Citation2014). Elgin and Elveren (Citation2021) showed a negative correlation in developed nations and a positive correlation in developing countries. However, Romero (Citation2007) found a positive correlation in developed countries and a negative correlation in developing countries.
3. Methodology
3.1. The regional ICT development index: factor analysis
ICTs are a vector of social development and change (Sujarwoto & Tampubolon, Citation2016) as they expand access to basic services for people (Falch & Henten, Citation2018) and generate new work opportunities. ICT encompasses not only access and infrastructure but also the use of ICT for a wide range of activities (Alizadeh & Farid, Citation2017; Goncalves et al., Citation2018; Van Deursen et al., Citation2015). In order to classify the interdependencies between all of the ICT variables, we thus employ factor analysis (FA) to derive a composite indicator named “The regional ICT development index (RIDI)”. FA is a multivariate statistical technique that allows for the study and detection of interdependencies between a large number of variables by aggregating them using common and special factors that are not explicitly observable. FA is a particularly suitable statistical method for analyzing digital development (Corrocher & Ordanini, Citation2002; Cruz-Jesus et al., Citation2012, Citation2016; Lucendo-Monedero et al., Citation2019; Song et al., Citation2020). We can see the KMO and Bartlett’s test, eigen values, component loadings, and weights for indicators used to compute RIDI in Appendix Tables , respectively. Table shows the variables that make up the RIDI based on Susenas data. On the other hand, consistent with the literature on ICT (Adams & Akobeng, Citation2021; Asongu et al., Citation2019; Asongu et al., Citation2020), we also proxy ICT measures with mobile cellular penetration rate per 100 inhabitants and the percentage of households with a computer at home (computer penetration rate).
Table 1. Variables used to construct RIDI
3.2. Model specification
To investigate the impact of ICT and the informal sector (IS) on income inequality, we use a two-step system Generalized Method of Moments (GMM) estimate technique. It is based on Roodman (Citation2009), which is a follow-up to Arellano and Bover (Citation1995). We introduce an interaction term between IS and ICT to illustrate that ICT allows the IS to reduce income inequality. The selection of the GMM as an empirical technique in our investigation is motivated by three factors: first, the structure of the panel data in this study is consistent with the GMM, so that cross-country variations are not excluded. Second, the number of cross sections (N) in this study is greater than the number of time series (T), with N = 460 and T = 3, indicating that the GMM conditions are met. The empirical model is estimated for 460 districts/cities for the periods 2015, 2017, and 2019. Third, GMM is a robust technique because it controls endogeneity through instrumentation (simultaneity) and takes into account time-invariant omitted variables. This method also limits over-identification and allows for cross-sectional dependencies to be controlled (Baltagi, Citation2008). According to Brambor et al. (Citation2006), the constituent pieces have all been integrated into the specification. In this work, a two-step technique is employed to control for heteroscedasticity because the one-step procedure only takes into consideration homoscedasticity. At the level (equation 1) and first difference (equation 2), the estimation technique can be expressed as follows:
where, is the palma ratio as a measurement of income inequality of district i in period t;
is the informal sector (percentage of informal workers);
represents ICT indicators (RIDI, mobile cellular penetration rate and computer penetration rate);
is the interaction between IS and ICT
;
represents the vector of control variables (gross regional domestic product per capita, mean years of schooling and the number of productive age population);
is a constant;
is the lagging coefficient (due to issues in degree on freedom, it is equal to one in this study);
is the time-specific constant;
is the district-specific effect, and
is the error term.
We adopt the Palma ratio as a measure of income inequality, as recommended by the literature on inequality Asongu et al., Citation2019, , Citation2020; Ofori et al., Citation2022a; Citation2022c; Ofori et al., Citation2021). Because the population in between (deciles 5–9) is mostly steady or not vulnerable to change, the Palma ratio gauges the income share of the richest 10% to the poorest 40%. This is clearly not the same as computing the Gini ratio, which is more sensitive to changes in the middle-income group’s income distribution. The Palma ratio focuses on income changes at the top and bottom of the income scale (Cobham et al., Citation2016). We use the Gini ratio as an alternative measure of income inequality to evaluate the robustness of our estimates of the Palma ratio, as recommended by Ofori et al. (Citation2022c).
We control for characteristics that could potentially affect income inequality, such as gross regional domestic product (GRDP) per capita, mean years of schooling (education), and the number of productive age populations (15–64 years). Following the seminal work of Kuznets (Citation1963), we model income inequality as a function of average income measured by GRDP per capita. We also include education in our model because education is an efficient way to mitigate inequality (Abdullah et al., Citation2015; Tchamyou et al., Citation2019b). Based on previous studies, it is stated that population aging is the key factor contributing to income inequality in East Asia, Japan, and Korea (Deaton & Paxson, Citation1997, Citation1998, Citation2000; Ohtake & Saito, Citation1998; Richmond & Triplett, Citation2018; Zhan et al., Citation2021). Since income inequality is greater among the elderly than among the young and middle-aged, an increase in the proportion of the elderly (population aging) may worsen national income inequality (Shirahase, Citation2015). The study by Richmond and Triplett (Citation2018) used the percentage of the population aged 65 years and over in the model. Unlike prior research, this one takes a look at the productive-age population (15–64 years). The productive age population in Indonesia reaches 70.72 percent (BPS, Citation2021). It is hypothesized that the productive age population can reduce income inequality.
3.3. Data and variables
We analyse a sample of 460 Indonesian districts/cities from 2015 to 2019. Three data sources are used: (i) the National Socioeconomic Survey (Susenas) for income inequality and ICT variables; (ii) the National Labor Survey (Sakernas) for the percentage of people working in the informal sector; and (iii) data from the Indonesian Statistics Agency (BPS) for GRDP per capita, mean years of schooling, and the number of productive age population (15–64 years). The descriptive statistics for the variables are presented in Table .
Table 2. Summary statistics (2015–2019)
4. Results and discussion
4.1. Indonesia’s regional ICT development index
According to the calculated RIDI, ICT development inequality at the Indonesian district level has decreased significantly between 2015 and 2019. Figure shows the significant differences in ICT levels between Indonesian districts. In 2015, the RIDI score for Jakarta Selatan, Yogyakarta, and Tangerang Selatan was 5.96, almost double the national average. On the other hand, the RIDI score of NTT Province’s Sabu Raijua, Sumatera Utara Province’s Nias Selatan, and Papua Province’s Pegunungan Bintang were less than 2, or almost half of the national average. Regarding the spatial distribution, the ICT level in East Indonesia is relatively low, and the densely populated areas in West Indonesia have a relatively high ICT level. Districts/cities with high RIDI scores were concentrated in western locations such as Java, some districts in Sumatra, and central regions such as East Kalimantan. Low RIDI districts are mainly located in mountainous rural areas, extended areas, remote areas and archipelago such as Pegunungan Bintang, Sabu Raijua, South Nias, Mentawai Islands, Aru Islands.
Figure 2. The regional ICT development index, 2015 & 2019.
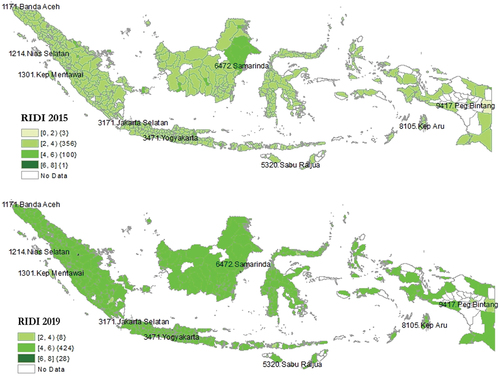
Between 2015 and 2019, ICT development spread across the whole western region, starting in the core areas covered by the DKI Jakarta Province, Tangerang Selatan, Yogyakarta, Banda Aceh, and Samarinda, and eventually moving to the central and eastern regions. Western areas had high ICT levels throughout this time, and the RIDI score of provincial capital cities remained much higher than the rest of the provinces. Finally, ICT improvement shifted steadily from core cities to surrounding cities/districts between 2015 and 2019.
The findings reveal that between 2015 and 2019, the gap in Indonesia’s ICT development has shrunk significantly. Between Jakarta Selatan (highest) and Pegunungan Bintang (lowest), the absolute RIDI difference is 4.12, corresponding to a three-fold relative difference. The RIDI difference between Yogyakarta (highest) and Pegunungan Bintang (lowest) was reduced to 1.8 times in 2019, resulting in a relative difference of 2.88. The district ICT divide in Indonesia has generally continued to narrow, as shown by both the RIDI relative gap and coefficient of variation (CV). There was a noticeable decrease in CV from 0.241 in 2015 to 0.114 in 2019. Districts/cities that are less developed expand more quickly than those that are more developed. RIDI grows at a 3.56 percent yearly pace in developed cities, but at a 13.79 percent rate in less developed areas. This pattern indicates that less developed districts are catching up to highly developed cities, or that Indonesian regions are convergent. By establishing an economic network of cities using ICT, the economic distance between developed and less developed cities can be efficiently reduced. This result is in line with Chen and Ye (Citation2021) and Kartiasih et al. (Citation2022, Citation2023) who found that less developed cities prefer the ICT dividend over developed ones. This may not be aligned with the results of relevant studies on countries. Developed countries with higher incomes have a higher ICT development status and receive more ICT dividends than undeveloped countries (Doong & Ho, Citation2012; Haini, Citation2020). Saba and David (Citation2020) discovered panel convergence at both the global (205 countries) and regional levels (except for Sub-Saharan Africa and South Asia, which exhibited divergence).
4.2. The role of ICT and informal sector on income distribution
The empirical results are presented in Table and are based on the two-step system GMM methodology. The Hansen test for instrument validity and the serial correlation test for second-order serial correlation are used to validate our equation specification for regression. The results of the tests indicate that our instruments are reliable and that our estimation does not contain any evidence of second-order serial correlation. The definitions of variables having Palma ratio as a dependent variable are listed in the first column. The results are presented in Table , which is organized so that each ICT indicator has three different types of specifications. The first is an RIDI, the second is a computer penetration, and the third is a cellular penetration.
Table 3. Results on the effects of ICT and the informal sector on income inequality (Dependent variable: Palma ratio)
The findings demonstrate that RIDI and computer penetration have a direct positive and substantial impact on income inequality, but mobile cellular penetration has a direct negative and significant impact. The net impact of ICT in modulating the influence of the informal sector on income inequality is calculated in order to determine the overall incidence of ICT in modulating the effect of the informal sector on income inequality. For instance, in the fourth column of Table , the net impact from the role of mobile cellular penetration in modulating the effect of informal sector on Palma ratio is. The mean value of mobile cellular penetration is 52.92; the unconditional influence of the informal sector is 0.3901; and the interactive effect of mobile cellular penetration and the informal sector is
in this calculation. In the summary statistics, the mean value may be obtained (Table ). Otherwise, the contribution of the RIDI and computer penetration in reducing the impact of the informal sector on income inequality are insignificant. This could imply that the factors have not yet achieved the threshold needed to have a favorable impact on income distribution. All of the control variables, such as GRDP per capita, education, and population, are statistically significant in terms of lowering income inequality.
Negative conditional or interaction effects are linked to net positive income distribution effects. As a result, the negative conditional effects suggest that increasing ICT dynamics above a certain threshold can entirely reduce the accompanying positive unconditional benefits, therefore nullifying the net beneficial impacts. The story on critical mass or thresholds is consistent with recent development literature, which is based on interactive regressions (Asongu et al., Citation2019, 2020; Batuo, Citation2015).
Based on the previous narrative, the positive threshold in Table ‘s fourth column is 32.78 (0.3901/0.0119) mobile cellular penetration per 100 people. Hence, at this mobile cellular penetration threshold, the corresponding net effect on income distribution becomes . Therefore, above the established threshold, mobile cellular penetration modulates informal sector to reduce income inequality. Furthermore, this policy threshold should be within the statistical range (i.e., minimum to maximum) revealed in the summary statistics to make economic sense and have meaningful policy relevance. As a result, the established threshold is realistic because the minimum and maximum mobile cellular penetrations are 8.48 and 78.73, respectively. As a result, ICT needs to be improved above established thresholds in order to completely reduce the positive unconditional impacts of the informal sector on income inequality, resulting in overall negative net effects on income inequality.
Overall, it is apparent from the findings in Table that ICT modulates the informal sector to engender positive synergy effects on income inequality. Positive synergy effects build on the perspective that the informal sector’s conditional (i.e., interactive) effects on income inequality are negative. This conception of synergy is in line with the current literature on interaction regressions (Ofori & Asongu, Citation2021; Oforiet al., Citation2022a; Citation2022c).
Why do the RIDI and computer penetration have a different impact on income inequality than mobile cellular penetration? This could be due to a number of factors, the first of which is that the RIDI and computer penetration of districts/cities in Indonesia has not yet reached a certain point or threshold, preventing it from providing benefits or modulating the informal sector to lessen income inequality. The mean of the three variables reflects this. In 2019, the mean RIDI was 4.10, and computer penetration was only 19.56, far lower than the mean cellular phone penetration of 52.82 per 100 people. Second, there is a relatively high disparity in the RIDI and computer penetration amongst Indonesian districts/cities, exacerbating income inequality. The computer penetration coefficient of variation (CV) is 0.53, whereas the CV of mobile cellular is 0.19 (see Table ). According to Lindsay (Citation2005), advancements in ICT design may have an impact on income distribution in an environment where there is inequality of opportunity in terms of class, gender, education, and income. This is the so-called Matthew Effect, in which those who “have” expand their opportunities while those who “don’t” feel progressively disempowered and alienated from society (Tewathia et al., Citation2020).
It is also necessary to pay close attention to the behavior or activities carried out by informal workers when accessing the internet. In Figure , it can be seen that informal workers who access the internet using computers were 37% in 2015 and decreased to 19% in 2019. Internet use in 2019 was mostly used to access information (27%), social media (27%), and entertainment (16%). The remainder is used to send or receive email, e-commerce, and e-banking, respectively, at 11%, 9%, and 9%.
Figure 3. Informal workers’ Internet usage by device and activity, 2015 & 2019.
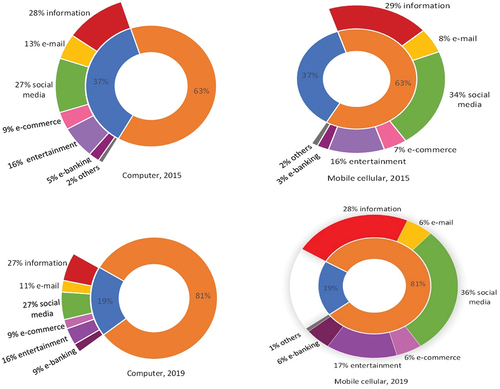
On the other hand, informal workers accessing the internet using cellular phones was 63% in 2015 and increased to 81% in 2019. The composition of internet activities using mobile cellular is not much different from computers. However, the use of the internet for social media is higher, while for sending or receiving email, e-commerce, and e-banking, the proportion is lower. In the informal sector, the use of mobile phones dominates computers. Mobile phones are more popular among informal laborers since they are more user-friendly, have lower pricing, and do not require special expertise to operate.
When ICT is employed for productive purposes, both employers and informal employees benefit. They use social media to purchase and sell items as well as promote them. Homestay owners and small travel companies can offer their services to travelers through social media platforms such as Facebook. Small businesses and home-based food businesses can better engage with their customers by using WhatsApp or Instagram. In terms of payments, small traders and street vendors accept non-cash payments, where customers can pay via e-wallets such as OVO, GoPay, LinkAja, and DANA. The purchasing and selling procedure has been shortened and simplified thanks to mobile cellular-based money transfer and transaction services. As a result, making technology more accessible can help informal firms compete not only with one another but also with formal ones (Bhattacharya, Citation2019; Chen, Citation2016). As a result, ICT adoption in the informal sector will improve Indonesia’s income distribution.
4.3. Robustness checks: results using Gini ratio as dependent variable
We also employ the Gini ratio as an alternative income inequality indicator to evaluate the robustness of our estimates. Our estimates as reported in Table are consistent with the main results (i.e., the Palma ratio estimates) reported in Table . For instance, we find that RIDI and computer penetration are positive and statistically significant, suggesting that both variables worsen income inequality in Indonesia. On the other hand, mobile cellular penetration is negative and statistically significant, suggesting that mobile cellular penetration reduces income inequality. Similar to our results on the Palma ratio, all of the control variables, such as GRDP per capita, education, and population, are statistically significant in terms of reducing income inequality.
Table 4. Results on the effects of ICT and the informal sector on income inequality (Dependent variable: Gini ratio)
The results show that the interaction between mobile cellular penetration and the informal sector is relevant to reducing income inequality, as we found in Table . The net impact of the role of mobile cellular penetration in modulating the effect of the informal sector on the Gini ratio is . The mean value of mobile cellular penetration is 52.92; the unconditional influence of the informal sector is 0.0329; and the interactive effect of mobile cellular penetration and the informal sector is
in this calculation. These results indicate that additional income inequality-reducing effects of the informal sector can be attained with ICT utilization.
As shown in the fourth column of Table , the positive threshold is 54.83 (0.0329/0.0006) mobile cellular penetration per 100 people. Hence, at this mobile cellular penetration threshold, the corresponding net effect on income distribution becomes . Therefore, mobile penetration above the set threshold reduces income inequality by modulating the informal sector. The specified threshold is reasonable because the minimum and maximum mobile cellular penetrations are 8.48 and 78.73, respectively. Overall, we show that ICT forms significant synergy with the informal sector, and this can prove useful for reducing income inequality in Indonesia.
5. Conclusions
The study assesses how ICT modulates the effects of the informal sector on income inequality in a panel of 460 districts/cities in Indonesia over the period 2015–2019. The three ICT indicators used are: RIDI, computer penetration, and mobile cellular penetration. The two-step system Generalized Method of Moments is used for the empirical analysis.
This study makes three contributions to Indonesia’s regional literature on income inequality. First, this study analyzes the impact of ICT on inequality in the informal economy. It is based on recent data from 460 Indonesian districts/cities, which is an exceptional research scale. Previous studies estimating the role of ICT on income distribution through the transmission of education and lifelong learning were conducted by Tchamyou et al. (Citation2019b), financial access by Tchamyou et al. (Citation2019a), financial inclusion by Mushtaq and Bruneau (Citation2019), and the informal sector by Dell’anno and Solomon (Citation2014) at the country level. Second, we employ three ICT indicators: the regional ICT development index, computer penetration, and mobile cellular penetration. Third, we estimate the threshold for ICT to reduce income inequality.
The findings reveal that the RIDI and computer penetration directly aggravate income inequality, but mobile cellular penetration reduces it. Because the threshold has not yet been reached, the RIDI and computer penetration have not been able to deliver benefits to income distribution. It is also discovered that negative net effects in the role of mobile cellular penetration in modulating the effect of informal sector on income inequality is significant. Fortunately, the corresponding conditional or interaction effects are favourable, indicating that increasing ICT beyond certain thresholds might cancel out the positive unconditional effects of the informal sector on income inequality, changing the signs of established net effects. As a result, with the defined ICT thresholds, improving ICT has a broader impact on modulating informal sector dynamics and reducing income inequality in Indonesia. The minimum ICT threshold for the reduction of income inequality is 32.78 mobile cellular penetration per 100 people. Overall, we show that ICT modulates the informal sector to engender positive synergy effects on income inequality.
This study has several limitations. The first is related to sample limitation. In Indonesia, there are 514 districts, yet we could only quantify 460 of them. There was no data for the remaining 54 districts, mostly expanded districts. The second is the small number of variables used to construct RIDI (only 10). If more variables or indicators were available, statistical analysis of the ICT development of Indonesian districts would be more accurate and robust.
The findings suggest that it is imperative to enhance ICT penetration to modulate the informal sector to effectively reduce income inequality. Since the significant progress in ICT is beneficial to districts and cities, we recommend that central and local governments increase their investments in ICT infrastructure. Also, we recommend that the central government further promote 12-year compulsory education to ensure citizens have basic knowledge and skills regarding ICT use. Investing in education and better ICT access will, in the long run, reduce inequality. In addition, a policy framework favoring ICT might be supplemented by policies to encourage the formalization of the informal sector. Several policy efforts to support this are by providing broad access to relevant digital content, easy access to business credit, and facilitating other financial access so that the informal sector can increase its business scale (Bhattacharya, Citation2019; Nguimkeu & Okou, Citation2021). With such a supportive policy environment, ICT penetration thresholds may be lower than previously estimated.
Correction
This article has been corrected with minor changes. These changes do not impact the academic content of the article.
Disclosure statement
No potential conflict of interest was reported by the author(s).
Additional information
Funding
References
- Abdullah, A., Doucouliagos, H., & Manning, E. (2015). Does education reduce income inequality? A meta-regression analysis. Journal of Economic Surveys, 29(2), 301–18. https://doi.org/10.1111/joes.12056
- Adams, S., & Akobeng, E. (2021). ICT, governance and inequality in Africa. Telecommunications Policy, 45(10), 102198. https://doi.org/10.1016/j.telpol.2021.102198
- Alizadeh, T., & Farid, R. (2017). Political economy of telecommunication infrastructure: An investigation of the national broadband network early rollout and pork barrel politics in Australia. Telecommunications Policy, 41(4), 242–252. https://doi.org/10.1016/j.telpol.2017.02.002
- Arellano, M., & Bover, O. (1995). Another look at the instrumental variable estimation of error-components models. Journal of Econometrics, 68(1), 29–51. https://doi.org/10.1016/0304-4076(94)01642-D
- Asongu, S. A., Nnanna, J., & Acha-Anyi, P. N. (2020). Inequality and gender economic inclusion: The moderating role of financial access in Sub-Saharan Africa. Economic Analysis and Policy, 65, 173–185. https://doi.org/10.1016/j.eap.2020.01.002
- Asongu, S. A., & Odhiambo, N. M. (2020). Inequality and gender inclusion: Minimum ICT policy thresholds for promoting female employment in Sub-Saharan Africa. Telecommunications Policy, 44(4), 101900. https://doi.org/10.1016/j.telpol.2019.101900
- Asongu, S. A., Orim, S. I., & Nting, R. T. (2019). Inequality, information technology and inclusive education in sub-Saharan Africa. Technological Forecasting & Social Change, 146(April), 380–389. https://doi.org/10.1016/j.techfore.2019.06.006/
- Bach, A., Shaffer, G., & Wolfson, T. (2013). Digital human capital: Developing a framework for understanding the economic impact of digital exclusion in low-income communities. Journal of Information Policy, 3, 247–266. https://doi.org/10.5325/jinfopoli.3.2013.0247
- Baltagi, B. H. (2008). Forecasting with panel data. Journal of Forecasting, 27(2), 153–173. https://doi.org/10.1002/for.1047
- Batuo, M. E. (2015). The role of telecommunications infrastructure in the regional economic growth of Africa. The Journal of Developing Areas, 49(1), 313–330. https://doi.org/10.1353/jda.2015.0005
- Belev, B. (2003). The informal economy in the eu accession countries: Size, scope, trends and challenges to the process of EU enlargement. Centre for Study of Democracy.
- Bhattacharya, R. (2019). ICT solutions for the informal sector in developing economies: What can one expect? Electronic Journal of Information Systems in Developing Countries, 85(3), 1–7. https://doi.org/10.1002/isd2.12075
- Billon, M., Marco, R., & Lera-Lopez, F. (2009). Disparities in ICT adoption: A multidimensional approach to study the crosscountry digital divide. Telecommunications Policy, 33(10–11), 596–610. https://doi.org/10.1016/j.telpol.2009.08.006
- BPS. (2021). Potret sensus penduduk 2020 menuju satu data kependudukan Indonesia. https://www.bps.go.id/publication.html
- Brambor, T., Clark, W. R., & Golder, M. (2006). Understanding interaction models: Improving empirical analyses. Political Analysis, 14(1), 63–82. https://doi.org/10.1093/pan/mpi014
- Bruckner, M., LaFleur, M., Pitterle, L., Gay, D., Ng, P., Cheng, H., & Vergara, S. (2017). The impact of the technological revolution on labour markets and income distribution.
- Chen, M. A. (2016). Technology, informal workers and cities: Insights from Ahmedabad (India), Durban (South Africa) and Lima (Peru). Environment and Urbanization, 28(2), 405–422. https://doi.org/10.1177/0956247816655986
- Chen, C., & Ye, A. (2021). Heterogeneous effects of ICT across multiple economic development in Chinese cities: A spatial quantile regression model. Sustainability, 13(2), 1–13. https://doi.org/10.3390/su13020954
- Chinn, B. M. D., & Fairlie, R. W. (2007). The determinants of the global digital divide: A cross-country analysis of computer and internet penetration. Oxford economic papers, 59(1), 16–44. https://doi.org/10.1093/oep/gpl024
- Chong, A., & Gradstein, M. (2007). Inequality and informality. Journal of Public Economics, 91(1–2), 159–179. https://doi.org/10.1016/j.jpubeco.2006.08.001
- Cobham, A., Schlogl, L., & Sumner, A. (2016). Inequality and the tails: The palma proposition and ratio revisited. Global Policy, 143(1), 25–36. https://doi.org/10.1111/1758-5899.12320
- Corrocher, N., & Ordanini, A. (2002). Measuring the digital divide: A framework for the analysis of cross-country differences. Journal of Information Technology, 17(1), 9–19. https://doi.org/10.1080/02683960210132061
- Cruz-Jesus, F., Oliveira, T., & Bacao, F. (2012). Digital divide across the European Union. Information & Management, 49(6), 278–291. https://doi.org/10.1016/j.im.2012.09.003
- Cruz-Jesus, F., Rosalía, M., Bacao, F., & Oliveira, T. (2016). The education-related digital divide: An analysis for the EU-28. Computers in Human Behavior, 56, 72–82. https://doi.org/10.1016/j.chb.2015.11.027
- Cuervo, V. M. R., & Menéndez, L. A. J. (2006). A multivariate framework for the analysis of the digital divide: Evidence for the European union-15. Information & Management, 43(6), 756–766. https://doi.org/10.1016/j.im.2006.05.001
- Deaton, A. S., & Paxson, C. H. (1997). The effects of economic and population growth on national saving and inequality. Demography, 34(1), 97–114. https://doi.org/10.2307/2061662
- Deaton, A. S., & Paxson, C. H. (1998). Aging and inequality in income and health. The American Economic Review, 88(2), 248–253.
- Deaton, A. S., & Paxson, C. H. (2000). Growth and saving among individuals and households. The Review of Economics and Statistics, 82(2), 212–225. https://doi.org/10.1162/003465300558740
- Dell’anno, R. (2016). Inequality and informality in transition and emerging countries. IZA World of Labor, (December), 1–11. https://doi.org/10.15185/izawol.325
- Dell’anno, R., & Solomon, H. O. (2014). Informality, inequality, and ICT in transition economies informality, inequality, and ICT in. Eastern European Economics, 52(5), 3–31. https://doi.org/10.1080/001287755.2014.1004264
- Deloitte. (2018). The fourth industrial revolution is here-are you ready? Deloitte insights. https://www2.deloitte.com/content/dam/insights/us/articles/4364_Industry4-0_Are-you-ready/4364_Industry4-0_Are-you-ready_Report.pdf
- Doong, S. H., & Ho, S. C. (2012). The impact of ICT development on the global digital divide. Electronic Commerce Research and Applications, 11(5), 518–533. https://doi.org/10.1016/j.elerap.2012.02.002
- Eilat, Y., & Zinnes, C. (2002). The shadow economy in transition countries: Friend or foe? A policy perspective. World Development, 30(7), 1233–1254. https://doi.org/10.1016/S0305-750X(02)00036-0
- Elgin, C., & Elveren, A. Y. (2021). Informality, inequality, and feminization of labor. Women’s Studies International Forum, 88(October 2020), 102505. https://doi.org/10.1016/j.wsif.2021.102505
- Falch, M., & Henten, A. (2018). Dimensions of broadband policies and developments. Telecommunications Policy, 42(9), 715–725. https://doi.org/10.1016/j.telpol.2017.11.004
- Garcia-Murillo, M., & Velez-Ospina, J. A. (2017). Icts and the informal economy: Mobile and broadband roles. Digital Policy, Regulation & Governance, 19(1), 58–76. https://doi.org/10.1108/DPRG-02-2016-0004
- Gërxhani, K. (2011). The informal sector in developed and less developed countries: A literature survey. Public Choice, 120(3), 267–300. https://doi.org/10.1023/B:PUCH.0000044287.88147.5e
- Goncalves, G., Oliveira, T., & Cruz, J. F. (2018). Understanding individual-level digital divide: Evidence of an African country. Computers in Human Behavior, 87(May), 276–291. https://doi.org/10.1016/j.chb.2018.05.039
- Haini, H. (2020). Tourism, Internet penetration and economic growth. Journal of Policy Research in Tourism, Leisure and Events, 14(2), 200–206. https://doi.org/10.1080/19407963.2020.1854276
- Harwit, E. (2004). Spreading telecommunications to developing areas in China: Telephones, the internet and the digital divide. The China Quarterly, 180(180), 1010–1030. https://doi.org/10.1017/S0305741004000724
- Huynh, C. M., & Nguyen, T. L. (2020). Shadow economy and income inequality: New empirical evidence from Asian developing countries. Journal of the Asia Pacific Economy, 25(1), 175–192. https://doi.org/10.1080/13547860.2019.1643196
- International Labour Organization. (2016). Non-standard employment around the world: Understanding challenges, shaping prospects. International Labour Organization (ILO). Retrieved from: https://www.ilo.org/wcmsp5/groups/public/—dgreports/—dcomm/—publ/documents/publication/wcms_534326.pdf.
- ITU. (2016). Measuring the information society report 2016.
- Jaumotte, F., Lall, S., & Papageorgiou, C. (2013). Rising income inequality: Technology, or trade and financial globalization? IMF Economic Review, 61(2), 271–309. https://doi.org/10.1057/imfer.2013.7
- Jaumotte, F., Lall, S., Papageorgiou, C., & Topalova, P. (2007) Globalization and inequality: Technology widening rich-poor gap. IMF Research Department. https://www.imf.org/external/ pubs/ft/survey/so//RESA.htm
- Jing, A. H., Ab-Rahim, R., & Ismail, F. (2019). Information and Communication Technology (ICT) and Income Inequality in ASEAN-5 Countries Information and Communication Technology (ICT) and Income Inequality in ASEAN-5 Countries. The International Journal of Academic Research in Business & Social Sciences, 9(9), 359–372. https://doi.org/10.6007/IJARBSS/v9-i9/6303
- Kartiasih, F., Djalal Nachrowi, N., Wisana, I. D. G. K., & Handayani, D. (2022). Inequalities of Indonesia’s regional digital development and its association with socioeconomic characteristics: A spatial and multivariate analysis. Information Technology for Development, 1–30. https://doi.org/10.1080/02681102.2022.2110556
- Kartiasih, F., Djalal, N., Nachrowi Wisana, I. D. G. K., & Handayani, D. (2023). Potret Ketimpangan Digital dan Distribusi Pendapatan di Indonesia Pendekatan Regional Digital Development Index (1st ed.). UI Publishing.
- Koutroumpis, P. (2009). The economic impact of broadband on growth: A simultaneous approach. Telecommunications Policy, 33(9), 471–485. https://doi.org/10.1016/j.telpol.2009.07.004
- Kuznets, S. (1963). Quantitative aspects of the economic growth of nations: VIII. Distribution of income by size. Economic Development and Cultural Change, 11(2, Part 2), 1–80. https://doi.org/10.1086/450006
- La Porta, R., & Shleifer, A. (2014). Informality and development. Journal of Economic Perspectives, 28(3), 109–126. https://doi.org/10.1257/jep.28.3.109
- Lee, S. T., Gholami, R., & Yit, T. (2005). Time series analysis in the assessment of ICT impact at the aggregate level – lessons and implications for the new economy. Information & Management, 42(7), 1009–1022. https://doi.org/10.1016/j.im.2004.11.005
- Lindsay, C. (2005). Employability, services for unemployed job seekers and the digital divide. Urban Studies, 42(2), 325–339. https://doi.org/10.1080/0042098042000316173
- Loo, B. P. Y., & Ngan, Y. L. (2012). Developing mobile telecommunications to narrow digital divide in developing countries? Some lessons from China. Telecommunications Policy, 36(10–11), 888–900. https://doi.org/10.1016/j.telpol.2012.07.015
- Lucendo-Monedero, A. L., Ruiz-Rodríguez, F., & González-Relaño, R. (2019). Measuring the digital divide at regional level. A spatial analysis of the inequalities in digital development of households and individuals in Europe. Telematics and Informatics, 41(April), 197–217. https://doi.org/10.1016/j.tele.2019.05.002
- Mbuyisa, B., & Leonard, A. (2016). The role of ICT use in SMEs towards poverty reduction: A systematic literature review. Journal of International Development, 29(2), 159–197. https://doi.org/10.1002/jid.3258
- Mushtaq, R., & Bruneau, C. (2019). Technology in society microfinance, financial inclusion and ICT: Implications for poverty and inequality. Technology in Society, 59(May 2016), 1–19. https://doi.org/10.1016/j.techsoc.2019.101154
- Nguimkeu, P., & Okou, C. (2021). Leveraging digital technologies to boost productivity in the informal sector in Sub-Saharan Africa. Review of Policy Research, 38(6), 707–731. https://doi.org/10.1111/ropr.12441
- Nishida, T., Pick, J. B., & Sarkar, A. (2014). Japan’s prefectural digital divide: A multivariate and spatial analysis. Telecommunications Policy, 38(11), 992–1010. https://doi.org/10.1016/j.telpol.2014.05.004
- Ofori, I. K., Armah, M. K., & Asmah, E. E. (2022a). Towards the reversal of poverty and income inequality setbacks due to COVID-19: The role of globalisation and resource allocation. International Review of Applied Economics, 1–28. https://doi.org/10.2139/ssrn.3879887
- Ofori, I. K., & Asongu, S. A. (2021). ICT diffusion, foreign direct investment and inclusive growth in Sub-Saharan Africa. Telematics and Informatics, 65(October 2021), 101718. https://doi.org/10.1016/j.tele.2021.101718
- Ofori, I. K., Cantah, W. G., Afful, B., Jr. & Hossain, S. (2021). Towards shared prosperity in sub‐Saharan Africa How does the effect of economic integration compare to social equity policies-2-18.Pdf. African Development Review, 34(1), 97–113. https://doi.org/10.1111/1467-8268.12614
- Ofori, I. K., Dossou, T. A. M., & Akadiri, S. S. (2022b). Towards the quest to reduce income inequality in Africa: Is there a synergy between tourism development and governance? Current Issues in Tourism, 1–21. https://doi.org/10.1080/13683500.2021.2021157
- Ofori, I. K., Osei, D. B., & Alagidede, I. P. (2022). Inclusive growth in Sub-Saharan Africa: Exploring the interaction between ICT diffusion, and financial development. Telecommunications Policy, 46(7), 102315. https://doi.org/10.1016/j.telpol.2022.102315
- Ohtake, F., & Saito, M. (1998). Population aging and consumption inequality in Japan. Review of Income and Wealth, 44(3), 361–381. https://doi.org/10.1111/j.1475-4991.1998.tb00287.x
- Pepper, R., & Garrity, J. (2015). ICTS, income inequality, and ensuring inclusive growth. SSRN Electronic Journal. https://doi.org/10.2139/ssrn.2588115
- Pick, J. B., Sarkar, A., & Johnson, J. (2015). United States digital divide: State level analysis of spatial clustering and multivariate determinants of ICT utilization. Socio-Economic Planning Sciences, 49, 16–32. https://doi.org/10.1016/j.seps
- Richmond, K., & Triplett, R. E. (2018). ICT and income inequality: A cross-national perspective ICT and income inequality: A cross-national perspective. International Review of Applied Economics, 32(2), 195–214. https://doi.org/10.1080/02692171.2017.1338677
- Roller, L.-H., & Waverman, L. (2001). Telecommunications infrastructure and economic development. American Economic Review, 91(4), 909–923. https://doi.org/10.1257/aer.91.4.909
- Romero, R. B. G. (2007). The effects of inequality on the dynamics of the informal economy. Paper Presented at the IZA/World Bank Conference: Employment and Development. Bonn, Germanyhttp://www.Iza.Org/Conference_files/Worldb2007/Gutierrez%20romero_r3380.Pdf .
- Roodman, D. (2009). How to do xtabond2: An introduction to difference and system GMM in Stata. Stata Journal, 9(1), 86–136. https://doi.org/10.1177/1536867x0900900106
- Rosser, J. B., Rosser, M. V., & Ahmed, E. (2000). Income inequality and the informal economy in transition economies. Journal of Comparative Economics, 28(1), 156–171. https://doi.org/10.1006/jcec.2000.1645
- Saba, C. S., & David, O. O. (2020). Convergence patterns in global ICT: Fresh insights from a club clustering algorithm. Telecommunications Policy, 44(10), 102010. https://doi.org/10.1016/j.telpol.2020.102010
- Schneider, F., & Enste, D. H. (2000). Shadow economies: Size, causes, and consequences. Journal of Economic Literature, 38(1), 77–114. https://doi.org/10.1257/jel.38.1.77
- Shirahase, S. (2015). Income inequality among older people in rapidly aging Japan. Research in Social Stratification and Mobility, 41, 1–10. https://doi.org/10.1016/j.rssm.2015.03.001
- Smith, R. S. (2002). The underground economy: Guidance for policy makers. Canadian Tax Journal/RevueFiscale Canadienne, 50(5), 1655–1661.
- Song, Z., Wang, C., & Bergmann, L. (2020). China’s prefectural digital divide: Spatial analysis and multivariate determinants of ICT diffusion. International Journal of Information Management, 52(January 2019), 102072. https://doi.org/10.1016/j.ijinfomgt.2020.102072
- Sujarwoto, S., & Tampubolon, G. (2016). Spatial inequality and the internet divide in Indonesia 2010–2012. Telecommunications Policy, 40(7), 602–616. https://doi.org/10.1016/j.telpol.2015.08.008
- Tchamyou, V. S., Asongu, S. A., & Odhiambo, N. M. (2019b). The role of ICT in modulating the effect of education and lifelong learning on income inequality and economic growth in Africa. African Development Review, 31(3), 261–274. https://doi.org/10.1111/1467-8268.12388
- Tchamyou, V. S., Erreygers, G., & Cassimon, D. (2019a). Inequality, ICT and financial access in Africa. Technological Forecasting & Social Change, 139(November 2018), 169–184. https://doi.org/10.1016/j.techfore.2018.11.004
- Tewathia, N., Kamath, A., & Ilavarasan, P. V. (2020). Social inequalities, fundamental inequities, and recurring of the digital divide: Insights from India. Technology in Society, 61(September 2019), 101251. https://doi.org/10.1016/j.techsoc.2020.101251
- Thompson, H. G., & Garbacz, C. (2011). Economic impacts of mobile versus fixed broadband. Telecommunications Policy, 35(11), 999–1009. https://doi.org/10.1016/j.telpol.2011.07.004
- Valsamis, D., De Coen, A., & Vanoeteren, V. (2016). The Future of Work: Digitalisation in the US Labour Market. In PE (Vol. 578, No. 959). Brussels: Policy Department A: Economic and Scientific Policy, European Parliament.
- Van Deursen, A. J. A. M., Van Dijk, J. A. G. M., & Ten Klooster, P. M. (2015). Increasing inequalities in what we do online: A longitudinal cross sectional analysis of Internet activities among the Dutch population (2010 to 2013) over gender, age, education, and income. Telematics and Informatics, 32(2), 259–272. https://doi.org/10.1016/j.tele.2014.09.003
- World Bank. (2016). World Development Report 2016: Digital Dividends.
- World Bank. (2017). Poverty and shared prosperity 2016: Taking on inequality. https://doi.org/10.3326/pse.41.4.5
- Zhan, P., Ma, X., & Li, S. (2021). Migration, population aging, and income inequality in China. Journal of Asian Economics, 76(June), 101351. https://doi.org/10.1016/j.asieco.2021.101351
Appendices
Table A1. KMO and Bartlett’s test
Table A2. Eigen values and share of variance explained for RIDI, 2019
Table A3. Component loadings and weights for indicators for used to compute RIDI