
 ?Mathematical formulae have been encoded as MathML and are displayed in this HTML version using MathJax in order to improve their display. Uncheck the box to turn MathJax off. This feature requires Javascript. Click on a formula to zoom.
Abstract
The liberalization of economies is aimed at boosting domestic growth through foreign investment and trade. The proponents of liberalization argue that opening up markets in developing economies provides access to capital to enhance production. However, proponents of the pollution haven hypothesis (PHH) argue that liberalization and trade agreements have led to the export of carbon-intensive production from wealthier countries to developing economies. The difference between the two outcomes lies in the nature of fixed assets built by developing countries. In this study, we examine the role of fixed capital formation on carbon emissions during two distinct periods of India’s economic development. India liberalized its economy with trade reforms in 1991, thereby providing two distinct time periods of closed and open trade policies. The economic data during 1971–2021 is divided into two parts—before (1971–1990) and after (1991–2021) liberalization. Gross fixed capital formation (GFCF) is used as a measure of capital formation while carbon emissions are used to represent environmental impact. Auto-regressive distributed lag (ARDL) model is used for analysis. Results indicate that GFCF had no significant relationship with carbon emission before liberalization, whereas, there was a significant, positive impact post-liberalization. The study is of significance to policymakers in developing countries as it suggests a change in the capital formation towards low carbon-intensive products and services. It also strengthens the argument for investing capital in cleaner energy and technologies.
1. Introduction
The impact of trade liberalization on environmental degradation has sparked debate among academicians (Ahmad et al., Citation2019; Etokakpan et al., Citation2020; Khan et al., Citation2019; Prakash & Sethi, Citation2022a; M. M. Rahman, Citation2020; Zubair et al., Citation2020). Ricardo’s theory of comparative cost advantage argues that traders gain through specializing in the production of goods with lower opportunity costs (Ricardo, Citation1817). With concerns regarding environmental degradation yet to take shape, Ricardo’s theory did not consider the impact of trade on climate externalities. Without considering the externalities the theory of comparative advantage argued that both parties gain through trade. However, subsequent researchers pointed out that once the climate externalities are included in the traditional theories, there is no surety of trade leading to net gains (Harris, Citation2004). Rising apprehensions about global warming (UNFCCC, Citation2015) have forced countries to adopt policy measures to curb environmental degradation. These policies include environmental taxes, permits, quotas, and regulations. These curbs have increased production costs in countries with a strong environmental focus. Due to the wide disparity in the implementation of climate regulations across countries, the production of carbon-intensive products shifted towards countries with weak environmental laws. Developing countries such as China, India, and Taiwan gained comparative advantage due to their liberalized economies and weaker environmental laws and became the production hub of manufacturing goods involving high environmental costs. According to modern trade theories, global trade has led to the transfer of emissions from countries with strong environmental laws to those with weaker regulatory structures (Rothman, Citation1998). The pollution haven hypothesis (PHH) (Copeland, Citation2008) explains the evolving trade patterns after considering the environmental externalities and laws. According to this hypothesis, stringent environmental laws force companies to relocate production to countries with weaker environmental laws. It, therefore, follows that developing countries with liberal economic policies and lenient environmental laws hence have a comparative advantage in producing carbon-intensive products (Gökmenoğlu & Taspinar, Citation2016). Developing countries in the earlier stages of liberalization invest in machinery and infrastructure to increase production while the developed economies invest in less resource-intensive assets (Södersten et al., Citation2018).
Countries invest in assets based on their competencies, growth strategies, and trading opportunities. This makes the relationship between capital formation and emission country- or region-specific. For instance, the economic liberalization in India during 1991 aimed at boosting economic growth through private and foreign investment. To encourage domestic production and attract investment, the government reduced import tariffs, lowered taxes, and deregulated markets. The expectation was that liberalization would lead to increased investment in assets which would lead to higher production. Liberalization has increased capital investments both through foreign direct investment (FDI) inflows and domestic investment. FDI has grown 700 times since the economy opened in 1991. The gross fixed capital formation (GFCF) comprising the US$ equivalent of land improvements, plant and machinery, and infrastructure, has sharply increased since 1991 (Figure ). Popular trade theories such as absolute advantage theory and comparative advantage theory postulate that increasing trade from liberalization would enhance growth. Investments in fixed capital have indeed boosted India’s economic growth, making it one of the fastest-growing economies in the world.
Figure 1. Trade, GFCF, and CO2 emissions of India, 1971–2021.
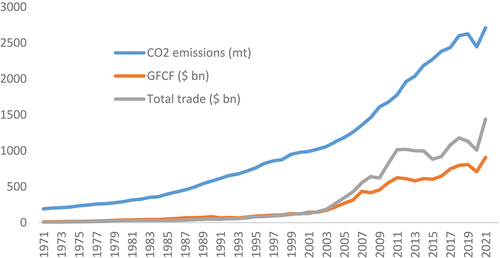
However, India’s reliance on non-renewable energy sources has raised concerns about the long-run impact of liberalization on carbon emissions. The country is heavily dependent on fossil fuels for its energy needs, the main contributor to emissions (Alam et al., Citation2016). 72% of India’s energy needs are met through its coal-fired plants (Central Electricity Authority, Citation2019). The dramatic rise in energy consumption due to the liberalization of economic policies has led to a growth in emissions (Figure ). India’s emissions have been increasing at a cumulative annual growth rate (CAGR) of 4.9% since 1991. Despite production disruptions during the pandemic, India recorded carbon emissions of 2.71 million tons in 2021, a growth of 3.2% compared to pre-pandemic 2019 (World Bank, Citation2021). Following business-as-usual, the country is expected to be dependent on coal for at least 50% of its energy needs until 2050 despite its efforts to boost renewable energy. Hence, policy interventions are essential to ease the coupling between trade and emissions.
Studies covering the nexus between trade liberalization, capital formation, and carbon emissions of developing economies are scanty. This research attempts to understand the impact of liberalization on the emissions of one of the largest emerging economies, India. The paper examines the long-term impact of GFCF on carbon emissions in India. The study utilizes data from 1971 to 2021 which is divided into two parts, pre-liberalization (1971–1990) and post-liberalization (1991–2021). The cointegration between GFCF and carbon emissions is checked using the auto-regressive distributed lag (ARDL) model and ARDL bounds test. An error correction model (ECM) is built to confirm cointegration and check the direction of correction.
Our work contributes to the growing literature on understanding the impact of liberalization on carbon emissions in developing economies. The impact of capital formation on carbon emissions is an essential component in formulating trade policies. The findings will therefore provide evidence for building a sustainable composition mix in developing countries. It also strengthens the argument to invest in long-term assets linked to cleaner production and technologies. The paper is structured into six sections, the next section covers the theoretical framework and the literature review followed by a detailed description of the research methodology in section 3, section 4 covers the results which are further discussed with relevant policy implications in section 5, and we conclude in section 6.
2. Theoretical framework and literature review
2.1. Theoretical framework
According to existing literature, the impact of trade and economic liberalization on the environment can be understood by decomposing the effect into three components, namely, scale, composition, and technique (Harris, Citation2004). The scale component represents the increase in production post-liberalization. With growing external trade, the domestic production in the economy is expected to increase, requiring higher energy consumption and leading to more emissions. The composition components indicate the change in the production combination after trade liberalization. With liberalization, resources are allocated to products offering a comparative advantage. The composition component is expected to have a positive impact if the liberalization leads to more allocation to carbon-intensive industries. Whereas if countries allocate resources to less carbon-intensive industries, the composition component will pull down emissions. As the composition component depends on country-specific production and trade strategies, it is difficult to accurately predict its impact on emissions. The final component is the technique which indicates improvement in the technology used post-liberalization. The improvement in technology could be in the form of cleaner sources of energy, cleaner production processes, or more efficient use of energy. Opening up the economy is expected to provide higher access to new and evolving technologies that were unavailable in the producing country earlier. The new technologies could also boost domestic production of environmentally-friendly technologies.
According to the Environmental Kuznets curve (EKC), the environmental impact is expected to keep increasing during the initial stages of economic growth until a turning point beyond which pollution drops with growth (Grossman & Krueger, Citation1991). With increasing standards of living in the producing countries, it is argued that societies would demand better living conditions, including environmental quality. The impact of trade liberalization on carbon emissions can be explained using the transmission channels shown in Table .
Table 1. Impact of trade liberalization on emissions
As is evident from Table , the components of scale and technique have an opposing influence on emissions, whereas the impact of composition depends on the production combination. The overall impact of trade on emissions depends on the relative strength of each component. Hence, country-level trade and growth strategies have a significant role in determining the impact of trade on emissions. The impact will depend on the nature of fixed assets built by the country to boost production. If the investment is made in carbon-intensive production then there would be an increase in emissions while investment in cleaner production would cause a decrease in emissions.
2.2. Literature review
The nexus between trade liberalization, economic performance and environmental impact have raised much interest among academicians in the recent years (Duan et al., Citation2021; Prakash & Sethi, Citation2022b; Shen et al., Citation2022). The literature on the impact of liberalization on carbon emissions is vast and growing with various empirical and theoretical models developed to assess the impact. A study conducted on the five ASEAN nations showed that FDI inflow post liberalization has a positive impact on carbon emissions (Baek, Citation2016). Similar findings were reported by studies conducted in other Asian economies (Z. U. Rahman & Ahmad, Citation2019). The impact of FDI on emissions has been widely researched through different techniques (Acharyya, Citation2009; Omri et al., Citation2014; Shahbaz et al., Citation2017). The results strongly suggest that FDI has a significant, positive impact on emissions in most regions. Research conducted in China showed that liberalization had a positive impact on carbon emissions during the period 1970–2012 (Shahbaz et al., Citation2017). Similar research conducted in Pakistan for the period 1971–2016 showed that trade openness has a bidirectional causality with emissions (Chandia et al., Citation2018). Shahbaz et al. investigated the cointegration between trade openness and carbon emission taking a panel of 105 countries using an ARDL model (Shahbaz et al., Citation2017). The results confirmed the positive relationship between trade openness and emissions. Similar studies conducted in other geographies reported mixed results on the impact of trade openness on carbon emissions (Antonakakis et al., Citation2017; Appiah, Citation2018; Esso & Keho, Citation2016). The available research about the impact of liberation on emissions in India shows that economic development post-liberalization had adverse impacts on the environment (Dar & Asif, Citation2017). There is a consensus among academicians that economic growth has a significant impact on a country’s carbon emissions. Studies have shown that higher economic growth need not necessarily translate to a reduction in emissions, even in the long run. Empirical studies have shown that an increase in income can lead to steadily rising emissions (Holtz-Eakin & Selden, Citation1995). Though some researchers have also reported no significant relationship between economic growth, trade liberalization and emissions (Richmond & Kaufmann, Citation2006), the majority of the studies agree that economic growth requires higher energy consumption which leads to higher carbon emissions (Alshehry & Belloumi, Citation2015).
Region-specific studies on the nexus between economic growth, economic growth, and emissions have shown mixed reports (Zhang & Cheng, Citation2009). A study conducted on countries in the Middle East and North Africa (MENA) reported a causal relationship between the variables (Omri, Citation2013). Recent literature has extended the variables to include trade openness (Halicioglu, Citation2009). Sohag et al (Sohag et al., Citation2017) concluded that foreign trade led to a drop in emissions only in high-income countries. The study covering 82 countries reported mixed results for low—and middle-income groups. Other researchers studying trade and emissions have also reported a difference in results based on the regions covered. For instance, Managi and Jena (Managi & Jena, Citation2008) reported with empirical evidence that trade helped reduce emissions of technologically advanced countries while increasing it in non-advanced countries. A few studies have also shown a reduction in emissions from developing countries with increasing trade (Jayanthakumaran et al., Citation2012). Considering the contradicting results linking trade and emissions in literature, we can conclude that the direction and extent of the link between foreign trade and emissions are country-specific.
The difference between the countries could be explained based on the nature of capital investment. If the capital is invested in building assets which lower the carbon emissions, then trade will lower carbon emissions whereas if trade leads to import of carbon-intensive production, then trade will cause a hike in carbon emissions. If the capital is invested in low-carbon technologies, composition and technology components will offset the scale effect and will lead to low damage to the environment. Whereas if the capital is invested in carbon-intensive production, scale, and composition will ensure an increase in environmental degradation. The importance of country-specific evidence in establishing the capital formation-emissions nexus motivated the authors to understand the impact of economic liberalization on the relationship between capital formation and carbon emissions in India.
Though researchers have used factors impacting carbon emissions such as population, FDI, GDP, GNI and energy use (Dogan & Turkekul, Citation2016; Shahbaz et al., Citation2017; Shen et al., Citation2022), the relationship between capital formation and carbon emissions has been investigated by only a few researchers. One such study is the research to check the long-term relationship between GCF and FDI on carbon emissions in Pakistan during 1974–2010 using ARDL (Bukhari et al., Citation2014). The results of this study showed that GCF can improve air quality if invested in the adoption of cleaner technologies. However, similar research conducted in five countries of ASEAN showed an increase in GCF, along with FDI, led to higher pollution levels (Baek, Citation2016). This research which covered 1981–2010 used pooled mean group (PMG) estimate to understand the long-term association of carbon emissions on FDI, energy use, and income levels. He proposed using GCF as an alternative to FDI. This study concluded that GCF significantly the environment through enhanced emission in all the five Asian countries studied. As seen in the existing literature, the changing impact of GCF on carbon emissions with trade liberalization has not been studied. Further, such a study on a developing economy like India has not been undertaken. The findings are of significance in understanding whether the capital formation in India post liberalization has lowered or increased the carbon emissions. Hence, this study tries to fill the gap in the existing literature.
3. Data and methodology
3.1. Data
This section describes the data and methodology utilized to investigate the relationship between trade openness, carbon emissions and fixed capital formation in an emerging country, India. Per capita CO2 emission (in ton), the principal greenhouse polluter, is used to quantify emissions. We consider gross fixed capital formation (GFCF) to represent capital formation. In the existing literature covering largely developed economies, energy consumption, per capita income, fixed capital formation, population and foreign trade are used as factors impacting carbon emissions (Alam et al., Citation2016; Alshehry & Belloumi, Citation2015; Dogan & Turkekul, Citation2016). Due to the high correlation between energy consumption, per capita income, population and GFCF (refer Table ), only GFCF is included in our analysis.
Table 2. Correlation between GFCF and other control variables
The definition of the variables used for analysis is provided in Table . Considering the dispersion in the data over the 30 years considered in the study, natural log transformation is used for both CO2 and GFCF.
Table 3. Variable definitions
As India embraced trade liberalization in 1991, the period considered for the study is 1971–2021. This gives us two distinct time periods for studying the impact of capital formation on carbon emissions, namely, pre-liberalization covering 1971–90 and post-liberalization covering 1991–2021. GFCF data for the period 1971–2021 is compiled using the World Bank (WB) database while data on carbon emissions is obtained from the Global Carbon Project (GCP) (Global Carbon Project, Citation2022). GCP is an organization working towards understanding and quantifying the carbon cycle and greenhouse gas emissions and the data is widely used for analysis by academic and industry think tanks.
3.2. Methodology
As discussed earlier, the data is divided into two separate datasets for analysis—pre-liberalization covers the period 1971–90 and post-liberalization covers 1991–2021. For each of the datasets, the stationarity of the variables is confirmed using the Augmented Dickey-Fuller (ADF) unit-root test. If the variables are stationary at level, we can construct regression models to determine the long-term relationship between emissions and capital formation. If there is any non-stationary at level, we need to establish cointegration before modeling the long-term relationship between these variables. The cointegration can either be determined using Johansen’s cointegration or the auto-regressive distributed lag (ARDL) bounds test. The limitation of Johansen’s test is that it requires all the variables to be stationary at first difference. ARDL can be used provided all the variables become stationary at level or first difference. Hence, we proceed with the ARDL model.
As ARDL is based on the vector auto-regressive (VAR) model, it is dependent on the lag selected for analysis. The first step in building the ARDL model is to estimate the optimum lag using various information criteria (Akaike, Schwarz, and Hannan-Quinn). The optimum lag is then used to specify the ARDL model.
In addition to building ARDL, the cointegration is cross-checked through an error correction (ECM) model. Once the ECM model is constructed, the ARDL bounds test is used to determine whether the variables are cointegrated. The causality of the variables is also established using Granger causality tests. If all the tests indicate cointegration, then a long-run relationship exists between the variables which can be built through regression models.
3.3. Modeling
The short-run ARDL model used to check cointegration between carbon emissions (CO2) and GFCF can be written as:
The error correction model (ECM) helps confirm the cointegration and direction of error correction. The ECM model can be represented as:
ECT stands for error correction term. For error correction to happen from GFCF to carbon emissions (and hence cointegration to exist), the coefficient of ECT, θ, should be negative and significant. After running the ECT model, the ARDL bounds test is used to confirm cointegration.
Once cointegration is established using ARDL and ECT, the long-run relationship between the variables can be expressed as:
This is in line with the econometric models used in the literature to explore the relationship between capital formation and emissions. εit is the stochastic error term that is assumed to be normally distributed with constant variance i.e. homoscedastic. The coefficients α2 indicate the impact of the GFCF on carbon emissions with their sign and value showing the direction and extent of the impact, respectively. α0 is the constant parameter. As India is still in the developing stage, we expect α2 to be positive, indicating an increase in emission with an increase in GFCF.
The step-wise methodology including the model building is summarized in Figure .
Figure 2. Step-wise methodology.
The results of the analysis are discussed in the following section.
4. Results
Before providing the model specifications, Table provides the descriptive statistics of carbon emissions and GFCF, before and after log transformation. The descriptive statistics of CO2 and GFCF clearly show the wide variation between the pre- and post-liberalization time periods considered.
Table 4. Descriptive statistics
The results of the stationarity test using the Akaike information criterion are provided in Table . The results need to be interpreted based on the null hypothesis of non-stationary.
Table 5. Results of the ADF unit root test
The necessary condition for ARDL is that none of the variables should be stationary at the second difference i.e. I(2). The stationarity test results in Table show that the variables are stationary at level or the first difference. We can now proceed with ARDL. The first step in the process is to identify the optimum lag length. The optimum lag length as per various information criteria is provided in Table . Based on the table, lag 1 is chosen as the optimum lag for both periods.
Table 6. Identifying optimum lag length
We proceed to construct short-run ARDL with lag 1. EquationEquation 1(1)
(1) can be revised as follows:
The short-run cointegrating form for the two time periods is given in Table . The short-run model clearly indicates that the cointegration equation has a negative coefficient and is significant only in the post-liberalization period. As this is the condition for cointegration, we conclude that cointegration between lnGFCF and lnCO2 is happening only in the post-liberalization period.
Table 7. Short-run model
To confirm cointegration and the direction of error correction, we check the cointegrating form/ECM. Though the ECT coefficient pre-liberalization is significant, it is positive indicating that there was no long-term relationship between carbon emissions and GFCF before liberalization. However, for the post-liberalization period, the coefficient of ECT in Table is negative and significant, indicating error correction happening from GFCF to CO2. The cointegration form is provided in Table . After confirming error correction, the ARDL bounds test is used to confirm cointegration. The 5% and 1% upper bound for F-statistic are 4.16 and 5.58, respectively. As the F-statistic exceeds the upper bound even at 1%, we confirm that the variables are cointegrated.
Table 8. Cointegrating form/ECM
Having established a long-run relationship between GFCF and carbon emissions in the post-liberalization period, we can now proceed to construct the long-run model. The long-run coefficients are provided in Table . The long-run relationship between the variables for the post-liberalization period shows that lnGFCF has a significant, positive impact on lnCO2. The positive coefficient of lnGFCF shows that for every unit change in lnGFCF, the lnCO2 variable changes 0.1250 units. This gives evidence that an increase in fixed capital formation post-liberalization has caused an increase in carbon emissions. The diagnostics run on the long-run regression model shows the validity of the model. DW test and Breusch-Godfrey test results show that the absence of autocorrelation in residuals. The null hypothesis of Breusch-Godfrey test is that there is no serial correlation. As the p-value is greater than 0.05, we are unable to reject the null-hypothesis. Similarly, the ARCH test for checking heteroskedasticity of residuals also indicate that the null hypothesis of the test, i.e., there is no conditional heteroskedasticity, cannot be rejected. The normality of the residuals is confirmed through the Jarque-Bera test, the null hypothesis of which is that the residuals follow a normal distribution.
Table 9. Long-run coefficients
Next, Granger causality tests are used to check causality, the results of which for both periods are given in Table . The results show that GFCF does not granger cause carbon emissions in the pre-liberalization period whereas there is a strong uni-directional causality between GFCF and carbon emissions in the post-liberalization period.
Table 10. Results of Granger causality
The findings along with their policy implications are discussed in the following section.
5. Discussion and policy implications
The results of the stationarity test in Table indicate that both carbon emissions and GFCF become stationary at first difference. This meets the requirement for ARDL i.e., variables being stationary at level or first difference, and none at second difference. Hence, ARDL can be used to check the cointegration between the variables. The significant and negative ECT in Table confirms cointegration in the post-liberalization period, indicating a long-run relationship between GFCF and emissions during the period. The long-run relationship between GFCF and carbon emissions shows a positive influence of GFCF on carbon emissions in the post-liberalization period. According to the long-run relationship, every one-unit change in lnGFCF leads to a 0.1250 unit change in lnCO2.
The findings provide evidence of the positive link between capital formation and emissions post-liberalization i.e., liberalization has led to an increase in carbon-intensive production in India. The increase can be due to the scale or composition of the trade post-liberalization. It is also possible that polluting industries from wealthier economies outsourced production to India following liberalization. If the trade continues without any policy intervention to change the product composition, any further increase in external trade would further worsen carbon emissions. This positive link between trade and carbon emissions has been reported by other countries and regions (Managi & Jena, Citation2008; Shahbaz et al., Citation2017). However, following business-as-usual will be detrimental to attaining climate targets, both global and national, set in Paris Agreement. The positive link between capital formation and emissions indicates that the developing country is in the first half of the EKC (Jayanthakumaran et al., Citation2012; Omri, Citation2013). This could be an indication that the income increase from higher trade post-liberalization has not yet reached the threshold point. Further expansion in income could lead to a drop in emissions as citizens demand cleaner products and processes.
The positive relationship between capital formation and carbon emissions raises concerns about the emission-intensive investments made post-liberalization. GFCF is strongly correlated with energy consumption in India i.e., the increasing investment post-liberalization has also increased energy consumption, a finding consistent with the existing literature (Zhang & Cheng, Citation2009). The positive nexus between energy and carbon emissions is a concern for policymakers. Higher scale and diversification of economic activity post-liberalization have increased energy consumption leading to higher carbon emissions. This is especially concerning for developing economies like India still heavily dependent on fossil fuels. Though the government has set ambitious renewable energy plans, renewable energy sources are still in their embryonic stage in India. Liberalization has been unsuccessful in any significant transfer of energy-efficient technologies to India.
For the post-liberalization period, the ECT confirms the error correction between lnGFCF and lnCO2. Similarly, the Granger causality shows a uni-directional relationship with capital formation granger causing emissions. This is in line with existing literature (Beghin et al., Citation1995). The results provide preliminary evidence to the pollution haven hypothesis i.e., countries with weak environmental laws are viewed as potential production hubs for carbon-intensive products. Though this can be viewed as a comparative advantage in traditional trade theories, these countries will struggle to fulfill the national emission targets set as part of the Paris agreement.
As discussed earlier, the impact of trade on carbon emissions can be analyzed using three components—scale, composition, and technique. The findings of this study show that in developing countries such as India which has recently liberalized its trade policies, the impact of scale and composition outweigh the influence of technique. Trade liberalization and opening up the economy increased the production of carbon-intensive goods, leading to higher emissions. Technology collaboration and transfer could break the link between production and emissions through the enhanced adoption of cleaner technologies (Beghin et al., Citation1995). Unfortunately, the limited adoption of cleaner technologies in India has not been able to neutralize the increase in emissions due to scale and composition components. The alternative option to reducing the environmental impact is to alter the product mix—from carbon-intensive products and technologies to environment-friendly products and cleaner technologies. In addition to altering the product and production processes, it is also essential to shift from fossil fuel energy sources to renewable energy. Enhancing the efficiency of energy utilization (e.g. smart metering) is also an area of focus for developing countries. The policymakers in these countries should bring in incentives for investment in cleaner technologies.
Along with reevaluating the product mix, it is also essential for countries to build robust national policies, institutions, and governance structures to limit emissions. While being stringent on the misuse of natural resources, the regulations should encourage and support green investments. Many developing countries have initiated schemes to attract investments, particularly in the production of renewable energy. The policy framework should enhance the confidence of investors in providing finance to emerging technologies to reduce emissions, improve energy efficiency and build carbon sinks. The increasing private investment will also smoothen the countries’ transition to renewable energy sources. The focus should be on steadily improving the proportion of renewable energy in the total energy requirement. Domestic producers of renewable energy should be incentivized through subsidies, insurance guarantees, financing options, and the creation of integrated markets and platforms for energy trading. Meanwhile, legacy coal power plants should be discouraged through penalizing in the form of a carbon tax or limited licensing. This will increase the operating cost of these firms, thereby reducing their competitiveness in the energy market. Over a while, such strategies would reduce the reliance on fossil fuels. Formulating and enforcing stringent environmental laws is essential to transition economies to low-carbon production.
6. Conclusion
The findings provide crucial insights into the relationship between capital formation and carbon emissions in developing economies. The positive link between capital formation and carbon emissions indicates that the recently liberated economies seem to be relying heavily on carbon-intensive production. According to the national targets set as part of the Paris Agreement of 2015, both developed and developing countries are expected to lower their carbon emissions. Developed countries have reported some success in lowering carbon emissions through outsourcing high-emission industries, focusing on service and energy-efficient industries, and a gradual shift to renewable energy sources. However, developing countries have come under scrutiny for their reliance on fossil fuel-based energy sources for emission-intensive production. The results of this study provide proof of this cointegration between capital formation and emissions post-liberalization of one of the largest and fastest-growing economies. For sustainable economic growth, this link needs to be broken i.e., the capital formation should focus on improving energy efficiency, renewable energy sources, and low-carbon production. The primary limitation of the study is its focus on one country. In addition to multi-country analysis, future research could study the policy responses of countries that have successfully de-coupled economic growth and emissions.
Disclosure statement
No potential conflict of interest was reported by the author(s).
References
- Acharyya, J. (2009). FDI, growth and the environment: Evidence from India on CO2 emission during the last two decades. Journal of Economic Development, 34(1), 43. https://doi.org/10.35866/caujed.2009.34.1.003
- Ahmad, M., Zhao, Z.-Y., & Li, H. (2019). Revealing stylized empirical interactions among construction sector, urbanization, energy consumption, economic growth and CO2 emissions in China. Science of the Total Environment, 657, 1085–14. https://doi.org/10.1016/j.scitotenv.2018.12.112
- Alam, M. M., Murad, M. W., Noman, A. H. M., & Ozturk, I. (2016). Relationships among carbon emissions, economic growth, energy consumption and population growth: Testing environmental Kuznets Curve hypothesis for Brazil, China, India and Indonesia. Ecological Indicators, 70, 466–479. https://doi.org/10.1016/j.ecolind.2016.06.043
- Alshehry, A. S., & Belloumi, M. (2015). Energy consumption, carbon dioxide emissions and economic growth: The case of Saudi Arabia. Renewable and Sustainable Energy Reviews, 41, 237–247. https://doi.org/10.1016/j.rser.2014.08.004
- Antonakakis, N., Chatziantoniou, I., & Filis, G. (2017). Energy consumption, CO2 emissions, and economic growth: An ethical dilemma. Renewable and Sustainable Energy Reviews, 68, 808–824. https://doi.org/10.1016/j.rser.2016.09.105
- Appiah, M. O. (2018). Investigating the multivariate Granger causality between energy consumption, economic growth and CO2 emissions in Ghana. Energy Policy, 112, 198–208. https://doi.org/10.1016/j.enpol.2017.10.017
- Baek, J. (2016). A new look at the FDI–income–energy–environment nexus: Dynamic panel data analysis of ASEAN. Energy Policy, 91, 22–27. https://doi.org/10.1016/j.enpol.2015.12.045
- Beghin, J., Roland-Holst, D., & van der Mensbrugghe, D. (1995). Trade liberalization and the environment in the Pacific Basin: Coordinated approaches to Mexican trade and environment policy. American Journal of Agricultural Economics, 77(3), 778–785. https://doi.org/10.2307/1243251
- Bukhari, N., Shahzadi, K., & Ahmad, M. S. (2014). Consequence of FDI on CO2 emissions in case of Pakistan. Middle-East Journal of Scientific Research, 20(9), 1183–1189. https://doi.org/10.5829/idosi.mejsr.2014.20.09.13595
- Central Electricity Authority. (2019). CEA annual report.
- Chandia, K. E., Gul, I., Aziz, S., Sarwar, B., & Zulfiqar, S. (2018). An analysis of the association among carbon dioxide emissions, energy consumption and economic performance: An econometric model. Carbon Management, 9(3), 227–241. https://doi.org/10.1080/17583004.2018.1457930
- Copeland, B. (2008). The pollution haven hypothesis. In K. Gallagher (Ed.), Handbook on Trade and the Environment (pp. 60–70). Cheltenham, UK: Edward Elgar Publishing.
- Dar, J. A., & Asif, M. (2017). Is financial development good for carbon mitigation in India? A regime shift-based cointegration analysis. Carbon Management, 8(5–6), 435–443. https://doi.org/10.1080/17583004.2017.1396841
- Dogan, E., & Turkekul, B. (2016). CO2 emissions, real output, energy consumption, trade, urbanization and financial development: Testing the EKC hypothesis for the USA. Environmental Science and Pollution Research, 23(2), 1203–1213. https://doi.org/10.1007/s11356-015-5323-8
- Duan, Y., Ji, T., Lu, Y., & Wang, S. (2021). Environmental regulations and international trade: A quantitative economic analysis of world pollution emissions. Journal of Public Economics, 203, 104521. https://doi.org/10.1016/j.jpubeco.2021.104521
- Esso, L. J., & Keho, Y. (2016). Energy consumption, economic growth and carbon emissions: Cointegration and causality evidence from selected African countries. Energy, 114, 492–497. https://doi.org/10.1016/j.energy.2016.08.010
- Etokakpan, M. U., Solarin, S. A., Yorucu, V., Bekun, F. V., & Sarkodie, S. A. (2020). Modeling natural gas consumption, capital formation, globalization, CO2 emissions and economic growth nexus in Malaysia: Fresh evidence from combined cointegration and causality analysis. Energy Strategy Reviews, 31, 100526. https://doi.org/10.1016/j.esr.2020.100526
- Global Carbon Project. (2022). Global carbon budget 2022. https://doi.org/10.5194/essd-14-4811-2022
- Gökmenoğlu, K., & Taspinar, N. (2016). The relationship between CO2 emissions, energy consumption, economic growth and FDI: The case of Turkey. The Journal of International Trade & Economic Development, 25(5), 706–723. https://doi.org/10.1080/09638199.2015.1119876
- Grossman, G., & Krueger, A. (1991). Environmental impacts of a North American free trade agreement. In National Bureau of economic research. National Bureau of economic research. https://doi.org/10.3386/w3914
- Halicioglu, F. (2009). An econometric study of CO2 emissions, energy consumption, income and foreign trade in Turkey. Energy Policy, 37(3), 1156–1164. https://doi.org/10.1016/j.enpol.2008.11.012
- Harris, J. M. (2004). Trade and the environment. Tuft University.
- Holtz-Eakin, D., & Selden, T. M. (1995). Stoking the fires? CO2 emissions and economic growth. Journal of Public Economics, 57(1), 85–101. https://doi.org/10.1016/0047-2727(94)01449-X
- Jayanthakumaran, K., Verma, R., & Liu, Y. (2012). CO2 emissions, energy consumption, trade and income: A comparative analysis of China and India. Energy Policy, 42, 450–460. https://doi.org/10.1016/j.enpol.2011.12.010
- Khan, M. K., Teng, J.-Z., Khan, M. I., & Khan, M. O. (2019). Impact of globalization, economic factors and energy consumption on CO2 emissions in Pakistan. Science of the Total Environment, 688, 424–436. https://doi.org/10.1016/j.scitotenv.2019.06.065
- Managi, S., & Jena, P. R. (2008). Environmental productivity and Kuznets curve in India. Ecological Economics, 65(2), 432–440. https://doi.org/10.1016/j.ecolecon.2007.07.011
- Omri, A. (2013). CO2 emissions, energy consumption and economic growth nexus in MENA countries: Evidence from simultaneous equations models. Energy Economics, 40, 657–664. https://doi.org/10.1016/j.eneco.2013.09.003
- Omri, A., Nguyen, D. K., & Rault, C. (2014). Causal interactions between CO2 emissions, FDI, and economic growth: Evidence from dynamic simultaneous-equation models. Economic Modelling, 42, 382–389. https://doi.org/10.1016/j.econmod.2014.07.026
- Prakash, N., & Sethi, M. (2022a). Emissions-foreign trade nexus: Establishing the need to harmonize environment and economics in RCEP. Journal of Economic and Administrative Sciences. https://doi.org/10.1108/JEAS-04-2022-0093
- Prakash, N., & Sethi, M. (2022b). Investigating the foreign trade-emission nexus in RCEP. International Journal of Green Economics, 16(3), 219–234. https://doi.org/10.1504/IJGE.2022.128932
- Rahman, M. M. (2020). Environmental degradation: The role of electricity consumption, economic growth and globalisation. Journal of Environmental Management, 253, 109742. https://doi.org/10.1016/j.jenvman.2019.109742
- Rahman, Z. U., & Ahmad, M. (2019). Modeling the relationship between gross capital formation and CO2 (a)symmetrically in the case of Pakistan: An empirical analysis through NARDL approach. Environmental Science and Pollution Research, 26(8), 8111–8124. https://doi.org/10.1007/s11356-019-04254-7
- Ricardo, D. (1817). The Principles of Political Economy and Taxation. Cambridge University Press.
- Richmond, A. K., & Kaufmann, R. K. (2006). Is there a turning point in the relationship between income and energy use and/or carbon emissions? Ecological Economics, 56(2), 176–189. https://doi.org/10.1016/j.ecolecon.2005.01.011
- Rothman, D. S. (1998). Environmental Kuznets curves—real progress or passing the buck?: A case for consumption-based approaches. Ecological Economics, 25(2), 177–194. https://doi.org/10.1016/S0921-8009(97)00179-1
- Shahbaz, M., Nasreen, S., Ahmed, K., & Hammoudeh, S. (2017). Trade openness–carbon emissions nexus: The importance of turning points of trade openness for country panels. Energy Economics, 61, 221–232. https://doi.org/10.1016/j.eneco.2016.11.008
- Shen, Y., Liu, J., & Tian, W. (2022). Interaction between international trade and logistics carbon emissions. Energy Reports, 8, 10334–10345. https://doi.org/10.1016/j.egyr.2022.07.159
- Södersten, C. J., Wood, R., & Hertwich, E. G. (2018). Environmental impacts of capital formation. Journal of Industrial Ecology, 22(1), 55–67. https://doi.org/10.1111/jiec.12532
- Sohag, K., Al Mamun, M., Uddin, G. S., & Ahmed, A. M. (2017). Sectoral output, energy use, and CO2 emission in middle-income countries. Environmental Science and Pollution Research International, 24(10), 9754–9764. https://doi.org/10.1007/s11356-017-8599-z
- UNFCCC. (2015). Transforming our world: The 2030 Agenda for sustainable development. https://sdgs.un.org/publications/transforming-our-world-2030-agenda-sustainable-development-17981
- World Bank. (2021). World development indicators. http://data.worldbank.org/data-catalog/world-development-indicators
- Zhang, X. P., & Cheng, X. M. (2009). Energy consumption, carbon emissions, and economic growth in China. Ecological Economics, 68(10), 2706–2712. https://doi.org/10.1016/j.ecolecon.2009.05.011
- Zubair, A. O., Abdul Samad, A. R., & Dankumo, A. M. (2020). Does gross domestic income, trade integration, FDI inflows, GDP, and capital reduces CO2 emissions? An empirical evidence from Nigeria. Current Research in Environmental Sustainability, 2, 100009. https://doi.org/10.1016/j.crsust.2020.100009