
 ?Mathematical formulae have been encoded as MathML and are displayed in this HTML version using MathJax in order to improve their display. Uncheck the box to turn MathJax off. This feature requires Javascript. Click on a formula to zoom.
Abstract
This study aims to investigate the material loss review published by the Federal Deposit Insurance Corporation (FDIC) on 98 failed banks from 2008 to 2015. The text mining techniques via machine learning, i.e. bag of words, document clustering, and topic modeling, are employed for the investigation. The pre-processing step of text cleaning is first performed prior to the analysis. In comparison with traditional methods using financial ratios, our study generates actionable insights extracted from semi-structured textual data, i.e. the FDIC’s reports. Our text analytics suggests that to prevent from being a failure; banks should beware of loans, board management, supervisory process, the concentration of acquisition, development, and construction (ADC), and commercial real estate (CRE). In addition, the primary reasons that US banks went failure from 2008 to 2015 are explained by two primary topics, i.e. loan and management.
PUBLIC INTEREST STATEMENT
In this study, we used a method called text-mining to analyze why 98 banks in the US failed between 2008 and 2015. Text-mining is a technique that helps us summarize information from a collection of reports. We discovered that the main reasons for these bank failures were related to problems with loans and management. By using text-mining techniques to review the material losses reported by the Federal Deposit Insurance Corporation (FDIC), we also identified several terms that banks should be cautious about to avoid the risk of failure. These terms include “loans,” “board management,” “supervisory process,” “concentration of acquisition,” “development and constructions,” and “commercial real estate.”
1. Introduction
Significant parallels exist between the post-Covid-19 consequence shock and the 2008 global financial crisis. They both have substantial adverse consequences worldwide, damaging many economies and potentially leading to a recession (Li et al., Citation2022). The 2008 crisis, stemming from Lehman Brothers’ collapse, caused the worst global economic downturn since 1929, showcasing the crucial role of US banks in the financial system. Ashcraft (Citation2005) raised the question of whether bank failures are essential and how they affect actual economic activities. The study provided evidence that failed banks have significant and lasting impacts on the real economy.
Numerous US banks fail yearly, especially during and after the financial crisis. When a bank fails, the Federal Deposit Insurance Corporation (FDIC) plays two key roles: (i) Paying insurance to depositors and (ii) Managing the failed bank’s assets and debts. Furthermore, FDIC also provides reports that are conducted through investigations and publish material loss reviews for each failed bank, evaluating supervision and board oversight over a 10-year period before the failure announcement. These detailed assessments from FDIC are extremely valuable, shedding light on hard-to-measure criteria like board oversight and examination qualities.
Financial ratios are commonly used in the literature to assess bank performance and predict failures. However, they have limitations in determining management quality or strategy to fully describe the reasons for bankruptcy. Moreover, the financial indicators that combine with news/textual information will improve the accuracy of prediction (Gupta et al., Citation2020). Therefore, text analysis should be considered a complementary tool to predict bankruptcy. Text mining (Hudaefi & Badeges, Citation2022; Hudaefi et al., Citation2022) is an artificial intelligence technique that quickly generalizes main ideas. Das (Citation2014) defines it as a large-scale automated processing of digital plain text to extract useful quantitative or qualitative information.
Several studies have explored the application of text mining in various sectors, including financial industry (Hristova, Citation2022; Hudaefi et al., Citation2022; Kuilboer & Stull, Citation2021; Pejić Bach et al., Citation2019), management disciplines (Hudaefi et al., Citation2022; Kushwaha et al., Citation2021), supply chain sector (Chu et al., Citation2020). However, a limited number of articles utilize text mining for bank bankruptcy prediction. To fill the gap, the aim of this study is to use text mining to explore the US banking sector before, during, and after the global financial crisis. By analyzing bank failure reports provided by FDIC, the study aims to provide insights into the potential reasons for bank failures. Additionally, this research will contribute to the literature by (1) Explaining the reasons behind bank failure through text analysis and (2) Demonstrating the use of text analysis as a supplement to traditional financial ratio analysis.
This article is organized as follows: Section 2 provides an overview of the literature concerning failure recognized and textual representation techniques. Section 3 introduces our data corpus and the methodology for extracting the key terms. The results are represented in section 4. The brief conclusion is in section 5.
2. Literature review
Text mining is applied popularly in the field of business management, such as opinion mining and sentiment analysis (Pak & Paroubek, Citation2010; Pang & Lee, Citation2008). This technique, however, has yet to be used widely in the finance and bank failure field. The most common use in this field is financial ratios to explain the reasons for bank failure. The financial ratios were initially conducted using numeric data from financial reports or relevant statements.
Previous studies focus on using ratios models to predict bankruptcy. Altman (Citation1968), Ohlson (Citation1980), and several studies have developed accounting ratio models of bankruptcy. Ratios such as Net worth to debt, Working capital to Total Assets, Earning before interest and taxes to total assets are widely used to describe the probability of bankruptcy. Most of these kinds of algorithms require statistical tests, hypotheses, or robustness checks to ensure that the method performs well. Some financial ratios are used widely, such as CAMELs rating, coverage ratios, and management quality (via ratios such as CEO duality, the percentage of independent directors, current ratio, ROE/ROA, etc.). Applying text mining to extract the most popular ratios, Kumar and Ravi (Citation2007) reported that among 128 given papers, most papers mentioned current ratios, quick ratio, income ratio, EBIT/total assets, ROA, or ROE. These ratios are also considered the “core ratios” that affect a bank’s performance. In general, to measure the effect of governance, previous studies may use some variables that are considered to reflect the quality of governance, such as the gender of the CEO, and the number of meetings for the B.O.D. over the year. This approach brings the result with the equation measuring parameters.
In recent decades, the question of the value of non-numeric data has been addressed. Text mining was introduced in the 1960s by document classification and became popular in the 1990s. This method has found various applications in diverse domains (Kumar & Ravi, Citation2016). Especially in the decades of social media and big data nowadays, text mining has become a leading trend to analyze text context not only on Facebook, Twitter, blog, or other social networks but also through news and reports (He, Citation2013). This information is valuable to decision-makers, their partners, competitors, and stakeholders. Text in context is believed to bear more diverse information than numbers (Kloptchenko et al., Citation2004). However, in most previous research using text mining, researchers primarily analyzed text data based on word frequency calculated by morphologically analyzed text. The extracted word might lack important information that was included in the original text, such as word-to-word dependencies and the contexts around high-frequency words. Data is collected from headline news and financial reports.
In the field of finance, prolific work is reported in using text mining to solve problems such as predicting the FOREX rate, stock market, or customer relationship management (Kumar & Ravi, Citation2016). However, compared with the number of finance research based on financial ratios, the number of researchers based on text mining is the minority. Regarding FOREX rate prediction, the study suggested that based on the historical trend (Goodhart, Citation1990), news reports (Fung et al., Citation2002), macro news (Evans & Lyons, Citation2008), or even Twitter messages (Vu et al., Citation2012) might effect on FOREX rate and help investor predict the movement of foreign currency. Besides, there are more papers on stock market prediction that use news headlines, annual reports, or financial news from Bloomberg and Yahoo to foresee the trend of stock price (Back et al., Citation2001; Chan & Franklin, Citation2011; Koppel & Shtrimberg, Citation2006; Mellouli et al., Citation2010; Nassirtoussi et al., Citation2014; Wang et al., Citation2011).
Once the typical process of basic text mining is, firstly, to collect the data by acquiring articles, news or reports from the internet. Secondly, extract and retrieve the given data by reporting the frequency of the most common vocabularies as a baseline of the framework (Gajzler, Citation2018). Finally, calculate the correlation among words. However, this approach is more about statistics than giving the true meaning of the text. To maximize the efficiency of the use of text mining, document analysis is introduced. The two most popular tools are document clustering and topic modeling. These are two closely related tasks that can mutually benefit each other (Xie & Xing, Citation2013).
Topic modeling is one of the most powerful text-mining techniques, gaining researchers’ attention (Chi et al., Citation2010). Blei and Lafferty (Citation2009) proposed topic modeling by discovering patterns of word use and connecting documents that exhibit similar patterns. Topic models have emerged as powerful new techniques for finding valuable structures in an otherwise unstructured collection (Krstić et al., Citation2019) This technique is applied in various fields, such as customer analysis, political science, etc. A topic contains a cluster of words that frequently occurs ensemble and can connect words with similar meanings and distinguish between uses of words with multiple meanings (Moosad et al., Citation2015). There is various type of topic model algorithms, such as Latent Semantic Analysis (LSA), Probabilistic Latent Semantic Analysis (PLSA), Correlated Topic Model (CTM), and Latent Dirichlet Allocation (LDA); among them, LDA, an algorithm based on statistical (Bayesian) topic models is one of the most popular tools in this topic modeling and be considered as a standard tool. Various studies in the field of social networks (Cheng et al., Citation2013; Cohen & Ruths, Citation2013; Kim & Shim, Citation2014; McCallum et al., Citation2005; Wang et al., Citation2013; Yu et al., Citation2015), political science (Cohen & Ruths, Citation2013), linguistic science (Bauer et al., Citation2012) used LDA. The dataset is mainly used in finance for financial news and financial reports (Kumar & Ravi, Citation2016).
Document clustering is a method for automatic cluster textual documents. This algorithm is widely applied in many fields, such as document organization, browsing, summarization, or classification (Cai et al., Citation2010). There are many algorithms for document clustering, like the K-means algorithm (Hartigan & Wong, Citation1979) and hierarchical clustering (Jain & Dubes, Citation1988). Further, it is evident that text mining is becoming more popular and drawing special attention from researchers. Using text mining saves time from reading thousands of documents and helps researchers have a general idea effectively. Text and data mining are considered complementary techniques for efficient business management. Text mining tools are becoming even more important.
3. Research methodology
3.1. Data
The corpus consists of 98 official bank failure reports that were collected from the FDIC website (https://www.fdicoig.gov/reports-bank-failures) spanning the years 2009 to 2015. Among these reports, 69 out of 98 banks failed due to the Global Financial Crisis of 2008. Table provides a detailed overview of the corpus. The reports are announced by the Federal Deposit Insurance Corporation’s Office of Inspector General (FDIC OIG), which is an independent office responsible for conducting audits, evaluations, investigations, and other reviews of the FDIC. The primary purpose of these reviews is to prevent, deter, and detect waste, fraud, abuse, and misconduct in FDIC programs and operations, while also promoting efficiency and effectiveness within the agency.
Table 1. Descriptive on bank’s failure report
The audits conducted as part of the reports aim to determine the causes of the financial institution’s failure and the resulting material loss to the Deposit Insurance Fund (DIF). Additionally, they evaluate the FDIC’s supervision of the institution, including the implementation of the PCA (Prompt Corrective Action) provisions. Each bank’s report provides both numeric and textual information. Interestingly, the textual part of the material loss review contains more comprehensive and detailed information compared to the financial ratios and other numeric data.
Each report in the corpus follows a structured format, comprising three main sections: Causes of failure, Material loss, and the FDIC’s supervision. Each reason leading to the failure is analyzed in a separate and detailed paragraph. For instance, let’s consider the report on the failure of The Bank of Union, El Reno, Oklahoma, in 2014. In this report, one of the reasons identified was related to the CEO’s actions. The CEO would occasionally present information to the Board concerning specific borrowing relationships and the overall lending strategy of the bank. However, in certain instances, the subsequent actions taken by the bank’s management deviated from the materials presented by the CEO. Each report in the corpus delves into similar in-depth analysis, providing comprehensive insights into the factors contributing to the failure of the respective banks. The structured approach allows for a thorough understanding of the circumstances surrounding each bank’s collapse and helps identify patterns and trends within the dataset.
Overall, this corpus of bank failure reports offers valuable insights into the factors contributing to bank failures during the specified period and serves as a valuable resource for conducting in-depth analyses and research in this domain.
3.2. Method
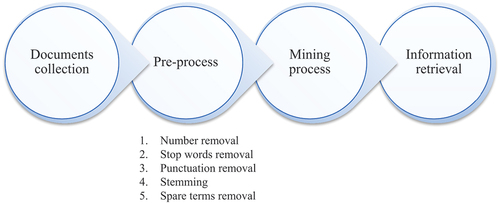
Unlike the traditional financial ratio analysis, numbers are organized as a structured matrix. The primary challenge in applying text mining is investigating the unstructured data format. Text mining applies mainly resembles techniques as data mining; the difference is to deal with the corpus of textual data (Dörre et al., Citation1999). The corpus is converted into the document-term matrix after removing stop words, stemming, punctuation, number, and strip whitespace as proposed by Salton and Buckley (Citation1988).
3.2.1. Pre-process and Bag of Words (BoW)
The Bag-of-Words (BoW) technique is exclusively based on raw documents. This method involves extracting words from the text by considering their frequency of occurrence, without taking into account the order or grammar of each word. The extracted words are then gathered together in the form of a “bag of words.”
Feinerer (Citation2013) introduced the “tm” package in R, which provides a robust framework for text-mining applications. This package offers various methods for tasks such as data import, corpus handling, pre-processing, data management, and the creation of term-document matrices. This pre-processing step is essential as it helps cleanse the words in the text before proceeding to subsequent stages. Certain elements like words, punctuation, and capitalized letters (e.g., “A”, “in”, “that”, “there”, “our”) don’t carry significant valuable meaning in the given context. Thus, such features are removed during the pre-processing and bag-of-words techniques to reduce noise and extract more meaningful information for further analysis.
3.2.2. Topic modeling via Latent Dirichlet Allocation
We propose that a bank failed due to certain reasons, and it is likely that other banks might encounter similar issues. To explore this further, we employ document classification tools to categorize reports into groups based on their content.
Topic modeling allows us to uncover the underlying themes or latent semantics present in the document corpus and helps identify document clusters, which is more insightful than solely relying on raw term features. One popular algorithm for topic modeling is Latent Dirichlet Allocation (LDA), introduced by Blei, Ng, and Jordan in 2003. This is one of the most popular algorithms for topic modeling. Without diving into the math equations behind the model, we can understand it as being conceptualized by two principles: LDA estimates the mixture of words that compose a topic and determine the topics that describe each document. Mathematically, LDA calculates based on a conditional distribution. A corpus D contains d document distributed into T topics including zt single latent topic. Each of zt topics composed by each word wt. LDA assumes the following generative process for each document:
Choose N ∼ Poisson(ξ).
Choose θ ∼ Dir(α).
For each of the w words wt: (a) Choose a topic zt ∼ Multinomial(θ) and (b) Choose a word wt from p(wt |zt,β), a multinomial probability conditioned on the topic zt.
For example, we provide a concise overview by selecting three sentences from separate reports (documents) related to the failure of different banks.
Sentence 1 from the “Report of Doral Bank, San Juan, Puerto Rico”Footnote1 states: “The underlying cause of Doral’s failure was attributed to poor asset quality.”
Sentence 2 from the “Report of Vantage Point Bank, Horsham, Pennsylvania” conveys: “The failure of Vantage Point Bank was a result of ineffective management by the board and management, specifically regarding the handling of risks associated with the bank’s rapid expansion of its mortgage banking operation.”
Lastly, sentence three from the report on “Valley Bank, Moline, Illinois” reveals: “The primary reasons for the failure of Valley Bank were lax oversight by its board and the implementation of a risky business strategy by a dominant CEO.”
These sentences serve as succinct summaries of the main factors contributing to the downfall of each respective bank, and they form the basis for our research analysis. These sentences provide key insights into the reasons behind the respective banks’ failures, serving as essential elements for our research analysis.
The main objective of LDA (Latent Dirichlet Allocation) is to automatically uncover the underlying topics present in a collection of documents or sentences. In this particular example, LDA has classified the documents into two topics: G (representing Governance) and R (representing Risk).
Topic G includes words like “Board,” “management,” “strategy,” “business,” “oversight,” and “CEO,” which are indicative of themes related to governance.
On the other hand, Topic R comprises words such as “Poor,” “asset,” “Risk,” “mortgage,” “operation,” “lax,” and “expansion,” signifying topics associated with risks.
For each sentence, LDA has assigned a distribution of word counts across the identified topics.
Sentence 1 is exclusively classified as 100% belonging to Topic R (Risk).
Sentence 2 is classified as 42% related to Topic G (Governance) and 58% to Topic R (Risk).
Sentence 3 is classified as 32% associated with Topic G (Governance) and 68% with Topic R (Risk).
Similarly, LDA performs a comparable process for the entire set of documents, automatically classifying each document into the given topics based on the distribution of word occurrences. The critical aspect in this process is to determine the appropriate number of topics, which can have a significant impact on the results and insights derived from the LDA analysis.
Indeed, selecting the appropriate number of topics is a crucial and challenging aspect of using LDA for topic modeling. The optimal number of topics is not yet definitively established in the literature and remains an open question.
Following Arun et al. (Citation2010), who experimented with different corpora and evaluated the number of optimal topics for each dataset. The results were presented in Table , showing that the ideal number of topics varied depending on the specific dataset. Despite their efforts, the authors noted that achieving consistent suggestions for the number of topics remains difficult due to the diverse nature of the data and topics in different domains. The absence of a standardized approach to determining the optimal number of topics is a challenge that persists in topic modeling research.
Table 2. Number of topics
Researchers and practitioners often resort to heuristics, domain expertise, or validation techniques (such as perplexity or coherence measures) to assist in selecting the number of topics that provide meaningful and interpretable results. However, this aspect of LDA modeling continues to be an active area of research, with ongoing efforts to find more consistent and reliable methods for determining the appropriate number of topics for different types of data and contexts.
Although the literature proposes several methods for empirically determining the optimal number of topics, a more rigorous assessment of their effectiveness is still necessary. The following four algorithms have been suggested to estimate the optimized number of topics: Griffiths and Steyvers (Citation2004), Cao et al. (Citation2009), Arun et al. (Citation2010), and Deveaud et al. (Citation2014).
Griffiths and Steyvers (Citation2004) propose selecting the number of topics that maximizes the harmonic mean of the sampled log-likelihoods. Deveaud et al. (Citation2014) opt for maximizing the average Jensen Shannon distance between all pairs of topic distributions. Cao et al. (Citation2009) estimate the average cosine similarity between topic distributions and choose the value that minimizes this quantity. Meanwhile, Arun et al. (Citation2010) propose minimizing the symmetric Kullback Liebler divergence between the singular values of the matrix representing word probabilities for each topic and the topic distribution within the corpus.
Despite these proposed algorithms, there is a need for further refinement and comparison to establish more robust approaches for determining the optimal number of topics in topic modeling.
3.2.3. Document clustering
Document clustering is a powerful method used for discovering topics on a large scale from textual data (Larsen & Aone, Citation1999). While this technique has not been extensively employed in finance, it finds significant applications in fields like law and web page analysis (Ramage et al., Citation2009; Wong & Fu, Citation2002).
The primary objective of document clustering is to categorize documents into different topics. Ng et al. (Citation2001), Xu et al. (Citation2003), Lu et al. (Citation2011), and Aggarwal and Zhai (Citation2012) have all worked on classifying documents with similar characteristics into groups. Document clustering is crucial in organizing, browsing, summarizing, classifying, and retrieving documents.
Two commonly used algorithms for document clustering are the hierarchical-based algorithm and the K-means algorithm, along with its variants. These algorithms facilitate the grouping of documents efficiently, enabling effective management and analysis of large volumes of textual data. The first is hierarchical clustering, which includes single link, complete linkage, group average, and Ward’s method. Although this algorithm allows documents to be clustered into a hierarchical structure suitable for browsing, it may suffer from efficiency problems. The second algorithm is based on variants of the K-means algorithm, which is more efficient and provides sufficient information for most purposes (Qin et al., Citation2017). In our experiment, we use both algorithms for document clustering. The K-means algorithm requires specifying the number of groups beforehand, while the hierarchical algorithm does not, allowing clusters to be chosen at any level of the tree.
In hierarchical clustering, each data point (document) is placed into its cluster, and then the closest two clusters are repeatedly combined into one cluster until all documents are merged into a single cluster. Hierarchical clustering is often visualized as a dendrogram. On the other hand, K-means clustering aims to find groups in the corpus based on the number of groups defined by the variable K. This approach requires defining the number of topics and iteratively redistributing the documents into topics until a termination condition is met. One disadvantage of K-means is that the accuracy and efficiency depend on the initial choice of clustering centers.
3.3. Design of the empirical model
3.3.1. Feature selection
The first step after collecting documents is to transform documents into statements appropriate for text algorithms and mining tasks. The reports are in a pdf file format, which we converted into text form and cleaned before processing. The quality of the text mining method is highly dependent on the noisiness of the features. For instance, commonly used words such as “the”, “for”, and “of” may not improve the algorithm. Hence, selecting the feature effectively is critical to remove the corpus’s noisy words. These are the steps that we used for feature selection as shown in :
Remove number: In this research, we focus on investigating the text information; the number in each report will be removed.
Remove stop words: A list of stop words is provided in the package of “stopwords” in R-software. The list included 175 words that are frequently occurring but transmit no significant meaning, such as I, our, his, was, is, are, will, etc. The recurrent appearance of these words may interfere with the analysis process; hence, remove words that belong to this list. Moreover, we also create and remove our own stop-words list, such as a bank, FDIC, also, because, the, etc.
Stem words: some words have similar meanings but have different word forms, such as banks and banking, institution and institutions, managing and manager or management, etc. We convert different word forms into similar canonical forms. For example, failure or failing in to fail, examinations and exams or examine into an exam, etc. This process reduces the data redundancy and simplifies the later computation.
Remove punctuation: All punctuations are removed from the text. This step aims to make the statements appropriate for text algorithms.
Remove spare terms: We remove the spare terms that appear in only one report.
Figure 1. The essential steps in mining documents.
3.3.2. Model designed
In this step, we perform a word frequency analysis on each document in the corpus. Our hypothesis is that words mentioned more frequently hold greater significance in the reports. We calculate the number of times each word appears in each document and then aggregate these counts to obtain the total frequency for each word across the entire corpus.
3.3.2.1. Correlation analysis
The correlation analysis examines the relationship between words in a binary form, where words either co-occur or do not appear together. The phi coefficient is a common measure used for binary correlation. Table displays the matrix depicting the combinations of words X and Y along with their corresponding phi coefficients. This analysis allows us to understand the patterns of word co-occurrences and their associations within the corpus.
In which:
N11 : the number of document where both word X and word Y appear
N10 and N01 : where one appears without the other
N00 : the number where neither appears
In terms of this table, the phi coefficient is:
The high value of suggests the high correlation between words X and Y. The literature suggested that counting the number of appearance times does not bring high value for analysing. Finding phrases via word correlation is a progression for text mining techniques.
3.3.2.2. Topic modeling
We classify reports into topics. We hypothesize that among 98 failed banks, there are main topics that can be considered as the main reasons. Each topic is composed of weighted words. Grouping helps the information retrieval process bring higher value. LDA and document clustering techniques are applied to classify the reports into sub-groups. Document clustering with K-means and hierarchies: partition reports into groups.
4. Findings and discussions
4.1. Descriptive statistic
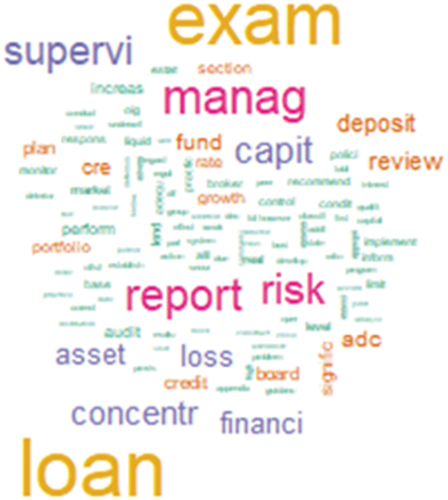
Table presents correlation matrix of words X and Y combination and Table presents the 30 most frequently occurring words in the corpus, displayed in their stem forms. These words primarily pertain to crucial bank activities, such as Loans, deposits, Credit, and Insurance. Notably, a significant focus is on Loan-related issues, including words like Loan, Loss, review, ADC (Acquisition, Development, and Construction), CRE (Commercial Real Estate), ALLL (Allowance for Loan Loss and Lease), Lend, and Estate. Additionally, an important governance aspect is evident, with words such as management, report, supervisory, board, and exam. Figure further illustrates these findings through a chart, depicting the top 15 most frequent words. Of particular significance, the repetition of the words “Exam” and “Loan” is remarkably higher, occurring nearly 15,000 times across the 98 reports. These findings hold substantial financial analysis value, as most of these words are regarded as sensitive indicators representative of the bank’s failure analysis. Their high frequency underscores their importance in understanding the reasons behind bank failures and can provide valuable insights to financial analysts and researchers studying this domain.
Figure 2. Top 15 frequent words.
Table 3. Correlation matrix of words X and Y combination
Table 4. The 30 most frequent words
At first glance, the statistic presents’ not-surprising words such as Loan, exam (or examination), management, risk, and report. These words are always considered “core reasons” for a bank’s failure. In the history of research about the bank, these reasons can be found regularly (Alam et al., Citation2000; Bell, Citation1997; Haslem et al., Citation1992; Kolari et al., Citation2002; Martin, Citation1977). However, when going further, some words are significantly important and remarkable such as Concentr (or concentration), ADC (or Acquisition, Development and Construction), CRE (Commercial Real Estate), and board.
By looking at this list, the readers can have a global scenario of these banks during this period. Figure shows the order of frequent words. Figure presents in the word cloud all the words that appear more than 800 times in the corpus. Figure also presents the word cloud of the top frequent words. For Figures , the bigger size of the word shows more frequency. This step suggested general ideas about the bank’s failure. The second step analyses the correlation of words to bring more profound results.
Figure 3. Word cloud.
Figure 4. Word cloud.
4.2. The correlation matrix of words that appear more than 0.3
Counting the number of words, however, needs to reflect the picture of the context entirely. We apply R software to find out the correlation matrix among words. The correlation matrix suggested the connection between words. The 20 most correlated words among the 50 most frequent words are visualized in Figure .
Figure 5. Correlation matrix of words.
Table presents the correlation coefficient according to Cohen (Citation1988). The correlation between 0.10 and 0.29 are “small”, those greater than 0.30 and smaller than 0.49 are “medium”, and those greater than 0.50 are “large” in terms of the magnitude of effect sizes. We hence, follow Cohen (Citation1988) find the words that their correlation at the minimum as medium (Correlation must be greater than 0.3).
Table 5. Correlation coefficient
The linking is an intersection and complicated. Figure shows the correlation matrix of words. The matrix is created by the important words, which are considered “core nodes” that most of the other words must “cross”. These “core nodes” are significantly important as they are (i) in the most frequent words list and (ii) are considered dominant factors that connect and control others. The “core nodes” are: Exam, concentr, implement, asset, adque. Via’ Core nodes“, we can generate meaningful phrases, such as: “increase loan loss”, “credit loss insurance”, “implement credit exam”, “growth concentr estate ADC”, “implement control asset concentr growth”, ‘implement control ALLL”, etc. Compared with the simple descriptive statistic, this step brings a more comprehensive picture of what happened to bank failure from 2008 to 2015.
4.3. Topic modeling
4.3.1. Selecting the number of topics
Latent Dirichlet Allocation (LDA) is a generative model for documents in which each document is viewed as a mixture of topics, each containing a composition of words. The number of topics is crucial to the performance; however, finding the appropriate value for it is challenging (Cao et al., Citation2009). Finding a suitable number of latent topics in a given corpus has remained an open-ended question.
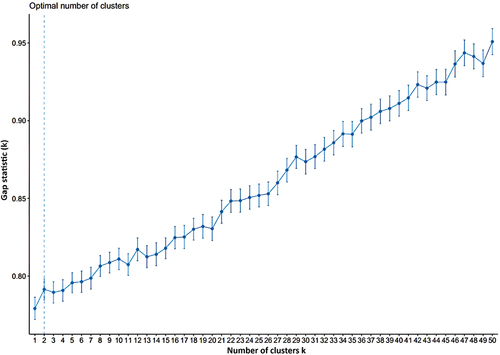
We assume that there will be at least 2 reports per topic. For 98 given reports, the range of the number of topics is from 1 to 50 topics. Figure suggests the number of optimal topics based on the algorithm of Griffiths and Steyvers (Citation2004), Cao et al. (Citation2009), Arun et al. (Citation2010) and Deveaud et al. (Citation2014). As Deveaud et al. (Citation2014) algorithm, we should categorize it into 18 topics. Griffiths and Steyvers (Citation2004) and Cao et al. (Citation2009) proposed 38 topics. The question of “How many topics for text classification” is still ongoing, and the answer typically depends on the characteristics of each corpus. Hence, we then experiment with 1 to 50 topics. Our result indicates that this corpus’s optimal number of topics is 2. As the number of topics increases, the distinction among topics becomes unclear. Figure is an example of the classification of 3 topics. The words are similar in all three topics; the only difference is the weight of each word.
Figure 6. The number of optimal topics.
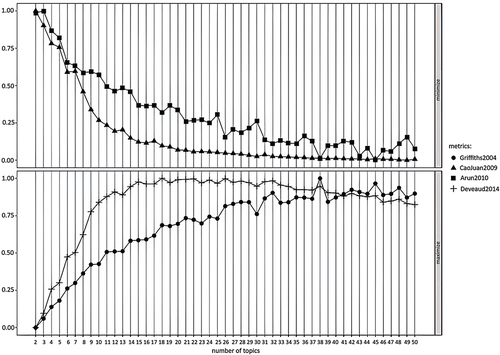
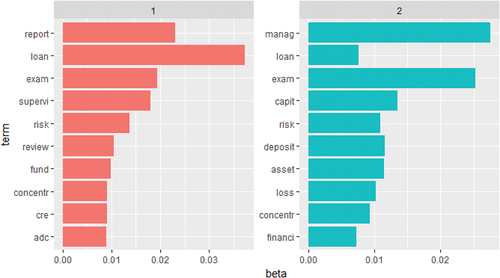
Figure 7. The common frequent vocabularies of 2 sub-group.
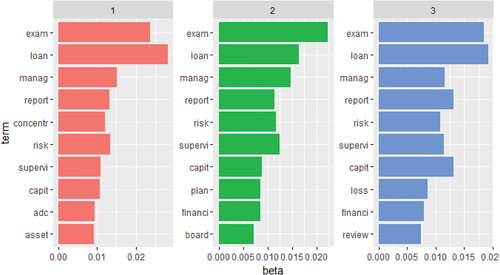
Figure shows 2 topics of the given corpus. Topic 1 focuses on loan-related issues, and the other focuses on management-related issues. These 2 topics included some common words: loan, exam, concentr, and risk. These words are also included in the “core nodes” of the correlation matrix. Sixty-five banks belong to Topic 1 and 33 to Topic 2.
Figure 8. An example of the classification of 3 topics.
4.4. Clustering
The K-means algorithm is applied to find out the optimal number of topics by document clustering. The calculation is based on Euclidean methods. With p and q are two random points, each has n features. The distance between p and q can be calculated as:
Dist (p,q)=
The result of applying package “factoextra” from Kassambara and Mundt (Citation2017) in R suggests that 98 documents should be divided into 2 groups to optimize the clustering. Figure shows the optimal number of clusters.
Figure 9. Optimal number of clusters.
One of the advantages of hierarchies clustering is to specify the number of topics at any level. The result can be seen in Figure , which suggests that we can cluster into 2 groups at the highest level of 3. This classification is consistent with the K-means algorithm and topic modeling with LDA. The dendrogram reports that 18 documents are placed in the first group, 80 in the second group.
Figure 10. The dendrogram for hierarchies clustering.
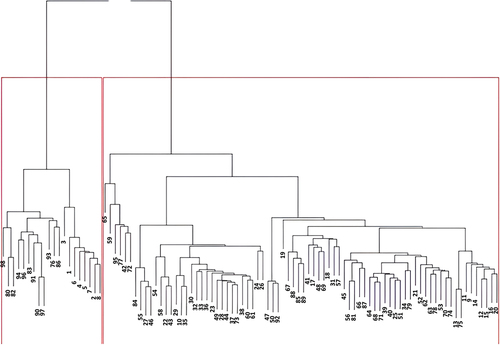
Table presents the most common frequent vocabularies of 2 sub-groups. This list corresponds to the list in Table .
Table 6. The common frequent vocabularies of 2 sub-group
There are words in the top 20 common words that appear in the “bigger” group but do not appear in the second group ADC (Acquisition, Development and Construction), ALLL (Allowance for Loan and Lease Losses), Liquid, Policy, and Broker. These “sensitive terms” imply the factors that distinguish 2 groups.
5. Conclusion
As the important role of the banking system in economics, studying a bank’s failure has become a topic of interest. By suggesting issues that banks must beware of, text analytics can be a complementary action for profound banks’ financial analysis. It makes it possible that text analytics has captured a global tendency to foresee the features before they injure a bank’s financial condition.
It is noteworthy that ADC and CRE are mentioned significantly. Under Basel III, CRE (Commercial real estate loan) is a mortgage loan secured by a lien on commercial, rather than residential, property. This type of loan is typically made to business entities formed for the specific purpose of owning commercial real estate. ADC (Acquisition, Development and Construction) loan, considered the riskiest type of commercial real estate (CRE) lending, is a loan that allows the borrower to purchase real property (such as land), put in the necessary infrastructure, and then build stores or other buildings. This type of loan is often used by developers of large properties such as strip malls or shopping centers. To the best of our knowledge, rarely ADC and CRE are criticized as the reasons for the bank’s failure. One of the reasons is the difficulty in obtaining the numeric data of ADC and CRE due to the complicated calculation.
We have demonstrated Bag-of-words techniques, a statistical inference algorithm for LDA, topic modeling, and document clustering for analyzing 98 banks’ material lost reviews. Our research contributed by using text analytics on four major aspects. Those aspects are (i) core words, (ii) core nodes, (iii) the number of optimal topics in text mining, and (iv) consistent topic modeling with LDA, K-means, and hierarchies clustering.
For the core words, the results suggest that some core words, which are considered as some main reasons cause the bank’s failure, appear in most of the reports. We classify them into four groups: loan, management, capital, and magnitude. The core words for the loan are loan, ADC, CRE, credit, rate, and ALLL. The core words for management are exam, management, report, supervise, review, board, and audit. The core words for capital are capital, deposit, asset, fund, and portfolio. The core words for magnitude are increase, significant, growth, and concentration. The given words are significantly sensitive to the banking system. Our results are comparable to financial ratios aspects. Moreover, it is noteworthy that some terms are hard to measure in numeric and not mentioned as a reason in the literature of bankruptcy, but they have a significant obviously influence on banks’ survival. Those terms are management, supervision, and concentration on ADC or CRE. Further, the words found for the core nodes are exam, concentration, asset, implementation, and adequate. We suggest that the bank increase the supervisory process and seriously pay attention to the allocation of loans, especially on the ADC and CRE loan.
There is little agreement on the optimal number of topics in text mining; even the clustering has been assessed in many ways. Our experiment, once again, raises a question on this issue. In fact, the number of topics should depend on the features and components of each given corpus; there should not be a standard for every experiment. Our research suggests dividing the reasons that banks fail into two main sub-groups: loan and governance-related issues. We obtain a consistent suggestion on the number of clusters for the consistent topic modeling with LDA, K-means, and hierarchies clustering. Three algorithms suggested that the number of topics for this corpus should be divided in two.
The findings from Fatima (Citation2013) suggest that banks with high loan to asset and high personal loan-to-assets ratios are more likely to survive, while banks with higher real estate and agricultural loans, and non-performing loans to assets are more prone to failure. In our research, we employed text-mining techniques to investigate the main reasons behind bank failures, and our results align closely with the aforementioned findings. However, our study goes beyond these established factors and presents additional reasons contributing to bank failures. Management and supervision emerged as crucial determinants of bank failure among the factors we identified. Inadequate management practices and oversight can significantly impact a bank’s stability and ultimately lead to its downfall. Furthermore, we found that banks concentrating heavily on Acquisition, Development, and Construction (ADC) or Commercial Real Estate (CRE) loans were more susceptible to failure. These specific types of loans can expose banks to increased risks, and without effective management and supervision, these risks can escalate.
Notably, our research sheds light on the importance of supervisory quality, a factor that has not been extensively discussed in many previous studies. We find that the quality of supervision by regulatory bodies plays a pivotal role in preventing bank failures. Inadequate or ineffective supervision can lead to overlooked risks and improper risk management, making it crucial for regulatory authorities to maintain high-quality supervision to safeguard the stability of the banking sector.
There is scope for further research as our study has some limitations. We focus only on the loss material reviews; the numeric information is discarded and by looking at this text analysis, the movement of financial condition is not mentioned. In brief, this research has shown that utilizing text analytics bring some advantages than financial ratios analysis approach. Text analytics is relevant to data analytics for the main reasons that bank goes failure via core words such as loan, capital and deposit. Moreover, text analytics contributes to the literature of bank failure that the concentration on ADC and CRE loan, which is rarely considered in previous research.
Disclosure statement
No potential conflict of interest was reported by the author(s).
Additional information
Notes on contributors

Hanh Hong Le
Hanh Hong Le ([email protected]) is a lecturer in the Economics and Finance department at The Business School, RMIT Vietnam. She obtained a Ph.D. degree in Finance from University of Rennes 1, France in 2019. Dr. Le’s primary research interest lies in the field of risk management and sustainable finance.
Notes
References
- Aggarwal, C. C., & Zhai, C. (2012). A survey of text classification algorithms. In Mining text data (pp. 163–19). Springer US. https://doi.org/10.1007/978-1-4614-3223-4_6
- Alam, P., Booth, D., Lee, K., & Thordarson, T. (2000). The use of fuzzy clustering algorithm and self-organizing neural networks for identifying potentially failing banks: An experimental study. Expert Systems with Applications, 18(3), 185–199. https://doi.org/10.1016/S0957-4174(99)00061-5
- Altman, E. I. (1968). Financial ratios, discriminant analysis and the prediction of corporate bankruptcy. The Journal of Finance, 23(4), 589–609. https://doi.org/10.1111/j.1540-6261.1968.tb00843.x
- Arun, R., Suresh, V., Veni Madhavan, C. E., & Murthy, N. (2010, June). On finding the natural number of topics with latent Dirichlet allocation: Some observations. In Pacific-Asia conference on knowledge discovery and data mining (pp. 391–402). Springer.
- Ashcraft, A. B. (2005). Are banks really special? New evidence from the FDIC-induced failure of healthy banks. American Economic Review, 95(5), 1712–1730. https://doi.org/10.1257/000282805775014326
- Back, B., Toivonen, J., Vanharanta, H., & Visa, A. (2001). Comparing numerical data and text information from annual reports using self-organizing maps. International Journal of Accounting Information Systems, 2(4), 249–269. https://doi.org/10.1016/S1467-0895(01)00018-5
- Bauer, S., Noulas, A., Séaghdha, D. O., Clark, S., & Mascolo, C. (2012, September). Talking places: Modeling and analysing linguistic content in foursquare. In 2012 International Conference on Privacy, Security, Risk and Trust and 2012 International Confernece on Social Computing (pp. 348–357). Institute of Electrical and Electronics Engineers (IEEE).
- Bell, T. B. (1997). Neural nets or the logit model? A comparison of each model’s ability to predict commercial bank failures. International Journal of Intelligent Systems in Accounting, Finance & Management, 6(3), 249–264. https://doi.org/10.1002/(SICI)1099-1174(199709)6:3<249:AID-ISAF125>3.0.CO;2-H
- Blei, D. M., & Lafferty, J. D. (2009). Topic models. In Text mining (pp. 101–124). Chapman and Hall/CRC.
- Cai, D., He, X., & Han, J. (2010). Locally consistent concept factorization for document clustering. IEEE Transactions on Knowledge and Data Engineering, 23(6), 902–913. https://doi.org/10.1109/TKDE.2010.165
- Cao, J., Xia, T., Li, J., Zhang, Y., & Tang, S. (2009). A density-based method for adaptive LDA model selection. Neurocomputing, 72(7–9), 1775–1781. https://doi.org/10.1016/j.neucom.2008.06.011
- Chan, S. W., & Franklin, J. (2011). A text-based decision support system for financial sequence prediction. Decision Support Systems, 52(1), 189–198. https://doi.org/10.1016/j.dss.2011.07.003
- Cheng, V. C., Leung, C. H., Liu, J., & Milani, A. (2013). Probabilistic aspect mining model for drug reviews. IEEE Transactions on Knowledge and Data Engineering, 26(8), 2002–2013. https://doi.org/10.1109/TKDE.2013.175
- Chi, E. H., Hong, L., & Card, S. K. (2010). U.S. Patent No. 7,702,611. U.S. Patent and Trademark Office.
- Chu, C. Y., Park, K., & Kremer, G. E. (2020). A global supply chain risk management framework: An application of text-mining to identify region-specific supply chain risks. Advanced Engineering Informatics, 45, 101053. https://doi.org/10.1016/j.aei.2020.101053
- Cohen, J. (1988). Set correlation and contingency tables. Applied Psychological Measurement, 12(4), 425–434. https://doi.org/10.1177/014662168801200410
- Cohen, R., & Ruths, D. (2013). Classifying political orientation on Twitter: It’s not easy! Proceedings of the International AAAI Conference on Web & Social Media, 7(1), 91–99. https://doi.org/10.1609/icwsm.v7i1.14434
- Das, S. R. (2014). Text and context: Language analytics in finance. Foundations and Trends® in Finance, 8(3), 145–261. https://doi.org/10.1561/0500000045
- Deveaud, R., SanJuan, E., & Bellot, P. (2014). Accurate and effective latent concept modeling for ad hoc information retrieval. Document numérique, 17(1), 61–84. https://doi.org/10.3166/dn.17.1.61-84
- Dörre, J., Gerstl, P., & Seiffert, R. (1999, August). Text mining: Finding nuggets in mountains of textual data. In Proceedings of the Fifth ACM SIGKDD International Conference on Knowledge Discovery and Data Mining (pp. 398–401). Association for Computing Machinery (ACM).
- Evans, M. D., & Lyons, R. K. (2008). How is macro news transmitted to exchange rates? Journal of Financial Economics, 88(1), 26–50. https://doi.org/10.1016/j.jfineco.2007.06.001
- Fatima, A. O. (2013). An Analysis of Credit Management in the Banking Industry. A case Study of First Bank of Nigeria Plc. ENUGU, 17–20.
- Feinerer, I. (2013). Introduction to the tm package text mining in R. Accessible en ligne: http://cran.r-project.org/web/packages/tm/vignettes/tm.pdf.
- Fung, G. P. C., Yu, J. X., & Lu, H. (2002, December). Discriminative category matching: Efficient text classification for huge document collections. Proceedings of the 2002 IEEE International Conference on Data Mining, 2002, Maebashi City, Japan (pp. 187–194). IEEE.
- Gajzler, M. (2018). Protocols from periodic inspection of buildings in text mining analysis-advantages and problems of analysis. Proceedings of the MATEC Web of Conferences, Poznan, Poland (Vol. 222, pp. 01004). EDP Sciences.
- Goodhart, C. (1990). News and the foreign exchange market (No. dp71). Financial Markets Group.
- Griffiths, T. L., & Steyvers, M. (2004). Finding scientific topics. Proceedings of the National Academy of Sciences, 101(suppl_1), 5228–5235. https://doi.org/10.1073/pnas.0307752101
- Gupta, A., Dengre, V., Kheruwala, H. A., & Shah, M. (2020). Comprehensive review of text-mining applications in finance. Financial Innovation, 6(1), 1–25. https://doi.org/10.1186/s40854-020-00205-1
- Hartigan, J. A., & Wong, M. A. (1979). Algorithm as 136: A k-means clustering algorithm. Journal of the Royal Statistical Society, 28(1), 100–108. https://doi.org/10.2307/2346830
- Haslem, J. A., Scheraga, C. A., & Bedingfield, J. P. (1992). An analysis of the foreign and domestic balance sheet strategies of the US banks and their association to profitability performance. MIR: Management International Review, 32(1), 55–75.
- He, W. (2013). A survey of security risks of mobile social media through blog mining and an extensive literature search. Information Management & Computer Security.
- Hristova, G. (2022, September). Text analytics for customer satisfaction prediction: A case study in the banking domain. Proceedings of the AIP Conference, 2505(1), 100001. AIP Publishing LLC.
- Hudaefi, F. A., & Badeges, A. M. (2022). Maqāṣid al-Sharī ‘ah on Islamic banking performance in Indonesia: A knowledge discovery via text mining. Journal of Islamic Marketing, 13(10), 2069–2089. https://doi.org/10.1108/JIMA-03-2020-0081
- Hudaefi, F. A., Caraka, R. E., & Wahid, H. (2022). Zakat administration in times of COVID-19 pandemic in Indonesia: A knowledge discovery via text mining. International Journal of Islamic & Middle Eastern Finance & Management, 15(2), 271–286. https://doi.org/10.1108/IMEFM-05-2020-0250
- Jain, A. K., & Dubes, R. C. (1988). Algorithms for clustering data. Prentice-Hall, Inc.
- Kassambara, A., & Mundt, F. (2017). Package ‘factoextra’. Extract and Visualize the Results of Multivariate Data Analyses, 76(2), 1–74.
- Kim, Y., & Shim, K. (2014). TWILITE: A recommendation system for Twitter using a probabilistic model based on latent Dirichlet allocation. Information Systems, 42, 59–77. https://doi.org/10.1016/j.is.2013.11.003
- Kloptchenko, A., Eklund, T., Karlsson, J., Back, B., Vanharanta, H., & Visa, A. (2004). Combining data and text mining techniques for analysing financial reports. Intelligent Systems in Accounting, Finance & Management: International Journal, 12(1), 29–41. https://doi.org/10.1002/isaf.239
- Kolari, J., Glennon, D., Shin, H., & Caputo, M. (2002). Predicting large US commercial bank failures. Journal of Economics and Business, 54(4), 361–387. https://doi.org/10.1016/S0148-6195(02)00089-9
- Koppel, M., & Shtrimberg, I. (2006). Good news or bad news? let the market decide. In Computing attitude and affect in text: Theory and applications (pp. 297–301). Springer. https://doi.org/10.1007/1-4020-4102-0_22
- Krstić, Ž., Seljan, S., & Zoroja, J. (2019). Visualization of big data text analytics in financial industry: A case study of topic extraction for Italian banks. Entrenova-Enterprise Research Innovation, 5(1), 35–43. https://doi.org/10.2139/ssrn.3490108
- Kuilboer, J. P., & Stull, T. (2021). Text analytics and big data in the financial domain. In Proceedings of the 202116th Iberian Conference on Information Systems and Technologies (CISTI) (pp. 1–4). Institute of Electrical and Electronics Engineers (IEEE).
- Kumar, B. S., & Ravi, V. (2016). A survey of the applications of text mining in financial domain. Knowledge-Based Systems, 114, 128–147. https://doi.org/10.1016/j.knosys.2016.10.003
- Kumar, P. R., & Ravi, V. (2007). Bankruptcy prediction in banks and firms via statistical and intelligent techniques–A review. European Journal of Operational Research, 180(1), 1–28. https://doi.org/10.1016/j.ejor.2006.08.043
- Kushwaha, A. K., Kar, A. K., & Dwivedi, Y. K. (2021). Applications of big data in emerging management disciplines: A literature review using text mining. International Journal of Information Management Data Insights, 1(2), 100017. https://doi.org/10.1016/j.jjimei.2021.100017
- Larsen, B., & Aone, C. (1999, August). Fast and effective text mining using linear-time document clustering. Proceedings of the fifth ACM SIGKDD international conference on Knowledge discovery and data mining (pp. 16–22). The Association for Computing Machinery.
- Li, Z., Farmanesh, P., Kirikkaleli, D., & Itani, R. (2022). A comparative analysis of COVID-19 and global financial crises: Evidence from US economy. Economic Research-Ekonomska Istraživanja, 35(1), 2427–2441. https://doi.org/10.1080/1331677X.2021.1952640
- Lu, C., Hu, X., & Park, J. R. (2011). Exploiting the social tagging network for web clustering. IEEE Transactions on Systems, Man, and Cybernetics-Part A: Systems and Humans, 41(5), 840–852. https://doi.org/10.1109/TSMCA.2011.2157128
- Martin, D. (1977). Early warning of bank failure: A logit regression approach. Journal of Banking & Finance, 1(3), 249–276. https://doi.org/10.1016/0378-4266(77)90022-X
- McCallum, A., Corrada-Emmanuel, A., & Wang, X. (2005). Topic and role discovery in social networks.
- Mellouli, S., Bouslama, F., & Akande, A. (2010). An ontology for representing financial headline news. Web Semantics: Science, Services, and Agents on the World Wide Web, 8(2–3), 203–208. https://doi.org/10.1016/j.websem.2010.02.001
- Moosad, A. R., Aiswarya, V., Subathra, P., & Kumar, P. N. (2015). Browsing Behavioural analysis using topic modeling. International Journal of Computer Technology and Applications, 8, 1853–1861.
- Nassirtoussi, A. K., Aghabozorgi, S., Wah, T. Y., & Ngo, D. C. L. (2014). Text mining for market prediction: A systematic review. Expert Systems with Applications, 41(16), 7653–7670. https://doi.org/10.1016/j.eswa.2014.06.009
- Ng, A. Y., Jordan, M. I., & Weiss, Y. (2001). On spectral clustering: analysis and an algorithm. Proceedings of the 14th International Conference on Neural Information Processing Systems: Natural and Synthetic, 14(1–2), 849–856
- Ohlson, J. A. (1980). Financial ratios and the probabilistic prediction of bankruptcy. Journal of Accounting Research, 18(1), 109–131. https://doi.org/10.2307/2490395
- Pak, A., & Paroubek, P. (2010). Twitter as a corpus for sentiment analysis and opinion mining. Proceedings of the Seventh International Conference on Language Resources and Evaluation (LREc) 10, 1320–1326
- Pang, B., & Lee, L. (2008). Opinion mining and sentiment analysis. Foundations and Trends® in Information Retrieval, 2(1–2), 1–135. https://doi.org/10.1561/1500000011
- Pejić Bach, M., Krstić, Ž., Seljan, S., & Turulja, L. (2019). Text mining for big data analysis in financial sector: A literature review. Sustainability, 11(5), 1277. https://doi.org/10.3390/su11051277
- Qin, Z., Lian, H., He, T., & Luo, B. (2017). Cluster correction on polysemy and synonymy. Proceedings of the 2017 14th Web Information Systems and Applications Conference (WISA) (pp. 136–138). Institute of Electrical and Electronics Engineers (IEEE).
- Ramage, D., Heymann, P., Manning, C. D., & Garcia-Molina, H. (2009). Clustering the tagged web. Proceedings of the Second ACM International Conference on Web Search and Data Mining (pp. 54–63). Association for Computing Machinery (ACM).
- Salton, G., & Buckley, C. (1988). Term-weighting approaches in automatic text retrieval. Information Processing & Management, 24(5), 513–523. https://doi.org/10.1016/0306-4573(88)90021-0
- Vu, T. T., Chang, S., Ha, Q. T., & Collier, N. (2012). An experiment in integrating sentiment features for tech stock prediction in twitter. Proceedings of the workshop on information extraction and entity analytics on social media data (pp. 23–38). The COLING 2012 Organizing Committee.
- Wang, Y. C., Burke, M., & Kraut, R. E. (2013). Gender, topic, and audience response: An analysis of user-generated content on Facebook. Proceedings of the SIGCHI conference on human factors in computing systems (pp. 31–34). Association for Computing Machinery (ACM).
- Wang, S., Xu, K., Liu, L., Fang, B., Liao, S., & Wang, H. (2011). An ontology based framework for mining dependence relationships between news and financial instruments. Expert Systems with Applications, 38(10), 12044–12050. https://doi.org/10.1016/j.eswa.2011.01.148
- Wong, W. C., & Fu, A. W. C. (2002). Incremental document clustering for web page classification. In Enabling society with information technology (pp. 101–110). Springer Japan. https://doi.org/10.1007/978-4-431-66979-1_10
- Xie, P., & Xing, E. P. (2013). Integrating document clustering and topic modeling. arXiv Preprint arXiv: 1309.6874.
- Xu, W., Liu, X., & Gong, Y. (2003,). Document clustering based on non-negative matrix factorization. Proceedings of the 26th annual international ACM SIGIR conference on Research and development in informaion retrieval (pp. 267–273). Association for Computing Machinery (ACM).
- Yu, R., He, X., & Liu, Y. (2015). Glad: Group anomaly detection in social media analysis. ACM Transactions on Knowledge Discovery from Data (TKDD), 10(2), 1–22. https://doi.org/10.1145/2811268