
 ?Mathematical formulae have been encoded as MathML and are displayed in this HTML version using MathJax in order to improve their display. Uncheck the box to turn MathJax off. This feature requires Javascript. Click on a formula to zoom.
Abstract
The study investigated the effectiveness of technical analysis indicators in trading spot exchange rates of emerging economies’ currencies under integration with artificial neural networks (ANN) and the quantitative testing of these indicators’ success in this matter with the goal of rationalizing decisions. The study period was from January 2012 to November 2022 for twenty-four currencies against the US dollar. Based on four technical indicators: the simple moving average (SMA), momentum, moving average convergence divergence (MACD), and relative strength index (RSI), with a total of 131 months. Of them, 51 months are for ANN construction (supervised learning), while 80 months are for hypothesis testing. The study used cross-sectional analysis and hierarchical multiple regression in addition to the Wilcoxon signed ranks test and Kruskal–Wallis test. The study found a significant improvement in the values predicted for exchange rates for emerging economies by artificial neural networks versus the values predicted by technical indicators alone. Finally, the study found a significant difference of gap between the values predicted for exchange rates for emerging economies by artificial neural networks and the actual values based on currency. It is possible to study the interpretation of this result according to the difference in each of the exchange rate regimes in emerging economies, in addition to the difference in structural imbalances between those economies.
JEL Classifiation:
1. Introduction
After the start of the Russian-Ukrainian war in twenty-fourth of February 2022, the sentiments of dealers in the financial markets, especially in emerging countries, changed, in addition to their avoidance of risky assets, which led to many pressures on currencies of emerging countries, which was evident in the value of several currencies, including the Egyptian pound, the Turkish lira, especially in the migration of hot money to those economies continued, which put pressure on their international reserve balances, which put those currencies under great pressure, Many central banks raised local interest rates to support the value of their currency, while some central banks tended to leave their currency to float partially or completely, which led to a decline in the value of their currency against the US dollar. The trend of floating was predominant in emerging markets.
On the theoretical side view, Prediction of exchange rates has been a topic for debate in financial literature since the late 1980s (Galeshchuk, Citation2017). The Purchasing power parity theory (PPP) is one of the intellectual pillars governing the interpretation of exchange rate changes, as it states that exchange rates between currencies are in an equilibrium position if the purchasing power of these currencies in the countries under consideration is equal at these prices. Researchers believe that this equalization is in accordance with the balance of a commodity of products, which must be diversified by a good diversification, and this is usually done by relying on the commodity mix used in estimating inflation rates through what is known as the Consumer Price Index (CPI).
Because of its supposed capacity to predict the future, technical analysis has been more popular in the financial markets over the course of the previous several decades. Within this context, there is a large body of literature dating back to the work of Goodman (Citation1979), and Goodhart (Citation1988) that throws their weight behind the profitability of technical analysis in the context of foreign exchange markets and produces argument that is mostly unconvincing. This body of literature supports the profitability of technical analysis in the context of foreign exchange markets. In spite of this, it is a well-known fact that technical analysis is extremely most likely well-liked among financial professionals operating in the foreign exchange markets. As a result of this popularity, technical analysis has evolved into a standard and necessary tool that is thoroughly integrated into financial trading activities; Academics have long debated the viability of technical analysis in terms of continuously creating profits, despite its extensive usage and acceptance by financial practitioners (Jin, Citation2021).
According to (Taylor & Allen, Citation1992); November 1988 findings of a questionnaire survey undertaken by the Bank of England among London-based top foreign currency traders. Among other data, it is found that at least 90% of respondents give this type of technical analysis significant weight. So, the current study seeks to investigate the effectiveness of technical analysis tools in trading exchange rates for the currencies of emerging economies, by reviewing previous studies of each of the determinants of foreign exchange rates and related theories and models, as well as quantitative testing of the success of technical analysis tools in this matter, with the aim of rationalizing decisions Investing in the currencies of emerging economies.
On the other hand, applications of artificial intelligence (AI) and machine learning (ML) in financial systems are reshaping businesses and society (Wall, Citation2018; Xiaojun & Tang, Citation2020). From conventional hedge fund management companies and investment and retail banks to modern financial technology service providers. Numerous financial institutions spend extensively in the acquisition of data science and machine learning (ML) capabilities nowadays (Wall, Citation2018).
Technical indicators and artificial neural networks (ANNs) have both been widely used in the study of financial markets. Technical indicators are based on historical data, such as prices and/or volumes, to classify the current state of the market. ANN models are built upon nonlinear mathematical functions and can provide predictions on many different aspects of the market, including the future direction of exchange rates. Integration of these two approaches presents an interesting topic for research as it is expected to provide more accurate and comprehensive predictions in comparison to either approach separately.
According to the above, the current study provides an answer to the following question: Is it possible to integrate artificial neural networks, and technical analysis indicators together to predict the exchange rate for emerging economies?
The aim main objective of this study is to investigate the potential benefits of integrating technical indicators with artificial neural networks for predicting exchange rates.
The paper begins introduction by presenting a brief overview of technical analysis and artificial neural networks as used in financial markets research. The study then discusses various integration strategies, focusing on their structure, and learning technique. The study will be divided into 4 sections beside introduction; that includes “Literature review and theoretical framework” in second section; “Study Methodology and Design” in the third section; “Data Analysis and Hypothesis Test “in the fourth section, and “Conclusions and recommendations “in fifth section.
2. Literature review and theoretical framework
2.1. Exchange rate
Foreign exchange rate systems, often known as exchange rate regimes, have a substantial impact on international trade and investment (Bagella et al., Citation2006; Chang & Velasco, Citation2000). Fixed exchange rates, managed exchange rates, and free exchange rates are the most common classifications for exchange rate systems. The value of a currency is tied to that of another currency or currencies basket in a fixed exchange rate system. In managed exchange rate system, the government intervenes on the foreign exchange markets to limit currency rate fluctuations. A free exchange rate system permits the market to determine the value of a currency without government involvement (Eregha, Citation2022).
Beside fixed exchange rate there is a pegged or hard pegged system. It is distinguished by two key characteristics: parity and convertibility. Under this system, the parity component sets an official conversion rate between two currencies, while the convertibility component allows foreign central banks to accept both notes and coins of other countries at the same parity level. For instance, between 1948 and 1973, the United States operated under The Bretton Woods System, which fixed all major currencies against gold at $35 per ounce, with all other currencies pegged to at least one of these “primary” currencies, such as the U.S. dollar, the British pound sterling, or the German mark, etc. During this time, fixed exchange rates were mandated by law and all international transactions were required to occur within this framework, thereby limiting speculation on international money markets and providing stability for investors investing across borders, despite the inefficiency this exclusion caused on financial markets.
Under Managed Exchange Rate Systems, governments constantly intervene on their domestic foreign exchange market in an effort to limit variations in the local currency’s relative value. Some nations may build intermediate rule-based models in which central banks passively modify the supply of foreign currency while paying close attention to the fundamentals of the macroeconomy. A prevalent example of an intervening regime is when a central bank buys or sells its own currency against other major currencies when it observes severe increases or decreases against it, hence causing artificial increases and decreases. This assists in establishing specific cross-border financial relationships and attracting Foreign Direct Investment (FDI) into the country.
based on the Free Exchange Rate; Short-term stability and long-term adaptability take precedence over anchoring specific border prices between countries, so making the system either independent or dependent (Davies et al., Citation1994). By refraining from intervening in international markets, a nation can achieve an autonomous status, allowing certain commodities’ price pressures to relate directly with global ones, thereby fostering greater integration between nations by determining Purchasing Power Parity relations between domestic and foreign units of purchasing goods (Williamson, Citation2004).
2.2. Decision-making approaches in exchange markets
The exchange markets are one of the patterns of the financial markets. Traders and investors usually use one of three approaches to making decisions, namely, “fundamental analysis approach”, “technical analysis approach”, and “behavioral approach”.
According to the fundamental analysis approach, there are many theories dealing with exchange rates; such as the Purchasing power parity theory (Krugman, Citation1978), efficient market theory (Makovský, Citation2014), the interest rate parity theory (Mayfield & Murphy, Citation1992), and the balance of payments theory (Frenkel and Mussa, Citation1985).
As for fundamental theories for estimating exchange rates, the theory Purchasing Power Parity Theory (PPP) is the most common. It is a theory of exchange rate determination that assumes that the exchange rate between two countries will equal the ratio of the prices of a representative basket of goods in each country, or that the exchange rate between two currencies should equal the ratio of their prices in terms of a good or service. The application of PPP theory to forecast short-term exchange rates has been criticised despite its attractiveness. For instance, theoretical models based on homogeneous pricing across countries can overlook country-specific features such as non-transportable barriers to entry, differences in consumer tastes, and differences in tax regimes, among other factors that could cause market distortions or pricing differentials that result in discrepancies with theoretical predictions based on the models’ underlying assumptions. Overall, the Purchasing Power Parity Theory can be a useful tool for predicting long-term expected levels and movements in real exchange rates when taking into account potential shocks arising from diverging consumer preferences or central bank interventions, among other variables that may not have been included in empirically estimated coefficients derived from historical data.
On the other hand, behavioral approaches investigate the behavior of individuals and institutions during periods of crisis. We find that the matter was clear during the crisis in the Southeast Asian markets in 1997 versus the global financial crisis in 2008, as well as during a COVID-19 pandemic in 2020 and finally the Russian-Akronian war in 2022.
The current study focuses on the technical approach. Technical analysis of financial markets involves providing forecasts or trading advice on the basis of largely visual inspection of past prices (Taylor & Allen, Citation1992). However, the technical analysis approach suffers from the fact that there is a difference in the opinions of analysts towards the indication of this analysis. Therefore, the current study adopts the use of artificial neural networks to limit human intervention in interpreting the evidence of this approach, which is reviewed in the coming lines.
2.3. Technical analysis
Forecasting financial assets prices (such as stocks, bonds, currencies, commodities, etc.) prices is gaining popularity since traders may earn profits if their predictions are accurate. Profit and returns need an examination of the financial market’s past data in an effort to forecast the likely future values of financial assets. Technical, fundamental and behavioral studies are the two primary methods for analyzing financial markets.
The technicians do not analysis the cause of price fluctuations; they are just concerned with price effects. The start of using technical analysis in the Japanese rice markets. In the early eighteenth century, a rice trader in Osaka by the name of “Honma Munehisa” created some of the technical procedures that were used in the trading of rice in the Japanese markets. These methods were adopted by the Japanese rice markets. That which is known now as candlestick chart trading in Japan or candlestick Japanese. On other hand; Charles Dow is widely regarded as the founding father of technical analysis in Western. He was the originator of a theory that would later be given the moniker Dow Theory and would express his perspectives on how prices move in the stock market. Others, particularly William Hamilton, Robert Rhea, E. George Shaefer, and Richard Russell, contributed to the continued development of the Dow theory after Charles Dow’s passing in 1902. Addition to Elliott Wave Theory gave analysts, investors, and traders a market structure to work from, complete with specific rules and guidelines. But Gann’s techniques and strategies revolved primarily around his theories on time and price.
The development of technical analysis did not stop at the foregoing only; pricing pattern is considered to be “Classic.” The creation of contemporary price charts is one of the most significant milestones in the annals of the discipline of technical analysis. The many technical analysts, traders, and investors that participate in the world’s various financial markets rely heavily on these graphical depictions of price activity as their major tools. Additions to technical indicators are equations which tell for investor or trader signals for buy and sell a financial asset; within give alarm for overbought and oversold for these assets.
The Principles of Technical Analysis include (1) “Market action discounts everything.” This means the analysis believes that the market values (prices) of financial instruments reflect the available information, (2)” Prices move in trends” This means technical analysts believe that prices trend directionally, i.e., up, down or sideways. (3) “History tends to repeat itself” Technical analysts believe that investors or traders collectively repeat the behavior of the traders and investors that preceded them that according to the emotions.
It is not possible to explain all the tools and methods of technical analysis, The story of technical analysis does not stop, every day there is something new in technical analysis (Murphy, Citation1999), All of the technical tools, like as charts, support and resistance, serve the same function, which is to assist the technician in determining the primary trend and predicting the next market move, but the current study deals with technical indicators. The most important of these indicators can be addressed as follows:
2.3.1. Moving averages
MA is an obsolete instrument used by technicians to arrange disorganised data. In other words, when daily stock prices fluctuate significantly, a moving average is employed to dampen these swings. There are three forms of moving averages: basic, linearly weighted, and exponential Kirkpatrick and Dahlquist (Citation2007). The final one is the most popular since it incorporates all historical pricing information, while the other two do not. Additionally, it allows the technician to assign a weight to pricing data. Moving average may be calculated for any time interval, including 5, 7, 9, 10, 12, 14, 50, and 200 days. The analyst may use one, two, or even three moving averages. Double crossover approaches are used to the two moving averages. It comprises of the shorter moving average and the longer moving average. For instance, when the shorter moving average (10-day MA) crosses over the longer moving average (50-day MA), a purchasing signal known as the golden cross occurs. The dead cross happens when the 10-day moving average falls below the 50-day moving average. Some professionals choose the triple crossover approach. The most common is the 4,9,18-day moving average. The indication to purchase (sell) arises when the 4-day moving average crosses above (below) the 9- and 18-day moving averages (Murphy, Citation1999). Now, some analysts prefer to utilise five moving averages. Figure shows the simple moving average chart.
Figure 1. Simple Moving Average
2.3.2. Oscillators
Oscillators are technical analysis instruments used to determine the market’s momentum and overbought and oversold circumstances (Achelis, Citation2001). Momentum, rate of change (ROC), relative strength index (RSI), moving averages convergence divergence (MACD), and stochastic (%K) oscillators are the most prevalent oscillators.
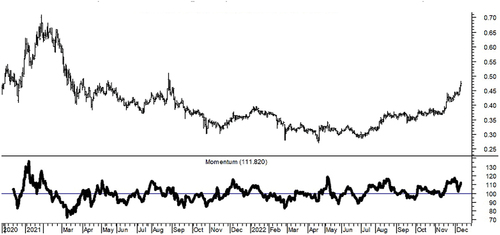
2.3.2.1. Momentum
This indicator indicates the rate of price change as well as the quantity of price change over a certain time period. To calculate 5-day momentum, for instance, you would deduct the closing price from 5 days ago from the most recent closing price. At the bottom of the chart, the values are plotted around the zero line. Typically, the price movement emerges at the momentum before it occurs in the market (Colby, Citation2003). Consequently, momentum is seen as a leading indication. Figure shows Momentum chart.
Figure 2. Momentum chart
2.3.2.2. Moving Averages Convergence Divergence (MACD)
Typically, 12, 26, and 9 exponential moving averages are used to generate the MACD. The three moving averages are transformed into two lines. The MACD line is formed by subtracting 26 moving averages from 12 moving averages. The second line is the MACD’s 9-day moving average, sometimes known as the signal line. Both lines are drawn at the bottom of the graph and oscillate around the zero line. When the MACD line crosses significantly above and below the zero line, overbought and oversold circumstances occur. The signal to buy (sell) happens when the MACD line crosses above (below) the signal line (Achelis, Citation2001). Figure No. (3) shows MACD chart
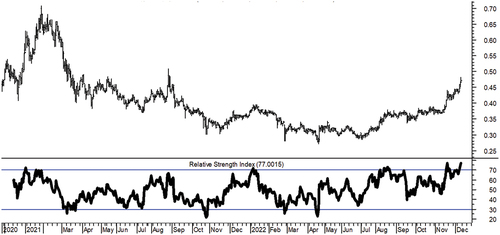
2.3.2.3. Relative Strength Index
RSI is a one-day momentum indicator calculated by subtracting the previous day’s closing price from the current day’s closing price for 14 days. The analyst then decides the up closes and down closes based on the 14-day outcomes. Then, the up closures and down closes are each divided by 14. Divide the average of X days of up closes by the average of X days of down closes to get the RS. Incorporate then the RS into the RSI calculation. This oscillator is shown at the bottom of the graph, oscillating between 0 and 100. The overbought condition happens when the RSI crosses over 70, whilst the oversold condition occurs when the RSI crosses below 30. Each stock has its own overbought and oversold zone, thus during stock research, the back test of past overbought and oversold zones must be considered. The top failure swing happens when an RSI peak surpasses 70 but fails to attain a higher peak, followed by a break of the prior low. In contrast, a bottom failure swing happens when the RSI bottom falls below 30 and fails to form a new bottom, followed by a break of the prior high. The RSI trendline is significant; the breaking of RSI trendline is a signal to buy or sell (Wilder, Citation1978). shows RSI chart
Figure 4. RSI chart
Most of the previous studies dealt with testing technical analysis in stock markets (see: Nazário et al., Citation2017; Nti et al., Citation2020; Wong et al., Citation2003). On evaluating various research in emerging markets and as a consequence of financial inefficiency, the simplest technical trading rules are able to forecast the financial instruments value. In international financial markets, however, the use of these same basic criteria (models) for technical analysis leads to erroneous forecasts (Wafi, Citation2015).
2.4. Artificial neural networks
The notion of artificial intelligence originated in a 1955 Dartmouth Summer Research Project proposal (McCarthy et al., Citation2006). Later iterations of this group hypothesised that “every aspect of learning or any other feature of intelligence can in principle be so precisely described that a machine can be made to simulate it” in an effort to “figure out how to make machines use language, form abstractions and concepts, solve problems currently reserved for humans, and improve themselves (McCarthy et al., Citation2006). Since then, AI has developed into a branch of study devoted to equipping robots with the capacity to do complicated tasks. A pattern of success has progressively formed from this. Turing tests, which evaluate the capacity of machines to exhibit intelligent behaviour (Turing, Citation1995), demonstrate that machines frequently outperform humans in solving complex judgment-related problems, such as the identification of decision variables from an extremely large number of candidates constrained within a high-dimensional space (Pinar Saygin et al., Citation2000).
ANNs are composed of highly interconnected computational elements. They are referred to as neural since they are modelled after the nervous systems of animals. Each computational unit (see ) consists of a set of input connections that receive signals from other computational units and a bias adjustment, a set of weights for each input connection and bias adjustment, and a transfer function that transforms the sum of the weighted inputs and bias to determine the value of the computational unit’s output (Coakley & Brown, Citation2000).
Figure 5. ANN Structure
Source: Coakley and Brown, Citation2000, p. 121.
Artificial Neural Network (ANN) is a biologically inspired computational model that can be used to tackle problems related to traditional machine learning techniques. An Artificial Neural Network consists of a large number of interconnected neurons that communicate with each other by sending and receiving signals. This type of network is capable of learning complex mappings between input and output data sets. These networks are widely used in many areas like computer vision, robotics, autonomous vehicles, natural language processing, and so on. the learning techniques used in Artificial Neural Networks, including supervised and unsupervised learning (Lang et al., Citation2022; Soni et al., Citation2022).
The burgeoning literature on AI and ML in finance has been analysed by scholars in the past. Das (Citation2014), for instance, investigates studies on predictive analytics and text mining in finance. de Prado et al. (Citation2019) addition to both Papíková and Papík (Citation2022) and Wagdi and Tarek (Citation2022) Examine research on credit risk and insolvency, noting an increasing trend in finance research toward the use of hybrid models that integrate classical modelling (e.g., discriminant analysis, logistic regression) with AI, neural networks, and other ML approaches. Kong et al. (Citation2022) Using actual customer data to experimentally investigates the viability of bringing collaborative filtering (CF) as machine-learning techniques to the insurance sector. West and Bhattacharya (Citation2016) Classify the literature on financial fraud detection based on the sorts of scams suggested, the algorithms used, and the effectiveness of detection approaches.
Elliott and Timmermann (Citation2016) Analyze the forecasting methodologies used in economic and financial studies and conclude that no one approach is adequate. They propose that the selection of acceptable forecasting techniques should be based on the economics of distinct loss functions. Currie and Seddon (Citation2017) After the “Flash Crash” of 2010, reveal the “dark art” of high-frequency algorithmic trading and provide conceptual tools for studying high frequency trading. Sangwan et al. (Citation2019) highlight popular FinTech research topics.
According to Goodell et al. (Citation2021) that existing assessments of AI and ML in finance are often narrowly focused, with various topics addressed individually rather than collectively. Notably, none of these previous assessments provide an exhaustive taxonomy of AI and ML applications in finance.
2.5. Integrating ANNs with technical analysis indicators
Technical analysis is a method used to analyze financial markets by studying past price movements in order to identify patterns that can be used to predict future price movements. Technical analysis indicators are mathematical formulas that are used to analyze these patterns and generate trading signals. Examples of technical analysis indicators include the simple moving average (SMA), momentum, moving average convergence divergence (MACD), and relative strength index (RSI)
On the other hand, ANNs are a type of machine learning algorithm that is based on the structure of biological neural networks. ANNs are capable of learning from data and making predictions based on this data. They have been widely used in various fields such as finance, medicine, and engineering.
Integrating ANNs with technical analysis indicators can be beneficial in predicting the exchange rate for emerging economies due to their complementary strengths. ANNs can learn from historical data and make predictions based on this data, while technical analysis indicators can identify patterns in the data that may not be obvious to humans. By combining these two approaches, it is possible to create a more accurate prediction model for exchange rates in emerging economies.
The first step in integrating ANNs with technical analysis indicators is to collect historical data on the currency pair being studied. This data should include technical indicators (the simple moving average (SMA), momentum, moving average convergence divergence (MACD), and relative strength index (RSI)). Once this data has been collected, it should be pre-processed before being fed into an ANN model. This ensures that all values have equal importance when training the model.
Once the pre-processing step is complete, the next step is to train an ANN model using this pre-processed data. The model should be trained using supervised learning techniques such as backpropagation or gradient descent algorithms so that it can learn from past examples and make predictions about future outcomes
3. Study methodology and design
3.1. Study problem
Due to the inherent limits of standard forecasting approaches and the desire to identify hidden patterns in stock market data, academics, researchers, and investors have taken an interest in stock market prediction using AI techniques (Kaur & Dharni, Citation2022). While several studies demonstrate the profitability of technical analysis in stocks (equity), There is no consensus on a particular method for predicting the exchange rate. On the other hand, the current advancement of AI techniques has inspired a variety of studies that further enhance the prediction models for exchange rate markets (Galeshchuk, Citation2017). Therefore, the study topic is to determine whether technical analysis is accurate in predicting exchange rates for emerging economies under artificial neural networks, as AI technique. According to the above, the current study provides an answer to the following questions
Q1:
Could technical analysis indicators predict accurately exchange rates for currencies of emerging economies?
Q2:
Is the improvement of the exchange rate values predicted for emerging economies by artificial neural networks greater than the improvement of the exchange rate values predicted by technical indicators only?
Q3:
Is there a difference between the values predicted by artificial neural networks for emerging economies’ exchange rates and the actual values based on the currency?
3.2. Study hypothesis
According to the research problem and questions, the study can test the following hypotheses:
H1:
There isn’t a significant used of technical analysis indicators to predict the exchange rate for emerging economies.
H2:
There isn’t a significant improvement of the values predicted of exchange rates for emerging economies by artificial neural networks versus the values predicted by technical indicator.
H3:
There isn’t a significant difference of gap between the values predicted of exchange rates for emerging economies by artificial neural networks and Actual values based on currency.
3.3. Study methodology
The tests were done to see how accurate the technical indicators and deep neural networks are when it comes to exchange rates for emerging economies. The study investigates the improvements in predicting exchange rates for emerging economies under artificial neural networks, as AI technique, The learning technique was Supervised learning involves providing labelled training data to an algorithm so that it can learn from it and then put its knowledge into practice when predicting results for unseen input data. with two real data sets partitioned into training and independent test sets using hierarchical multiple regression in addition to Wilcoxon Signed Ranks Test and Kruskal–Wallis Test. The study proposes methods for predicting exchange rates for emerging economies based on four technical indicators: the simple moving average (SMA), momentum, Moving average convergence divergence (MACD) and relative strength index (RSI). The following function expresses the study model.
Where:
SjT :The exchange rate of the country’s currency (J) at the time (T).
SMASj,N: the simple moving average (SMA) of the country’s currency (J) based on (N) period.
MSj,N: The momentum of the country’s currency (J) based on (N) period.
MACDSj,N :the Moving average convergence divergence (MACD) of the country’s currency (J) based on (N) period.
RSISj,N : The relative strength index (RSI) of the country’s currency (J) based on (N) period.
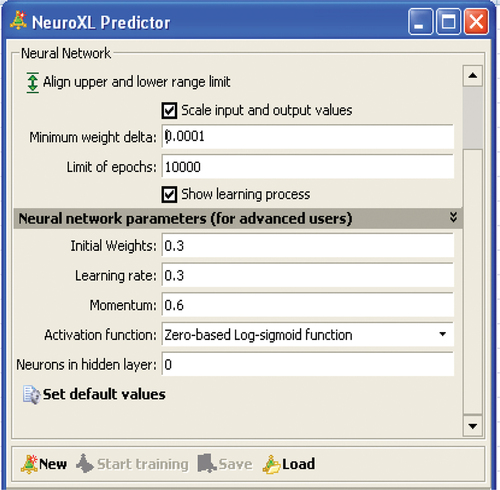
Based on the variation of historical data series of foreign exchange rates between the currencies of the countries under analysis, the monthly data were relied upon to test the hypotheses of the study, in addition to relying on the NeuroXL program (see as a basis for operating the data with artificial neural networks
Figure 6. Artificial neural network Program.

Figure 3. MACD chart
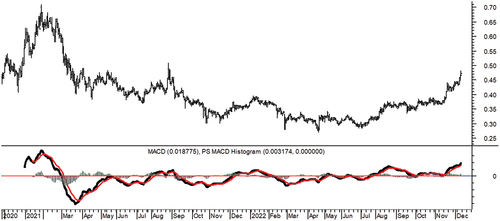
Figure 7. Artificial neural network Parameters.
3.4. Measure variables
The study variables are classified into two groups: the independent and the dependent variables; The independent variables are technical analysis indicators based on historical exchange rates, while the dependent variable is the predicted value of exchange rates, see Table :
Table 1. Study variables
3.4.1. The exchange rate of the country’s currency
The dependent variable is estimated based on the black box, which is a set of mathematical equations and algorithms that depend on finding linear and nonlinear relationships between the inputs of the artificial neural network, which is represented in the current study in technical analysis indicators to estimate the dependent variable, which is the exchange rate rates, during the network training period. Which represents 50 observations based on historical data, while the rest of the time series is used to test the accuracy of the results of the neural network according to the hypotheses of the study.
3.4.2. The Simple Moving Average (SMA)
Where:
SjT : The exchange rate of the country’s currency (j) at the time (T).
N: Number of days (the basis of the moving average and the study applies the basis of 14 months).
3.4.3. Momentum
SjT : The exchange rate of the country’s currency (J) at the time (T).
N: Number of days (the basis of the moving average and the study applies the basis of 14 months).
3.4.4. Moving Average Convergence Divergence (MACD)
Where:
12-Period EMA: Exponential Moving Average for 12 months of the exchange rate of the country’s currency (J)
26-Period EMA: Exponential Moving Average for 26 months of the exchange rate of the country’s currency (J)
3.4.5. Relative Strength Index (RSI)
The very first calculations for average gain and average loss are simple 14-period averages:
First Average Gain = Sum of Gains over the past 14 periods/14.
First Average Loss = Sum of Losses over the past 14 periods/14.
The second, and subsequent, calculations are based on the prior averages and the current gain loss:
Average Gain = [(previous Average Gain) × 13 + current Gain]/14.
Average Loss = [(previous Average Loss) × 13 + current Loss]/14.
3.5. Study sample
The study depends on the months closing of currencies emerging economy; that for 24 currencies, from January 2012 to November 2022 to predicting exchange rate for Emerging Economies currencies. With a total of 131 observation on a monthly basis. The study sample can be shown according to Table .
Table 2. Components of the study sample
4. Data analysis and hypothesis tests
4.1. Stationarity of data
A stationarity test was conducted on the data to ensure that the mean and standard deviation remained constant. The study checks the unit root of each variable; the constant level was used to evaluate the stationarity of the time series of the fundamental independent and dependent indicators at level zero. A significance level of less than 0.05 was used for the Augmented Dickey-Fuller (ADF), Philips-Perron (PP), Im, Pesaran, and Shin W-stat (IPSW), Levin, and Lin and Chut (LLC) tests. In addition, a significance level of less than 0.05 was applied to the Tau- and Z-statistic criteria.
4.2. Descriptive analysis of daily currency returns
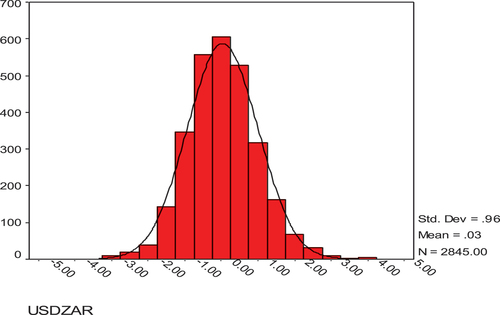
Figures show the returns of holding currencies of emerging economies, based on daily data from 1 January 2012 to 30 November 2022.
Figure 8. Distribution of the hold rate for USD/AED.
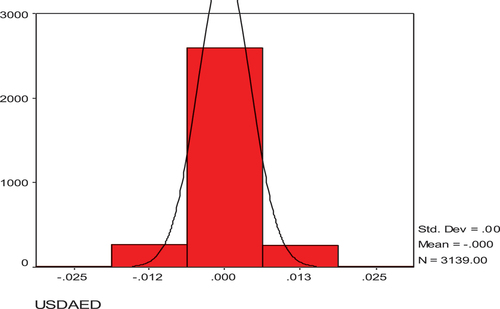
Figure 9. Distribution of the hold rate for USD/ARS.
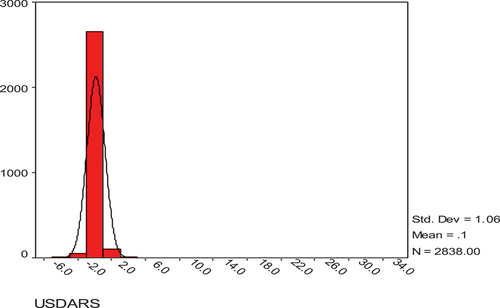
Figure 10. Distribution of the hold rate for USD/BRL.
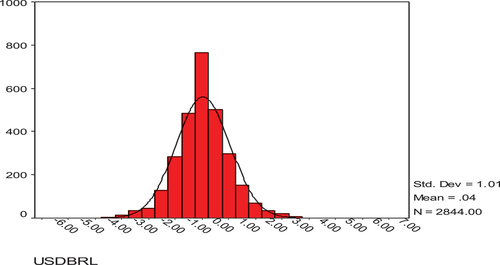
Figure 11. Distribution of the hold rate for USD/CLP.
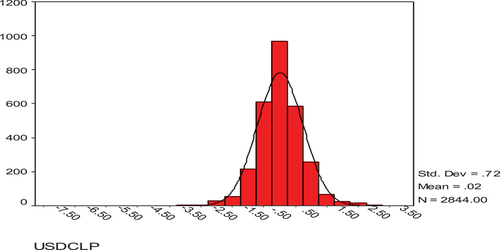
Figure 12. Distribution of the hold rate for USD/CNY.
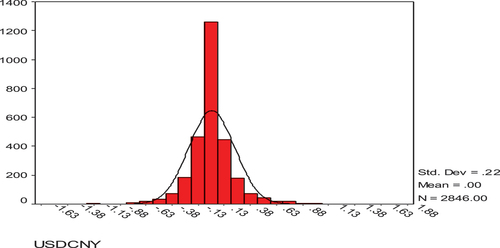
Figure 13. Distribution of the hold rate for USD/EGP.
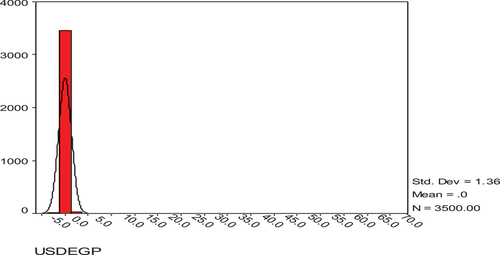
Figure 14. Distribution of the hold rate for USD/ETB.
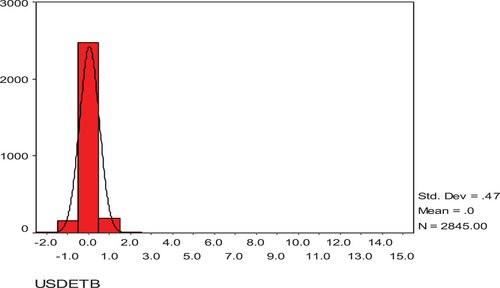
Figure 15. Distribution of the hold rate for USD/INR.

Figure 16. Distribution of the hold rate for USD/IQD.
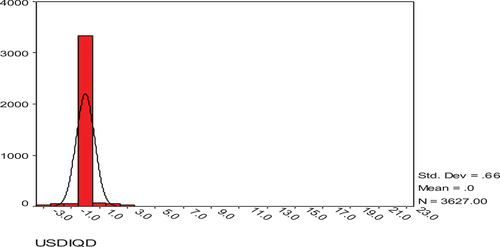
Figure 17. Distribution of the hold rate for USD/JOD.
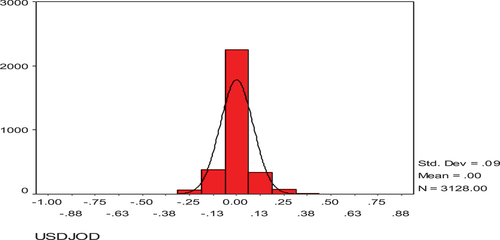
Figure 18. Distribution of the hold rate for USD/KES.
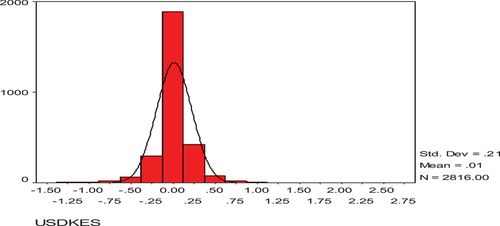
Figure 19. Distribution of the hold rate for USD/MAD.
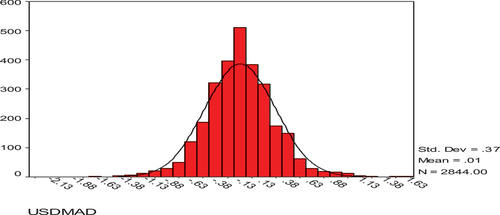
Figure 20. Distribution of the hold rate for USD/NGN.
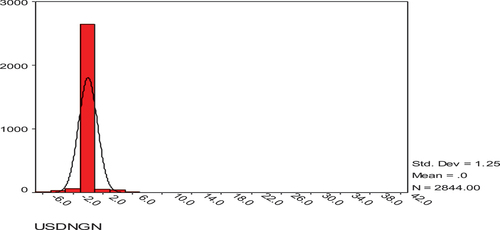
Figure 21. Distribution of the hold rate for USD/PEN.
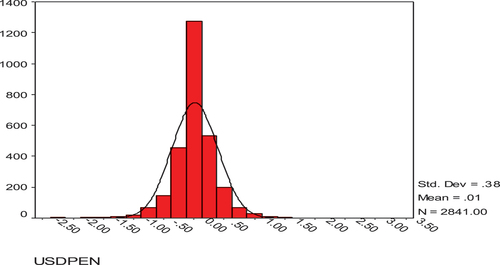
Figure 22. Distribution of the hold rate for USD/PKR.
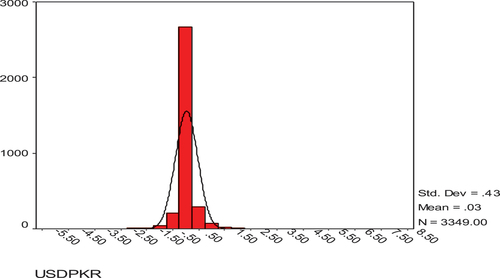
Figure 23. Distribution of the hold rate for USD/PLN.
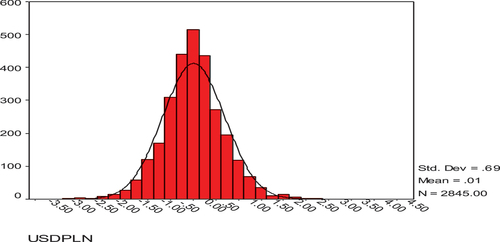
Figure 24. Distribution of the hold rate for USD/RUB.
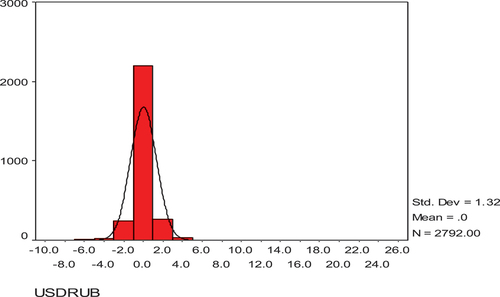
Figure 25. Distribution of the hold rate for USD/SDG.
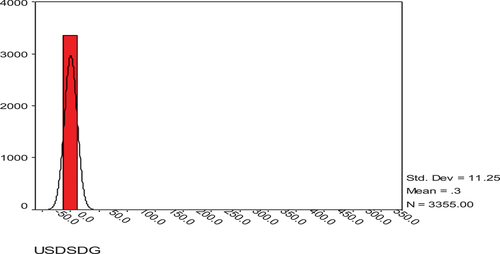
Figure 26. Distribution of the hold rate for USD/TND.
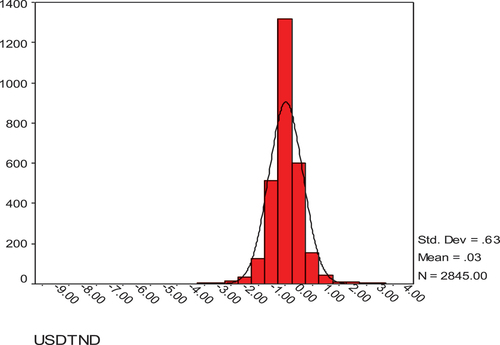
Figure 27. Distribution of the hold rate for USD/TRY.
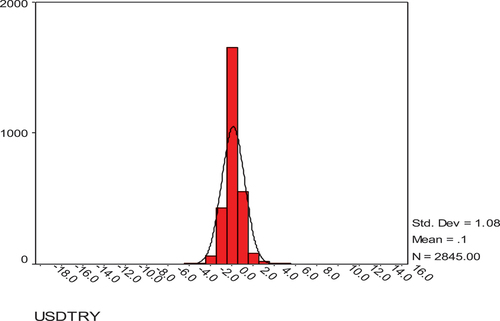
Figure 28. Distribution of the hold rate for USD/TWD.
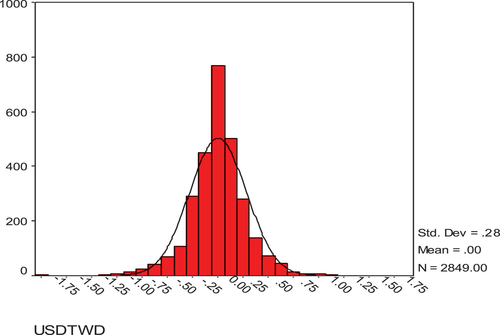
Figure 29. Distribution of the hold rate for USD/VND.
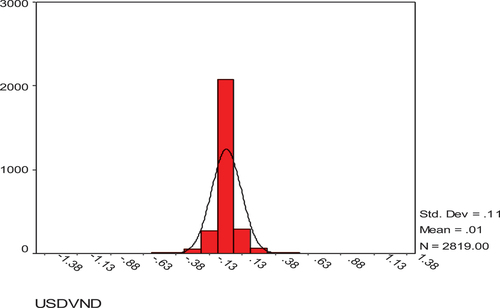
Figure 30. Distribution of the hold rate for USD/XAF.
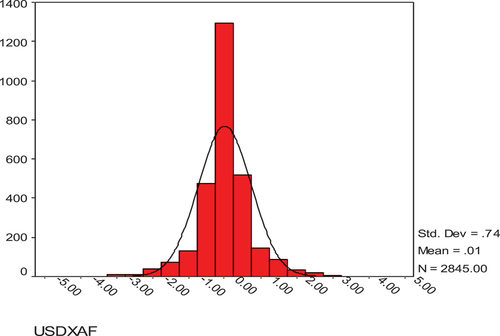
Figure 31. Distribution of the hold rate for USD/ZAR.
4.3. Prediction of the exchange rate under technical indicators
The study used two methods to test the first hypothesis, relying on each of the analyses of the cross-sectional data and Hierarchical multiple regression as follows:
4.3.1. Cross-sectional analysis
It relied on measuring the ability of the expected values of exchange rates (PS) using four indicators of technical analysis—the simple moving average (SMA), momentum (M), moving average convergence divergence (MACD), and relative strength index (RSI)—for the emerging currencies under investigation to interpret the actual values of these currencies (AS) for twenty-four cross-sectional units within eighty observations for each sectional unit.
According to inferential analysis of Table , it turns out that three indicators of technical analysis—the momentum (M), the moving average convergence divergence (MACD), and the relative strength index (RSI)—have an impact on the actual values of exchange rates at the 5% significance level, and according to R-squared, the indicators of technical analysis explain 17.12% of the change in the actual values of these currencies.
Table 3. Cross-sectional analysis between actual values of exchange rates and four indicators of technical analysis
4.3.2. Hierarchical multiple regression
Hierarchical multiple regression is one such time-honored technique that can be used to predict exchange rate movement. This approach involves fitting two or more regression models to understand how a single dependent variable (in this case, the exchange rate) is affected by a set of independent variables. A hierarchical multiple regression model consists of several steps in which independent variables are gradually added to the model in order to improve prediction accuracy. At each stage, additional explanatory variables are incorporated into the model with the goal of obtaining an overall improved fit. Four technical indicators were relied upon, and they were included in the study form, according to Table .
Table 4. Enter technical indicators for the study model
However, the first layer of the regression model was not significant, but there was an improvement in the degree of that importance for the rest of the layers (see Table
Table 5. Significant of model layers
According to the results of the inferential analysis of Table , the study finds importance for each of the third and fourth layers of the regression model, where the value of (F) was (4.511), (8646.474), respectively, and it is a significant value for that model at the level of 1%.
4.3.3. Acceptance or rejection of the hypothesis
Based on the results of the inferential analysis in both Table , the study rejects the null hypothesis and concludes that it accepts the following alternative hypothesis:
There is a significant used of technical analysis indicators to prediction of the exchange rate for emerging economies.
with other words; technical analysis indicators could predict accurately exchange rates for currencies of emerging economies and there is a significant used of technical analysis indicators to prediction of the exchange rate for emerging economies.
4.4. The contribution of artificial neural networks to improve prediction of the exchange rate
As stated earlier Artificial Neural Networks ability learn through experience assist in devising extremely intricate patterns if given enough training samples due its multi-layered structure helps reduce noise can identify outliers while still managing stay within margin errors desired end resulting correctness movements, furthermore its precision increases exponentially with more data being included methodology resulting increasingly accurate predictions given time. The study used two methods to test the second hypothesis, relying on each of the analyses of the cross-sectional data and the Wilcoxon signed rank test as follows:
4.4.1. Cross-sectional analysis
It relied on measuring the ability of the expected values of exchange rates (PS) using Artificial Neural Networks within technical analysis indicators for the emerging currencies under investigation to interpret the actual values of these currencies (AS) for twenty-four cross-sectional units within eighty observations for each sectional unit.
According to the previous inferential analysis, it turns out that expected values of exchange rates have a positive impact on the actual values of exchange rates at 1% significance level, and according to Adjusted R-squared the expected values of exchange rates under Artificial Neural Networks within technical analysis indicators explain 99.4% of the change of actual values of these currencies
4.4.2. Wilcoxon signed ranks test
To test this hypothesis, the outputs of neural networks were compared against traditional data according to the hierarchical regression model, and the results were as follows:
Through the inferential analysis of Table , the study found that there is a difference between the predicted value gaps and the actual values according to the prediction methodology. where the value of (Z) was (−12.882), and it is a significant value for that model at the level of 1%.
4.4.3. Acceptance or rejection of the hypothesis
Based on the results of the inferential analysis in both Tables , the study rejects the null hypothesis and concludes that it accepts the following alternative hypothesis:
There is a significant improvement of the values predicted of exchange rates for emerging economies by artificial neural networks versus the values predicted by technical indicator.
Table 6. Cross-sectional analysis between expected and actual values of exchange rates
Table 7. Wilcoxon signed ranks test outputs
With other words; there is a significant improvement of the values predicted of exchange rates for emerging economies by artificial neural networks versus the values predicted by technical indicator.
4.5. Predicted comparison of currencies of emerging economies
The hypothesis was tested by relying on forecast data according to artificial neural networks. The prediction accuracy was compared between the currencies of emerging economies, by estimating the gap between the predicted and effective rates. Statistical analysis was done using the Kruskal-Wallis Test.
Through the inferential analysis of Table , the study found that there is a difference between the predicted value gaps based on the currency. where the value of (chi-square) was (1910.124), and it is a significant value for that model at the level of 1%. Now, the study rejects the Null hypothesis and conclude that accepts the following alternative hypothesis:
There is a significant difference of gap between the values predicted of exchange rates for emerging economies by artificial neural networks and Actual values based on currency.
Table 8. Kruskal-Wallis test outputs
With other words; there is a significant difference of gap between the values predicted of exchange rates for emerging economies by artificial neural networks and Actual values based on currency.
5. Discussion and conclusions
The participation of companies in the international markets was based on the different justifications for this entry, between reasons of operation, financing, hedging, or arbitrage. One of the drivers of interest in exchange rates, especially at the level of emerging markets, due to direct investment operations and the required international financial decisions that are taken on a daily basis, especially with regard to managing working capital (inventory—accounts receivable—accounts payable). So; exchange rates have an impact on the profitability of each of these companies in addition to the wealth of shareholders. Where the exchange rate has repercussions on the performance of the financial markets in terms of return and risk, in addition to the common stock’s liquidity in emerging markets (Okorie et al., Citation2021; Wagdi et al., Citation2023).
Historically, currency prices are known to be very volatile and difficult to predict due to various factors such as global geopolitics (Hammoudeh et al., Citation2010), economic growth patterns (Hossain, Citation1997) and inflation rate variations (Ali et al., Citation2015). As such industries have always been looking for newer and more advanced methods that can point out the occurrence of such events by predicting what would happen to the exchange rates with a certain degree of accuracy.
As for economic theories for estimating exchange rates, the theory Purchasing Power Parity Theory (PPP) is the most common. Despite its appeal, there are some criticisms about applying PPP theory for predicting short-term exchange rates. For example, theoretical models based on homogeneous pricing across countries can overlook country-specific features such as non-transportable barriers to entry, differences in tastes between consumers or differences in tax regimes among other factors which could cause market distortions or pricing differentials showing up as discrepancies with theoretical predictions put forth based on assumptions made by these models. From the foregoing, the study found that international companies have a need to estimate exchange rates in the short term.
Technical analysis seeks to identify patterns in past exchange rate movements to gain an advantage in predicting future exchange rate movements. To gain insight into trends, commonly used indicators include moving averages (MA), which smooth out noisy price data using a variety of methods such as simple or exponential moving averages. These indicators are often used alongside momentum or volatility-based measures that signal changes or ranges in pace or level respectively. Other popular forms include relative strength index (RSI) which signals overbought/oversold conditions in relation to recent history and MACD (moving average convergence divergence), an oscillator indicator which links two exponential moving averages and can be useful for determining trend reversals. All these technical patterns can be easily combined together through a process known as Technical Expert System Composition (TEC).
According to the results of the inferential analysis for twenty-four currencies against the US dollar from January 2012 to November 2022; the study founds a significant used of technical analysis indicators to prediction of the exchange rate for emerging economies.
On other hand; An ANN is inspired by biological processes that contain many interconnected neurons with each neuron firing according to an input signal provided through its axon. An ANN model consists of nodes arranged into layers separated broadly into input layer(s)/node(s), hidden layer(s)/node(s) and output layer(s)/node(s). It is possible then to adjust weights among them so outputs become close approximations towards desired outcomes by employing learning rules according to analysis of linear and non-linear relationships between the independent variables (technical analysis indicators) and the independent variable (exchange rate).
The study found that from the theoretical view, an integration can occur between artificial neural networks and technical analysis indicators for forecasting exchange rates. During the network construction phase, provided that the predicted exchange rate values are outputs as a result of the new data processing, which is the data that can be compared with the actual values. The model should be trained using supervised learning techniques such as backpropagation or gradient descent algorithms so that it can learn from past examples and make predictions about future outcomes
Through the inferential analysis, the study found that there is a difference between the predicted value gaps and the actual values according to the prediction methodology. the study founds a significant improvement of the values predicted of exchange rates for emerging economies by artificial neural networks versus the values predicted by technical indicator only.
The can back that to Artificial Neural Networks’ ability to learn through experience can aid in the creation of extremely intricate patterns if given sufficient training samples due to their multi-layered structure, which reduces noise and identifies outliers while maintaining the desired margin of error. Furthermore, its precision increases exponentially as more data is added, resulting in increasingly accurate predictions over time.
Through the inferential analysis, the study found a significant difference of gap between the values predicted of exchange rates for emerging economies by artificial neural networks and Actual values based on currency. It is possible to study the interpretation of this result according to the difference in each of the exchange rate regimes in emerging economies, in addition to the difference in structural imbalances between those economies.
The current study suffers from the shortcomings of using just one platform for artificial neural networks, which is why it should be recommended that the study be re-tested on other platforms, as there are other machine learning methods that may contribute positively to the results. On the other hand, the independent variables involved in prediction models can be expanded by adding the dollar index, gold prices (Jain & Biswal, Citation2016), Oil prices (Jain & Biswal, Citation2016; Vochozka et al., Citation2020) and international capital flows as a foreign direct investment (Kiyota & Urata, Citation2004) or a foreign portfolio investment (Wagdi & Salman, Citation2021), and finally by adding other technical indicators to future research.
Finally; Exchange rates have many direct and indirect effects on business decisions such as investment. foreign trade; export and import, and capital inflow and outflow. So, it is very important to apply accurate tool to get accurate predictions which help businesses, government agencies, brokers, and traders in financial markets to perform correct decisions. So, a future study is recommended that creates artificial neural networks that combine basic and technical input to predict exchange rates in emerging economies.
Correction
This article has been corrected with minor changes. These changes do not impact the academic content of the article.
Disclosure statement
No potential conflict of interest was reported by the author(s).
Additional information
Notes on contributors

Osama Wagdi
Osama Wagdi Associate Professor of Business Administration (Finance and Investment), I am an Associate Professor of Business Administration (Finance and investment); I received my Ph.D. from Ain Shams University and my MS.C. from Helwan University (Egypt).
I have teaching experience in more than one institution at the postgraduate level (Master’s - PhD) and Bachelor’s degree My work appeared in a many of academic journals and proceedings, including the “International Journal ofEconomicsandFinance”;“EntrepreneurshipandSustainability Issues”; “Academy of Accounting and Financial Studies Journal”; “Academy of Strategic Management Journal”; “Indian Journal of Economics and Business”; “Linguistica Antverpiensia”; “International Journal of Accounting and Financial Reporting” and “Asian Journal of Finance & Accounting”. as well as participating as a reviewer for manyof the academic journals.
I am interested in linking “concepts, theories, and models” versus “actual practises” in the business environment in the fields of business administration in general, finance and financial markets in emerging markets especially, with regard to securities, banks and nonbanking services, portfolio management, mutual funds, FinTech, Regtech, international finance, feasibility studies, strategic management, and quantitative analysis.
References
- Achelis, S. B. (2001). Technical Analysis from A to Z (2nd ed.). McGraw-Hill.
- Ali, T. M., Mahmood, M. T., & Bashir, T. (2015). Impact of interest rate, inflation and money supply on exchange rate volatility in Pakistan. World Applied Sciences Journal, 33(4), 620–27. https://doi.org/10.5829/idosi.wasj.2015.33.04.82
- Bagella, M., Becchetti, L., & Hasan, I. (2006). Real effective exchange rate volatility and growth: A framework to measure advantages of flexibility vs. costs of volatility. Journal of Banking & Finance, 30(4), 1149–1169. https://doi.org/10.1016/j.jbankfin.2005.05.012
- Chang, R., & Velasco, A. (2000). Financial fragility and the exchange rate regime. Journal of Economic Theory, 92(1), 1–34. https://doi.org/10.1006/jeth.1999.2621
- Coakley, J. R., & Brown, C. E. (2000). Artificial neural networks in accounting and finance: Modeling issues. Intelligent Systems in Accounting. International Journal of Intelligent Systems in Accounting, Finance & Management, 9(2), 119–144. https://doi.org/10.1002/1099-1174(200006)9:2<119:AID-ISAF182>3.0.CO;2-Y
- Colby, R. W. (2003). The Encyclopedia of Technical Market Indicators (2nd ed.). McGraw-Hill.
- Currie, W. L., & Seddon, J. J. (2017). The regulatory, technology and market ‘dark arts trilogy’of high frequency trading: A research agenda. Journal of Information Technology, 32(2), 111–126. https://doi.org/10.1057/s41265-016-0025-3
- Das, S. R. (2014). Text and context: Language analytics in finance. Foundations and Trends in Finance, 8(3), 145–261. https://doi.org/10.1561/0500000045
- Davies, R., Rattsø, J., & Torvik, R. (1994). The macroeconomics of Zimbabwe in the 1980s: A CGE-model analysis. Journal of African Economies, 3(2), 153–198. https://doi.org/10.1093/oxfordjournals.jae.a036803
- de Prado, L. M., 2019. Beyond econometrics: A Roadmap towards financial machine learning. Working Paper No. ID 3365282. Social Science Research Network,
- Elliott, G., & Timmermann, A. (2016). Forecasting in economics and finance. Annual Review of Economics, 8(1), 81–110. https://doi.org/10.1146/annurev-economics-080315-015346
- Eregha, P. (2022). Asymmetric response of cpi inflation to exchange rates in oil-dependent developing economy: The case of Nigeria. Economic Change and Restructuring, 55(2), 1091–1108. https://doi.org/10.1007/s10644-021-09339-3
- Frenkel, J. A., & Mussa, M. L. (1985). Asset markets, exchange rates and the balance of payments. Handbook of InternationaEconomics, 2, 679–747. https://doi.org/10.1016/S1573-4404(85)02005-6
- Galeshchuk, S. (2017). Technological bias at the exchange rate market. Intelligent Systems in Accounting. Intelligent Systems in Accounting, Finance and Management, 24(2–3), 80–86. https://doi.org/10.1002/isaf.1408
- Goodell, J. W., Kumar, S., Lim, W. M., & Pattnaik, D. (2021). Artificial intelligence and machine learning in finance: Identifying foundations, themes, and research clusters from bibliometric analysis. Journal of Behavioral and Experimental Finance, 32, 100577.https://doi.org/10.1016/j.jbef.2021.100577
- Goodhart, C. (1988). The foreign exchange market: A random walk with a dragging anchor. Economica, 55(220), 437–460. https://doi.org/10.2307/2553908
- Goodman, S. H. (1979). Foreign exchange rate forecasting techniques: Implications for business and policy. The Journal of Finance, 34(2), 415–427. https://doi.org/10.1111/j.1540-6261.1979.tb02104.x
- Hammoudeh, S. M., Yuan, Y., McAleer, M., & Thompson, M. A. (2010). Precious metals–exchange rate volatility transmissions and hedging strategies. International Review of Economics & Finance, 19(4), 633–647. https://doi.org/10.1016/j.iref.2010.02.003
- Hossain, A. (1997). The real exchange rate, production structure, and trade balance: The case of Bangladesh. Indian Economic Review, 32(2), 155–177. https://www.jstor.org/stable/29794135
- Jain, A., & Biswal, P. C. (2016). Dynamic linkages among oil price, gold price, exchange rate, and stock market in India. Resources Policy, 49, 179–185. https://doi.org/10.1016/j.resourpol.2016.06.001
- Jin, X. (2021). What do we know about the popularity of technical analysis in foreign exchange markets? A skewness preference perspective. Journal of International Financial Markets, Institutions and Money, 71, 101281. https://doi.org/10.1016/j.intfin.2020.101281
- Kaur, J., & Dharni, K. (2022). Application and performance of data mining techniques in stock market: A review. Intelligent Systems in Accounting. Intelligent Systems in Accounting, Finance and Management, 29(4), 219–241. https://doi.org/10.1002/isaf.1518
- Kirkpatrick, C., & Dahlquist, J. (2007). Technical Analysis. 4.
- Kiyota, K., & Urata, S. (2004). Exchange rate, exchange rate volatility and foreign direct investment. The World Economy, 27(10), 1501–1536. https://doi.org/10.1111/j.1467-9701.2004.00664.x
- Kong, H., Yun, W., Joo, W., Kim, J. H., Kim, K. K., Moon, I. C., & Kim, W. C. (2022). Constructing a personalized recommender system for life insurance products with machine‐learning techniques. Intelligent Systems in Accounting, Finance and Management, 29(4), 242–253. https://doi.org/10.1002/isaf.1523
- Krugman, P. R. (1978). Purchasing power parity and exchange rates: Another look at the evidence. Journal of International Economics, 8(3), 397–407. https://doi.org/10.1016/0022-1996(78)90003-X
- Lang, X., Wu, D., & Mao, W. (2022). Comparison of supervised machine learning methods to predict ship propulsion power at sea. Ocean Engineering, 245, 110387. https://doi.org/10.1016/j.oceaneng.2021.110387
- Makovský, P. (2014). Modern approaches to efficient market hypothesis of FOREX–the central European case. Procedia Economics and Finance, 14, 397–406. https://doi.org/10.1016/S2212-5671(14)00728-X
- Mayfield, E. S., & Murphy, R. G. (1992). Interest rate parity and the exchange risk premium evidence from panel data. Economics Letters, 40(3), 319–324. https://doi.org/10.1016/0165-1765(92)90012-N
- McCarthy, J., Minsky, M. L., Rochester, N., & Shannon, C. E. (2006). A proposal for the dartmouth summer research project on artificial intelligence. AI Magazine, 27(4), 12–14. https://doi.org/10.1609/aimag.v27i4.1904
- Murphy, J. (1999). Technical analysis of the financial market: A comprehensive guide to trading methods and applications. Institute of Finance, Prentice Hill Press.
- Nazário, R. T. F., E Silva, J. L., Sobreiro, V. A., & Kimura, H. (2017). A literature review of technical analysis on stock markets. The Quarterly Review of Economics & Finance, 66, 115–126. https://doi.org/10.1016/j.qref.2017.01.014
- Nti, I. K., Adekoya, A. F., & Weyori, B. A. (2020). A systematic review of fundamental and technical analysis of stock market predictions. Artificial Intelligence Review, 53(4), 3007–3057. https://doi.org/10.1007/s10462-019-09754-z
- Okorie, I. E., Akpanta, A. C., Ohakwe, J., Chikezie, D. C., Onyemachi, C. U., & Ugwu, M. C. (2021). Modeling the relationships across Nigeria inflation, exchange rate, and stock market returns and further analysis. Annals of Data Science, 8(2), 295–329. https://doi.org/10.1007/s40745-019-00206-7
- Papíková, L., & Papík, M. (2022). Effects of classification, feature selection, and resampling methods on bankruptcy prediction of small and medium‐sized enterprises. Intelligent Systems in Accounting, Finance and Management, 29(4), 254–281. https://doi.org/10.1002/isaf.1521
- Pinar Saygin, A., Cicekli, I., & Akman, V. (2000). Turing test: 50 years later. Minds and Machines, 10(4), 463–518. https://doi.org/10.1023/A:1011288000451
- Sangwan, V., Harshita Prakash, P., & Singh, S. (2019). Financial technology: A review of extant literature. Studies in Economics & Finance, 37(1), 71–88. https://doi.org/10.1108/SEF-07-2019-0270
- Soni, J., Gujar, R., Shah, D., & Parmar, P. (2022). Review on Strategic Pavement Maintenance with Machine Learning Techniques. In Shah, J., Arkatkar, S.S., & Jadhav, P. (Eds.), Intelligent Infrastructure in Transportation and Management (pp. 141–151). Springer. https://doi.org/10.1007/978-981-16-6936-1_12
- Taylor, M. P., & Allen, H. (1992). The use of technical analysis in the foreign exchange market. Journal of International Money and Finance, 11(3), 304–314. https://doi.org/10.1016/0261-5606(92)90048-3
- Turing, A. M. (1995). Computing machinery and intelligence. In E. A. Feigenbaum & J. Feldman (Eds.), Computers & thought (pp. 11–35). MIT Press.
- Vochozka, M., Rowland, Z., Suler, P., & Marousek, J. (2020). The influence of the international price of oil on the value of the EUR/USD exchange rate. Journal of Competitiveness, 12(2), 167. https://doi.org/10.7441/joc.2020.02.10
- Wafi, A. S. (2015). Profitability of technical analysis rules in emerging and developed markets. China-USA Business Review, 14(10), 495–503. https://doi.org/10.17265/1537-1514/2015.10.002
- Wagdi, O., Farouk, M., & Abdou, S. A. H. A. (2023). The mediating role of common stock’s liquidity between ownership structure characteristics and corporation’s value: Evidence from emerging markets. International Journal of Applied Economics, Finance and Accounting, 16(2), 274–287. https://doi.org/10.33094/ijaefa.v16i2.980
- Wagdi, O., & Salman, E. (2021). The impact of sovereign credit ratings on foreign portfolio investment flows to emerging markets. Indian Journal of Economics and Business, 20(3), 751–768. http://www.ashwinanokha.com/resources/ijebv20-3-42.pdf
- Wagdi, O., & Tarek, Y. (2022). The integration of big data and artificial neural networks for enhancing credit risk scoring in emerging markets: Evidence from Egypt. International Journal of Economics and Finance, 14(2), 32–43. https://doi.org/10.5539/ijef.v14n2p32
- Wall, L. D. (2018). Some financial regulatory implications of artificial intelligence. Journal of Economics and Business, 100, 55–63. https://doi.org/10.1016/j.jeconbus.2018.05.003
- West, J., & Bhattacharya, M. (2016). Intelligent financial fraud detection: A comprehensive review. Computers & Security, 57, 47–66. https://doi.org/10.1016/j.cose.2015.09.005
- Wilder, J. W. (1978). New Concepts in Technical Trading Systems. Hunter Publishing Company.
- Williamson, J. (2004). The choice of exchange rate regime: The relevance of international experience to China’s decision. Working Paper. Institute for International Economics.
- Wong, W. K., Manzur, M., & Chew, B. K. (2003). How rewarding is technical analysis? Evidence from Singapore stock market. Applied Financial Economics, 13(7), 543–551. https://doi.org/10.1080/0960310022000020906
- Xiaojun, L., & Tang, P. (2020). Stock index prediction based on wavelet transform and FCD-MLGRU. Journal of Forecasting, 39(8), 1229–1237. https://doi.org/10.1002/for.2682