
Abstract
This study’s purpose is to assess fiscal federalism’s effect on public service provision in Ethiopia. The study adopted an explanatory research design. Considering 10 Sub-National Governments (SNGs) from 2005 to 2018, it employed Partial Least Square Structural Model (PLS-SEM). It also utilized Gaussian copula (GC) estimations since it helps to avoid the endogeneity. The study proved that expenditure decentralization significantly fosters public service provision. Revenue decentralization has no significant role in enhancing public service provision. Besides, though expenditure decentralization has adversely affected SNGs’ capacity, revenue decentralization positively contributes to SNGs’ capacity. On the one hand, SNG’s capacity plays a significant positive mediating role in the impact of revenue decentralization on public service provision. On the other hand, it negatively mediates the contribution of expenditure decentralization on public provision. The most important implication is that the government should raise revenue sources for SNGs and reduce federal grants. In addition, inter-governmental fiscal interactions should uphold the benefit principle and connectedness between the expenditure and revenue sides. The present study bridges gaps in the existing knowledge since it embraced ignored variables (i.e. SNG capacity) essential in the debates of fiscal federalism theories. Therefore, this makes the study more complete and gives a remedy for the piecemeal work of previous studies.
PUBLIC INTEREST STATEMENT
Though Ethiopia launched a decentralization initiative in 1991, the public service provisions are still on the grassroots level. The paper deals with the nexus between fiscal federalism and public service provisions in Ethiopia: A mediating role of Subnational governments (SNGs) capacity. The study employed Partial Least Square Structural Equation Modeling (PLS-SEM).
The study findings revealed that expenditure decentration significantly boosts public service provision. Revenue decentralization has little input to public service provision. Besides, however, expenditure decentralization has unfavorably affected SNGs’ capacity, while revenue decentralization lifts SNGs’ capacity. Furthermore, SNG’s capacity positively mediates the effect of revenue decentralization on public service provision. The study urged the government to raise revenue sources for SNGs and reduce federal grants. Moreover, there should be a solid connection between expenditure and revenue decentralization.
1. Introduction
The choice and allocation of fiscal authority for decision-making among various tiers of government are known as fiscal federalism; yet, because nations have had multiple experiences, it is necessary to allow for more clear abstraction (Moges, Citation2008, Morozov, Citation2015). Over a couple of decades, fiscal federalism has been a center of debate in public finance literature. An increasing number of nations are using fiscal decentralization to enhance the functionality of their public sectors; the procedure generally comprises determining the best allocation of duties and authority between the federal and sub-national governments (Moges, Citation2008, Morozov, Citation2015).
First-generation fiscal federalism theory (FGFF) and second-generation fiscal federalism (SGFF) are the two theoretical strands describing fiscal federalism’s historical development. Fiscal federalism aims to hand over the public service delivery responsibilities to different tiers of government. However, the passing on public service provisions responsibilities is at the expense of the economic scale of the central government; it may be offset by efficiency gain due to local government information advantage of local preferences since they are close to the community (Boadway & Tremblay, Citation2012).
The “new fiscal federalism” (Oates, Citation2005), which adopts a public choice viewpoint, modified the FGFF. It argues that government officials and elected officials are more concerned with their utility than with maximizing the welfare of the electorate. On the other hand, SGFF proponents Brennan and Buchanan (Citation1980) consider decentralization as a restrictive instrument for sub-national governments’ unwanted actions by promoting competition to provide better public service and raise income through market-preserving goods. Following decentralization reform, the actions of sub-national governments are accustomed to characterizing the needs of citizens and preserving markets (Zhuravskaya, Citation2000, Jin et al., Citation2005).
The results of scholars who have examined the effect of fiscal federalism on public service providers need to be more consistent. For example, some studies have found a negative contribution of fiscal federalism to social welfare (Syamsul, Citation2003; Henseler, Citation2014; Sow & Razafimahefa, Citation2015). In contrast, others claim a significant positive contribution of fiscal federalism on public service provision (Zhuravskaya, Citation2000, Robalino et al., Citation2001, Busemeyer, Citation2008, Diaz-Serrano & Rodríguez-Pose, Citation2012, Lozano-Espitia & Martínez, Citation2013, Ferrante, Citation2016). These contradictory findings suggest the need for more research. Besides, they use only one or two indicators to measure fiscal federalism and public provisions. Most importantly, they ignored the capacity of Subnational Governments (SNGs), which is crucial to determining whether decentralization efforts are successful or unsuccessful in any nation. The present study fills this gap since it uses multiple indicators for the constructs and answers how capacity mediates the effect of fiscal decentralization on public provisions, making the study more comprehensive.
No nation in the world today exercised similar ethnic federalism arrangements as Ethiopia. Through a combination of five layers of government (federal, regional state, Zone, woreda, and local), everyone has an almost alike arrangement in the judicial, legislative, and executive spheres (Bushashe & Bayiley, Citation2023b). Ethiopia began its devolution initiative in 1991 to pursue ethnic federalism (Ghebrehiwet, Citation2015, Lee, Citationn.d.). Under the ethnic line citizens belong to, this arrangement recognizes citizens and refuses to appreciate citizens who want to identify themselves under the banner of Ethiopian nationalism (Bushashe & Bayiley, Citation2023a). To put it differently, for people who want to be identified by their ethnic origin, it acts as a “real mother” and a “surrogate mother” for a citizen who has identified himself under Ethiopian nationalism, which makes Ethiopia’s federalism a “mother of segregation” (Bushashe & Bayiley, Citation2023a, p. 1).
Moreover, the fiscal federalism of Ethiopia has taken place under a weak institutional capacity (Meheret, Citation2007, Paulos, Citation2007). This poor institutional capacity hinders SNG from exercising the devolved functions as intended. It also has a characteristic of a highly decentralized expenditure assignment and weakly decentralized revenue allocation. However, in practice, practically all the SNGs offer, at least in part, vital (redistributive) public services, including healthcare, education, and social assistance, all of which require sizable financial resources. Notwithstanding all difficulties and barriers, this strategy primarily aims to boost economic growth, advance fairness, and raise citizens’ living standards. Thus, the study examined the link between fiscal federalism and public provisions.
The subsequent sections make up the remaining portion of the study. A review of the literature is provided in Part 2, followed by discussions of the methodology and conceptual model in Part 3, the results in Part 4, and the conclusions in Part 5. The last part of the paper discusses the conclusion, the implications for policy, and avenues for future research.
2. Literature review
2.1. Overview of fiscal federalism in Ethiopia
Under Emperor Haile Selassie, Ethiopia had a long history of substantial central control and a centrally planned economy under the Mengistu regime. Both revenue and expenditure have been intensely concentrated under the unitary state of Ethiopia. After the fall of the military regime in 1991, the Transitional Government of Ethiopia (TGE) installed a federal assembly by forming ethnic-based territorial states. The TGE initiated a far-reaching institutional and political transformation. It made an essential move towards the lounge decentralization program and restructuring along with the federal lines.
Ethiopia had four tiers of government until 2001: federal, provincial, woredas (municipal/city), and kebele (neighborhood level) (Lee, Citationn.d., Meheret, Citation2007). In 2001, the revision of the Constitution of 1995 resulted in the recognition of an additional layer of local government, the zoning government. Intermediaries between regional states and woredas are zonal governments. An underlying theme of the TGE Proclamation No.7/1992 was the planning and management of socioeconomic institutions and guidance on how budgets should be prepared, approved, and implemented. It also offers guidelines on borrowing and levying necessary taxes and duties from domestic sources. Besides, expenditure allocations are decentralized, whereas revenue allocations are centralized, which essentially enhances the control of the central government over subnational spending (Paulos, Citation2007, Ghebrehiwet, Citation2015).
The 1995 constitution entitled the House of Federation (HoF) to formulate and revise the grant allocation formula. The grant allocation formula of 2009 begins with estimating the relative fiscal deficit, including the regions’ relative revenue and expenditure capacity—the formula considered balancing both vertical and horizontal imbalances. The Representative Tax System (RTS) and the Representative Expenditure System (RES) methods determine the revenue capacity and expenditure needs of the regions (Ghebrehiwet, Citation2015). Therefore, the basic procedures for setting each region’s revenue potential and expenditure needs are computed based on these approaches.
2.1.1. The aims of the decentralization program in Ethiopia
One of the worst humanitarian crises of the twentieth century, the Ethiopian famine in the 1980s, stimulated interventions of people worldwide to halt widespread food shortages and rescue people. Nowadays, famine in Ethiopia is due to both the absence of development and rains. Transporting food crops from areas with excess food to those with a deficit is hampered by a lack of highways, storage, and marketing facilities (Paulos, Citation2007). A substantial dependence on rainfed agriculture makes the nation especially prone to the effects of changing climates (Meheret, Citation2007). Currently, the country has exhibited declines in economic growth, a substantial population increase, underdeveloped institutional capacity, and high levels of violence.
The impacts of climate change in Ethiopia are expected to worsen land degradation and biodiversity, negatively affecting the agricultural output (Ghebrehiwet, Citation2015). Through decentralizing the agriculture sector, the country aimed to enhance agricultural outputs and reduce natural disasters such as floods and droughts through an effective natural resource conservation system.
Almost every area in the country has experienced ethnic-based conflict since the restructuring of the government in conjunction with ethnic lines (Bayu, Citation2022). In addition, ethnic federalism in Ethiopia rekindled armed-based ethno-nationalist and separatist groups in the nation (Bayu, Citation2022). Religious affiliation is nearly universal in Ethiopia. Most Ethiopians identify as Orthodox, Muslim, or Protestant, with a minority following traditional religions. Religion can often provide significant political capital for peacebuilding.
Ethiopia’s fiscal federalism aims to help national or regional state governments, based on their initiatives, improve their regions and narrow the prevailing gap between regions regarding economic growth and development (Ghebrehiwet, Citation2015). The government must assure regional equity and lessen the likelihood of food rights breaches, such as using food aid for political patronage, in Ethiopia’s extremely delicate political and ethnic setting (Bayu, Citation2022). Since fiscal decentralization brings efficient public service delivery and economic growth, fills development gaps, and reduces income inequality, it can avoid the risk of civil war and instability in the country. Therefore, investigating the nexus between fiscal federalism and public service provision is essential, especially in a developing country like Ethiopia.
2.1.2. Federal and SNGs budget allocation in Ethiopia
Ethiopia makes budget allocations to Ministerial offices based on sectorial categories. The money set aside for national defense has grown by 33%, growing its fraction of the overall government budget by 1%. However, despite rising nominal values for health and education, the percentages of the federal budget devoted to these two areas have somewhat decreased. Urban planning and building, education, and public debt finance receive the top three budget allocations (See Table in the Appendix).
Primary and secondary education, health care, rural transportation, agricultural services, and services about natural resources are all critical services SNGs in Ethiopia provide. According to a formula formulated by HoF, the national government distributes budget subsidies for SNGs each fiscal year. According to the current trend, between 2017 and 2021, the nominal value of the budget allotted to regions grew by 75%. It translates to ETB 204 billion for 2022, up 16% from its value in 2021. Nevertheless, the budget’s worth has decreased by 4% in actual monetary value because of the high inflation rate.
2.1.3. Federal government debt and borrowings
The government has significantly invested in infrastructure, health, education, and other fields to promote economic growth and combat poverty over the past few decades. The government must borrow money for this spending, state-owned companies, and infrastructure projects. The most significant increase in external debt occurred during the fiscal year 2010/11–2014/15, i.e., Growth and Transformation Plan (GTP I), with an average yearly growth rate of 24%.
Ethiopia’s external public debt increased from 2.3 billion dollars in fiscal year 2006/2007 to 28.6 billion dollars in 2020, an increase of 20% each year. Infrastructure expenditures, especially infrastructure, necessitate a sizable amount of financing from outside sources. As foreign debts for significant public projects come due, the government’s budget for debt servicing has grown, raising the danger of debt difficulty. Between 2019/20 and 2021/22, the federal budget’s debt financing share climbed from 10% to 13.1% (NBE, 2022).
Since borrowing is the only purview of the federal government, a system of intergovernmental transfers is set up to bridge the funding gap between SNGs’ budgetary obligations and their sources of income. A significant vertical imbalance has been caused by the distribution of revenue sources, which is the sole responsibility of the national governments. In the 2019/20 fiscal year, SNGS collected only 27% of tax revenue, compared to the central government over 73% (NBE, 2020).
2.1.4. Sub-national government borrowing
Existing rules constrain the borrowing power of the SNGs and are entirely regulated by the Federal Government regulates existing regulates and constrain the borrowing power of the SNGs. FDRE Proclamation No 57/1996 specifies that MoFEC shall assess the amount borrowed from each SNG, considering national fiscal policy and the borrowing limits imposed by law or agreements. In addition, the disbursement of SNG borrowings is handled by the NBE (unless these borrowings are from entities other than the NBE).
Moreover, if the Regional Governments borrow from institutions other than NBE, the respective SNGs and MoFEC shall jointly agree on administrative arrangements relating to these borrowings. In practice, the critical originator of regional debt is the Commercial Bank of Ethiopia (CBE), which loans the regions at an annual subsidized rate of 7.25%. According to MoFEC and CBE, approximately 30% of SNG borrowing is used through agricultural cooperatives to provide their farmers with fertilizer credit. The remainder is used for various projects, including infrastructure projects.
2.1.5. Currency stability and international trade regulatory framework
The value of the domestic currency of Ethiopia (Birr) is not freely convertible. Following managed floating, the NBE gradually depreciated the Birr with sporadic, more substantial adjustments to reflect changes in the parallel market. The Birr has declined by almost 40% against the US dollar since January 2022. It has caused the country to suffer a severe currency depreciation worldwide.
Most developing nations have liberalized trade and worked to build supportive environments to draw foreign direct investment (FDI). Ethiopia took the road to liberalizing trade and macroeconomic management and introducing actions to improve the international trade regulatory framework that attracts and protects foreign investors. With the existing regulatory structure, foreign investors can invest by establishing subsidiaries or locally formed businesses. The hydropower sector is now accessible to both domestic and foreign investment due to the updated Investment Proclamation No. 116/1998. Furthermore, the 1998 Investment Code permitted joint private-government investments in telecommunications and defense.
Manufacturing, agriculture, real estate development, education and health services, mining, engineering, and management consulting are the primary commercial sectors open to foreign investment. The investment proclamation stipulates domestic joint venture partners must maintain at least 27% equity ownership interest.
2.2. Fiscal federalism and public service provisions
Tiebout (Citation1956), Musgrave (Citation1959), Tanzi (Citation1996), and Oates (Citation1972) first propagated the original definition of fiscal federalism. Musgrave’s (Citation1959, Citation1989) significant work presented the government’s functions and primary economic position by tripling it into three categories: allocation, distribution, and stabilization.
Tiebout (Citation1956) made a significant contribution from which most conclusions emanate from the conventional theory of fiscal federalism. He encourages fiscal decentralization if and only if the advantage of local government knowledge about the community’s local public goods preference is more significant than the economies of scale advantage of the central government. In this case, to achieve allocation effectiveness, it is better to provide local government with public goods, which could, in turn, bring optimum local social welfare.
The presence of factor mobility makes local governments compete and make the utmost effort to keep them inside their jurisdiction and attract people from other jurisdictions by improving social welfare. Most importantly, People “choose by their feet,” deciding where to reside based on their expectations regarding tax and public goods, as local councils strive to provide a combination of tax and public goods (Oates, Citation2005). This notion delivers a stance to argue that ‘the amount of social security realized by unvarying delivery of public services by a national government is poorer than that accomplished through a decentralized provision.
The FGFF assumes that sub-national government politicians and bureaucrats are benevolent and are always motivated to satisfy the need of citizens rather than their personal and political motivations (Oates, Citation1972, Citation2005). It sets an overall regulatory framework for assigning responsibilities to various government layers and the suitable fiscal tools to perform the assigned tasks. The basic principle in FGFF is that SNG must be capable of offering goods and services tailored to its constituents’ specific requirements and situations. The fundamental premise is that the lowest tier of government should be responsible for providing public services, which encompasses the pertinent costs and benefits geographically. Efficiency and economic welfare were improved compared to a more uniform allocation system.
There is no question that explicit spending allocations are required to ensure stable institutions and effective service delivery. The primary challenges with the assignment of expenditure obligations are the absence of a clear expenditure assignment, the ambiguity of specific assignments, and the co-sharing assignment. The municipal governments rely on various local sources of earnings to pay for their expenses. Taxes, user fees, and the rent or sale of real estate owned by the SNG make up the SNG level’s allotted revenues. The SNGs frequently need to have much discretion over regional revenues. Therefore, with limited power over resources, the SNGs rely significantly on central government transfers.
Brennan and Buchanan (Citation1980) came up with another dimension of viewing government bureaucrats and local government politicians closely from the viewpoint of the political economy. The Leviathan approach, diverging from conventional views of fiscal federalism, considered public servants an apparent inclination to increase their gratification through their rent-seeking actions rather than being a benevolent policymaker statement of the conventional argument of fiscal federalism. It regarded decentralization as a move to minimize the size of the public sector. It limited local government revenue-maximizing behaviors since it urged regional government self-sufficiency in their expenditure needs, emanating from the benefit principle.
Any wrong move of the central government penalized by household mobility or others intervenes in the marketing system. However, because of the fear of penalties, such competition can force the local government to increase its revenue and encourage it to reduce taxes to attract households in other jurisdictions. It creates a race-to-the-bottom effect that reduces the quality and quantity of public goods supplied and worsens the social welfare of the community within the region. Weingast’s (Citation2009) conceptual paper argued that local government only sometimes maximizes revenue solely to achieve the intended objectives.
Studies focusing on the influence of fiscal decentralization on public service delivery focus exclusively on the hypothesis of fiscal federalism: decentralizing public provisions to a lower level of government improves public service provisions because the lower tier of government knows local community preferences better than the higher level of government (e.g., Syamsul, Citation2003, Sow & Razafimahefa, Citation2015, Ferrante, Citation2016, Arends, Citation2017, Silas, Citation2017).
2.3. Decentralization and income inequality (disparity)
Prud’homme (Citation1995) argued that redistributive authority is given to the central government or centralized for two reasons. First, if it is decentralized to the sub-national government, the region with wealthy citizens will get better than the regions with poor people. Thus, instead of reducing the income gap, it will widen the regional disparity. Mainly because the regional government only considers the inequalities of citizens residing there and tries to close the income gaps between residents outside their territory. Second, either similar or different redistribution policies pursued by the regional government, citizens with similar incomes before a redistributive program may have different incomes after redistribution.
Fiscal responsibilities conferred to SNGs imply that SNGs must pursue competent tax and expenditure decisions (Canare et al., Citation2020). SNGs rely on transfers from the national government since they cannot collect their taxes. Such reliance leads to ineffectiveness because the transfers may need control and be prone to political motives (Bojanic, Citation2018). Additionally, SNGs have a greater understanding of their specific communities’ demands, enabling them to provide public services with more knowledge (Canare et al., Citation2020). When choosing the decentralization mix, it is vital to consider a nation’s current level of development and underlying institutional structure significantly when reducing economic inequality is a primary aim (Bojanic & Collins, Citation2021).
Moreover, the decentralization mix is essential for addressing income disparity. According to Bojanic (Citation2018), decentralization may not result in greater or lesser degrees of income inequality; different areas’ internal social and political systems play a more prominent role in determining disparity. Canare et al. (Citation2020) empirical finding urges that when it comes to improving inequality, empowering local governments to generate revenues is a more important aspect of decentralization than devolving spending responsibilities. Similarly, Bojanic and Collins’s (Citation2021) investigation validated that decentralization decreases income disparity, but the outcome lessens and ultimately converses as economic development rises.
2.4. Fiscal federalism and sub-national government capacity
The theory of FGFF promotes centralizing revenue relative to expenditure; the central government is in charge of redistributive responsibility (Oates, Citation1972, Citation2005). The theory known urging to give all responsibilities to the national government regarding taxation of movable inputs, such as income, payroll, and sales taxes, to reduce production factors’ movement; this tax base holds a large share of government revenues ((Boadway & Tremblay, Citation2012, Moges, Citation2008). However, the SGFF strongly urged the self-sufficiency of local government spending needs through the concept of benefit, which presented that the benefit earned by citizens would be proportionate to its cost (Weingast, Citation2009). Moreover, until they reach the point where the marginal revenue of local public goods and the marginal cost of production of SNGs public goods are equal, SNGs should increase their production of public goods. In reality, the benefit principle is difficult to implement because the public goods (e.g., education and health) provided by the local government are quasi-private goods and are heavily affected by regional government capacity.
While discussing decentralization, considering “capacity” is necessary since it is an essential issue (Fiszbein, Citation1997, as cited in Ribot, Citation2002). Launching a decentralization program requires setting and considering whether SNGs have the minimum standard level of institutional capacity to implement and achieve decentralization goals (Tanzi, Citation1996, Prud’homme, Citation1995). In addition, a review of SNG’s abilities considers financial costs, inefficient resource usage, and countermeasures for lack of financial restraint (Tanzi, Citation1996, Prud’homme, Citation1995). Eventually, the achievement of fiscal federalism policies pivots on institutional capacity-building. Besides, the capacity of managing service provision depends on the central government’s support of decentralization (Rondinelli, Citation1982).
Regional capacity can be discussed from different viewpoints: fiscal capacity, institutional capacity (mostly related to government quality), and physical and human infrastructural capacity. Public investment in infrastructures such as schools and hospitals may improve social welfare by providing access to public health and education services (Kis-Katos & Sjahrir, Citation2017). Besides, public investment in infrastructures such as roads, telecommunication, electricity, and energy may increase total production since it can facilitate market transactions. It may also enhance equity by giving access to infrastructure to people experiencing poverty that have not previously and by catalyzing local economic activity that increases household income (Rompuy, Citation2017). However, there is a strong argument over the sequence that comes first (decentralization or capacity), which means there is a chicken-and-egg problem. Therefore, additional studies are required to examine the way capacity is connected to decentralization and the aims of decentralization. The study explores how SNG capacity mediates the effect of decentralization on public service provisions.
2.5. Conceptual model and research hypotheses
In an SEM analysis, various routes in a diagram show the cause-effect links between the variables. According to Bushashe (Citation2023), analysis was carried out in steps, including (1) differentiating between reflective and formative construct; (2) utilizing the measurement model, which reveals the association between observable items and their constructs; (3) with the SEM, which embraces gauging the link between the constructs; and (4) employing PLS predict tool to measure the model’s prediction power.
The study attempted to check the subsequent research hypotheses depicted in the conceptual model figure (See Figure ).
Figure 1. Conceptual model.
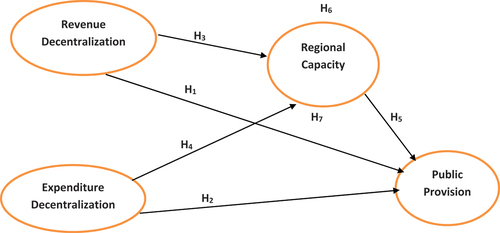
H1:
Revenue decentralization has a statistically significant positive effect on public provision.
H2:
Expenditure decentralization has a statistically significant positive effect on public provision.
H3:
Revenue decentralization has a statistically significant positive effect on SNG capacity.
H4:
Expenditure decentralization has a statistically significant positive effect on SNG capacity.
H5:
SNG capacity has a statistically significant positive effect on public service provision.
H6:
SNG capacity positively mediates the linkage between revenue decentralization and public service provisions.
H7:
SNG capacity positively mediates the linkage between expenditure decentralization and public service provisions.
3. Methods
A robust study instrument for scholars, PLS-SEM is a second-generation data analysis procedure implemented to execute advanced modeling that includes mediation (Lowry & Gaskin, Citation2014, Hair et al., Citation2017). Lastly, the PLS-SEM is evolving into a cutting-edge statistical technique due to extensive discussions regarding its advantages and disadvantages. Covariance-based (CB) SEM and PLS-SEM are the two forms of SEM (Lowry & Gaskin, Citation2014, Garson, Citation2016). PLS-SEM is a prediction-oriented technique for SEM. It is mainly employed for exploratory studies and is suitable for confirmatory research (Lowry & Gaskin, Citation2014, Hair et al., Citation2021). Moreover, PLS-SEM accounts for variance like standard least squares regression (Lowry & Gaskin, Citation2014; Garson, Citation2016).
Henseler et al. (Citation2014) and Hair et al. (Citation2017) urge that the subsequent conditions make PLS-SEM a superior CB-SEM substitute: inadequate sample size, incomplete theory existing for usage, stress on predictive accuracy, and failure to ensure accurate model parameters. A flexible modeling method for SEM requires no requirement regarding the data distribution (Hair et al., Citation2017). Reflective and formative outer models are typically two distinct assessments of PLS-SEM indicators. Reviewing the indicator reliability of every single item, the reliability of every latent variable, internal consistency, construct validity, convergent validity, and discriminant validity form a component of the reflective outer model examination (Henseler et al., Citation2014, Latan & Ghozali, Citation2013, Hair et al., Citation2021).
Measures used in secondary data sources are not constructed and kept through a period for confirmatory studies (Bushashe, Citation2023). On the other hand, survey indicators are commonly constructed to back a full-fledged theory (Sarstedt & Mooi, Citation2019). Thus, it is questionable to establish a robust model utilizing indicators of secondary data if employing CB-SEM. Hair et al. (Citation2014), the main benefit of PLS-SEM is that it allows unlimited use of single-item and formative variables. In exploratory research, it is typically employed to generate theories (Nitzl, 2016; Hair et al., Citation2021). The Gaussian copula method without instrumental variables (IV) is becoming increasingly popular among researchers in various domains (Becker et al., Citation2021).
Studies have employed this technique to detect and fix endogeneity when approximating regression models (Becker et al., Citation2021). Smartpls version 4 software enables the Gaussian copula method, bringing an additional ability to PLS-SEM that assists scholars in addressing endogeneity issues. Moreover, most importantly, first-generation statistics, such as panel regressions, forces construct (variable) that have two or more indicators to use average or to execute a separate regression runs to each indicator. The second-generation statistics, i.e., PLS-SEM, alleviates this limitation by allowing concurrent use of indicators. The present study polled the data as a cross-section to cultivate these advantages, like a study by Bushashe (Citation2023). Therefore, the present study utilized PLS-SEM.
3.1. Data source and sample size
For the analysis of actual events, secondary data is becoming more and more accessible (Bushashe, Citation2023). The secondary data for the current study is collected from the documents of MoFEC. The study employed nine SNGs and one city administration from 2005 to 2018; the sample size is 140 observations.
4. Results
The study aims to analyze fiscal federalism’s effects on regional public service provision.
4.1. Assessment of measurement model
The estimation purposes are to gauge the consistency and validity of the manifest variables. Single manifest and construct reliability examinations evaluate consistency, whereas convergent and discriminant validity measure the construct’s accuracy (Lowry & Gaskin, Citation2014, Garson, Citation2016, Hair et al., Citation2021). Additionally, individual manifest reliability estimates the standardized outer loadings of the manifest variables to explicate the variation of manifest respect to the latent variable (Henseler et al., Citation2014; Garson, Citation2016; Latan & Ghozali, Citation2013).
4.1.1. Inspecting indicators (items) reliability
Indicator reliability denotes the level of variation in an item explicated by the variable, and it is assessed using the outer loadings or outer weight contingent on the nature of the construct, i.e., reflective or formative (Lowry & Gaskin, Citation2014). The indicators with an outer loading value equal to or higher than 0.7 should be reserved. For the exploratory research, indicators showed that an outer loading value greater than 0.4 can be retained (Hair et al., Citation2021).
A general guideline is that a variable should account for a sizable portion of every item’s variance, commonly at least 50% (Garson, Citation2016). It also shows that the variance shared among the concept and the item it represents exceeds the measurement error variance. It implies that an indicator’s outer loading needs to be over 0.708 because 0.708 squared equals 0.50 (Lowry & Gaskin, Citation2014, Garson, Citation2016).
Table indicates that the reflective indicator, except for IGT share and rRGDP_c, has outer loading > 0.7(Also see Figure ). The study included them since the loading > 0.4 is acceptable for exploratory research. (See general guideline of measurement model assessment in Table ). However, there is no clear threshold for the outer weights of the formative construct; it is advisable to use the p-value, which is significant.
Table 1. Variables used in the Study
Figure 2. The outer model of the Study.
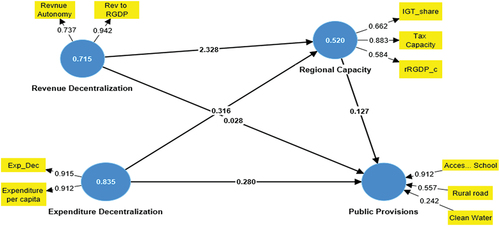
Table 2. General guideline for measurement model evaluation
As indicated in Table , the study results satisfied the discriminant validity requirement; therefore, the model established discriminant validity. Another tool to gauge this validity is the Heterotrait-Monotrait ratio (HTMT); the HTMT value should be 0.90 (Hair et al., Citation2014). For fundamentally different structures, the HTMT value should be 0.85. Table illustrates that, except for regional capacity (1.11), all the values of the constructs fulfill the rule; the HTMT result also confirmed that the model established discriminant validity (See general guideline of measurement model assessment in Table ).
Table 4. Diagnosis of constructs’ reliability and validity
Table 5. Diagnosis of discriminant validity
4.1.2. Examining reliability of the constructs
Cronbach alpha and composite reliability, which measure reliability grounded on how the observed item variables interact, are well-known procedures to detect internal consistency (Garson, Citation2016). The range of PLS-SEM values is 0 to 1, and a value greater than 0.7 denotes a higher degree of dependability. Composite reliability ratings over 0.60 are acceptable in exploratory research (Henseler et al., Citation2014, Garson, Citation2016). Internal consistency of the multi-item scale was scrutinized with Cronbach’s alpha, and the accuracy with which the construct was measured by its indicators was measured with composite reliability (Lowry & Gaskin, Citation2014).
Cronbach alpha investigated the uni-dimensionality of the multi-item scale’s internal consistency, and composite reliability evaluates how effectively the construct was measured by its indicators (Lowry & Gaskin, Citation2014). Garson (Citation2016) suggested composite reliability over Cronbach’s alpha, and all of the composite values of the construct (See Table ) are above 0.7 and indicate the model established internal consistency.
4.1.3. Examining discriminant validity
The Fornell-Larcker criterion is among the procedures to check the occurrence of discriminant validity (Lowry & Gaskin, Citation2014). At the indicator level, this validity denotes the magnitude of a given construct distinguishing itself from other constructs in the model. The inter-construct correlation values should be below the Average Variance Extracted (AVE) square root (Garson, Citation2016).
4.1.4. Convergent validity
Convergent validity is how items associate positively with alternate items of a similar variable (Hair et al., Citation2017, Hair et al., Citation2021). Therefore, AVE helps to assess this validity for reflective indicators. The AVE value needed to be equal to or greater than 0.50 (Henseler et al., Citation2014). Thus, as indicated in Table , the model fulfilled the convergent validity criteria (See general guideline of measurement model assessment in Table ).
4.2. Diagnosis of structural model
The structural model Starts with analyzing potential collinearity among predictor constructs in the model, coefficient of determination, effect size, and the significance of the path coefficients, respectively (Lowry & Gaskin, Citation2014). The model must first be free of the collinearity problem before checking additional requirements tests to accomplish the convergent validity for formative variables in the routes. To achieve this goal, the Variance Inflation Factor (VIF) must have a value equal to or less than 5 (Kock & Lynn, Citation2012).
Tables present the outer and inner values of VIF, respectively. These Tables showed that the model is free from the problem of collinearity; therefore, it established a convergent construct for the formative construct (see outer VIF in Table and inner VIF in Table ).
Table 6. General guideline for SEM (inner) model evaluation
Table 7. PLS predict relevance assessment
Table 8. Examining path coefficients
Table 3. Results of construct indicators
4.2.1. Endogeneity test
The GC method is utilized in research to identify and fix endogeneity problems in model estimation (Becker et al., Citation2021). The GC test verified that all routes are not statistically significant, indicating the model is free from endogeneity concerns (See Table in the Appendix).
4.2.2. Coefficient of determination (R2)
The R2 denotes the magnitude of variance in the dependent variable explicated by the independent variables; a model with R2 values of 0.67, 0.33, and 0.19 is significant, mediocre, and feeble, respectively (Garson, Citation2016). Each path from one construct to another construct means the link between independent variables and dependent variables; therefore, as presented in Table , R2 of the path connection between expenditure decentralization and public service provision is 0.764, and the path connection between revenue decentralization and public service provision is also 0.764. Besides, R2 of the path association between expenditure decentralization and capacity is 0.239, and the path link between revenue decentralization and capacity is also 0.239. Therefore, the average tR2 of independent variables on the predicted independent variable is ((0.764 + 0.764 + 0.239 + 0.239)/4) = 0.5015.
Consequently, the study model is more than moderate. Furthermore, it signifies the model has high forecasting accuracy (See general guideline of inner (path) model assessment in Table ).
4.2.3. Effect size
Effect size (f2) is a measure of whether a specified explanatory construct has a significant impact on the dependent constructs that is determined by the change in R2 value that results from its exclusion from the model (Henseler et al., Citation2014, Lowry & Gaskin, Citation2014). The formula for the f2 is: = (R2 included—R2 excluded)/(1- R2 included), whose values of 0.02, 0.15, and 0.35 represent feeble, mediocre, and significant effects, respectively (Chin, 1998). As presented in Table , All paths have f2 values exceeding a minimum threshold (0.02). Besides, except for the f2 of revenue decentralization on public service provision (i.e., 0.028), all other f2 values are above 0.15. Therefore, almost all paths have above medium effect size (See general guideline of inner (path) model assessment in Table ).
4.2.4. Evaluation of predictive relevance
The evaluation of PLS prediction helps to check the magnitude of the predictive relevance of the model (Shmueli et al., Citation2015, Shmueli et al., Citation2019). The predictive ability of their PLS path models for the observed items was determined through the mean absolute error (MAE) and the mean absolute percentage error (MAPE) (Shmueli et al., Citation2019). The disparities comparing PLS-SEM and LM need to be positive, an appraisal of the Q2 prediction ability across various PLS path models (Shmueli et al., Citation2015).
For all indicators of regional capacity and public service provision, the Q2 prediction values are above zero, and the RMSE and MAE values of the PLS-SEM predict lower than those of the linear model (LM) benchmark; therefore the model fulfills predictive relevance (See general inner (path) model assessment guideline in Table and Table ).
4.2.5. Significance of path coefficients
The evaluation of path coefficients shows the predictable change in the explained construct for a unit change in the explanatory constructs. Path analysis claimed to detect statistical significance, magnitude, and direction of path coefficients (Latan & Ghozali, Citation2013, Garson, Citation2016). The bootstrap sample enables the estimated coefficients in PLS-SEM to be tested for significance (Latan & Ghozali, Citation2013).
As presented in Table , except revenue, expenditure decentralization (Sig= 1% level; Beta Coff = 0.546) and regional capacity (Sig= 5% level; Beta Coff= 0.641) have a statistically significant positive contribution to public service provision. Except for hypothesis 1, the study supported hypotheses 2 and 5. In addition, revenue decentralization significantly positively affects regional capacity (Sig= 1% level; Beta Coff= 0.763). Therefore, hypothesis 3 is supported. Nevertheless, expenditure decentralization (Sig= 1% level; Beta Coff = −0.281) adversely influences regional capacity. Therefore, the investigation oppositely validated hypothesis 4.
The analysis mediations examine the third variable mediating role on the linkage between independent and dependent variables (Preacher & Hayes, Citation2008, Hayes & Scharkow, Citation2013, Lowry & Gaskin, Citation2014). As shown in Table , regional capacity (Sig = 10% level; Beta Coff = 0.489) significantly mediates the cause-effect link between revenue decentralization and public service provision. Therefore, it supported hypothesis 6. However, regional capacity (Sig = 10% level; Beta Coff = −0.180) significantly influences the cause-effect link between expenditure decentralization and public service provision. Therefore, the result oppositely validated hypothesis 7. In general, except for hypothesis 1, all other six hypotheses are significantly significant (hypotheses 2 to 7),
5. Discussion
Within the framework of ethnic federalism, Ethiopia has implemented a distinctive type of fiscal decentralization. The process is still ongoing, and the primary administrative division of the federal government still needs more financial decision-making authority. Within the increasing literature on fiscal federalism, a rigorous study of the influence of fiscal federalism on regional public service provision is an essential research subject. This study investigates the causational link between fiscal federalism variables, regional capacity, and public service provision.
The study findings agree with studies by Arends (Citation2017) who validated that expenditure decentralization significantly enhances public health services. However, it is consistent with Syamsul (Citation2003) and Sow and Razafimahefa (Citation2015), who revealed that expenditure decentralization significantly hampers public provisions. It also contradicts Silas (Citation2017), who corroborated that expenditure decentralization does not significantly contribute to health service outcomes.
On the other hand, the study supports Freinkman and Plekhanov (Citation2009), Silas (Citation2017), and Arends (Citation2017), who confirmed that revenue decentralization has no significant contribution to public service provision. In addition, the study finding is inconsistent with Lozano-Espitia and Martínez (Citation2013), who verified that revenue decentralization significantly positively affects public education service outcomes.
Since the federal government still centralizes the financial means of carrying out fiscal responsibilities, revenue decentralization still needs to achieve the desired results. Instead, it shows that financial decision-making has effectively been centralized. Additionally, it illustrates the regionals’ overwhelming reliance on federal grants to pay for even ongoing expenses within their domains. Furthermore, the study findings on regional capacity support the findings of Lozano-Espitia and Martínez (Citation2013), who revealed that regional GDP significantly improves school enrollment. Concerning the mediating effect, the study showed that regional capacity enhances the effect of revenue decentralization on public service provision. Fostering the SNG capacity may enhance revenue autonomy by increasing the financial base of the regions, and the regional government can use the revenue to provide public service. Nevertheless, SNG capacity played a hampering mediating role in the influence of expenditure decentralization on public service provision.
This finding opposed the proposed hypothesis and fiscal federalism theory; it may be because of the regional government budget’s weak links with the revenue side. The intergovernmental transfer covers the mismatch between the expenditure assignments and the SNG’s revenue. Therefore, it brings a weak incentive for the SNG to raise their revenue to cover their spending while providing public service, which harms regional capacity and its mediating function on the indirect influence of expenditure decentralization on public service provision.
6. Conclusion
The selection and distribution of budgetary decision-making authority among many government levels is termed fiscal federalism. It aims to boost public services’ variety, quality, and quantity. However, the experiences of reforming nations have been varied, making it challenging to comprehend and conclude. Therefore, the study aimed to analyze fiscal federalism’s direct and indirect effects on public service provision using panel data from 2005–2018; the study uses PLS-SEM.
The study’s findings indicated that expenditure decentralization significantly improved public service provision. Nevertheless, revenue decentralization has no significant contribution to public service provision. Unlike expenditure decentralization, revenue decentralization improves regional capacity. In light of revenue decentralization, the above discussions on the study results contradict the theoretical assumption of fiscal federalism. It claims that providing better public service at a low cost may increase the demand for local public service, which is vital in increasing local government revenue by the benefit rule principle.
To realize the nation’s objective to be one of the low-middle-income countries by 2025, Ethiopia’s Growth and Transformation Plan II (GTP II) (2016–2020) strives to maintain fast growth. The Plan emphasizes enhancing macroeconomic indicators, sectoral economic development plans (for example, manufacturing, mining, tourism, and agriculture and rural transformation), and infrastructure (for example, transportation, power, digital, and water supply). Despite the efforts made by the federal and SNGs, the country needed to improve its performance in achieving the national development plans (GTP II). It is due to Ethiopia’s fiscal federalism arrangement, which provides SNGs with limited revenue autonomy. Enhancing residents’ health education and infrastructure like the road is a priority because it is a means of attaining social welfare and sustainable development.
The study’s findings revealed that regional capacity positively affects public service provision and mediates the relation between revenue decentralization and public service provision. However, it harms the connection between expenditure decentralization and public service. Fiscal imbalances arise because the distribution of the tax base and the demand for public goods need to follow an even manner.
6.1. Policy implication
In Ethiopia, the ethnic-based federal arrangement and economic backdrop generated by it have needed more effectiveness in boosting public sector performance by broadening production and customizing it to population needs and economic priorities. The study findings would have implications for policymakers in that it offers an insight into fiscal federalism, public service provision, and areas for further improving the regional capacity. Policymakers would also use the findings to design strategic plans to increase the productivity of public service provision.
The fiscal system requires further decentralization of revenue sources commensurate with the regional governments’ expenditure responsibilities. Therefore, the federal government should support expenditure decentralization for public service provision because it contributes positively. Besides, the IGT arrangement should be redesigned to match the expenditure responsibilities and the revenue side and enhance the SNG capacity to generate adequate revenue to cover their spending.
6.2. Limitations and future research areas
Some strengths are examining the mediating role of SNG capacity and alleviating endogeneity concerns. The study, however, has a flaw because it has the following limitations: First, the constitution of Ethiopia authorizes only the national government to collect import and export taxes, making it tough to get solid figures. Therefore, the study was obliged to calculate RGDP, excluding the trade balance. The study left out Addis Ababa City since it often receives inter-governmental transfers. Furthermore, the study excludes the two recently established SNGs (SNG of Sidama and Southwestern).
One avenue for future research is to include spatial geography and examine how the regional government’s distance from a highly resource-concentrated location (capital city) to the peripheral region affects public service provision. Besides, the researcher/s can repeat the study at the federal, municipalities, Zonal (below regional states), and Woreda levels (below Zone). Finally, to answer the “egg and chicken” dilemma, further investigation is needed to examine whether institutional development should come first before introducing the decentralization program or vice versa.
Disclosure statement
The Authors reported no potential conflict of interest.
Additional information
Notes on contributors

Million Adafre Bushashe
Million Adafre Bushashe is a Lecturer at the Department of Management, Mizan-Tepi University, Ethiopia. He has BA in Management and a Master’s degree in Business Administration, and a Ph.D. Candidate in Public Policy and Management at Addis Ababa University. His research interest is in a broad area of fiscal federalism, economic development, economic stability, and social welfare.
Yitbarek Bayiley
Yitbarek Takele Bayiley is an associate professor at Addis Ababa University. He has a Master’s degree in Business administration, MSc in Economics, and Ph.D. in Management.
References
- Arends, H. (2017). More with less? Fiscal decentralization, public health spending, and health sector performance. Swiss Political Science Review, 23(2), 144–21. https://doi.org/10.1111/spsr.12242
- Bayu, T. B. (2022). Is federalism the source of ethnic identity-based conflict in Ethiopia? Insight on Africa, 14(1), 104–125. https://doi.org/10.1177/09750878211057125
- Becker, J., Proksch, D., & Ringle, C. M. (2021). Revisiting Gaussian copulas to handle endogenous regressors. Journal of the Academy of Marketing Science, 50(1), 46–66. https://doi.org/10.1007/s11747-021-00805-y
- Boadway, R., & Tremblay, J. (2012). Reassessment of the Tiebout model. Journal of Public Economics, Pp, 96(11–12), 1063–1078. https://doi.org/10.1016/j.jpubeco.2011.01.002
- Bojanic, A. N. (2018). The impact of fiscal decentralization on growth, inflation, and inequality in the Americas. CEPAL Review, 2018(124), 57–77. https://doi.org/10.18356/31c71be8-en
- Bojanic, A. N., & Collins, L. A. (2021). Differential effects of decentralization on income inequality: Evidence from developed and developing countries. Empirical Economics, 60(4), 1969–2004. https://doi.org/10.1007/s00181-019-01813-2
- Brennan, G., & Buchanan, J. (1980). Power to tax: Analytical foundations of a fiscal constitution. Cambridge University Press.
- Busemeyer, M. R. (2008). The impact of fiscal decentralization on education and other types of spending. Swiss Political Science Review, 14(3), 451–481. https://doi.org/10.1002/j.1662-6370.2008.tb00109.x
- Bushashe, M. A. (2023). Determinants of private banks performance in Ethiopia: A partial least square structural equation model analysis (PLS-SEM). Cogent Business & Management, 10(1). https://doi.org/10.1080/23311975.2023.2174246
- Bushashe, M. A., & Bayiley, Y. (2023a). The effect of fiscal decentralization on economic growth in sub-national governments of Ethiopia: A two-step system general methods of moments (GMM) approach. Public and Municipal Finance, 12(2), 32–42. https://doi.org/10.21511/pmf.12(2).2023.03
- Bushashe, M. A., & Bayiley, Y. (2023b). Fiscal decentralization and macroeconomics stability nexus: Evidence from the sub-national governments context of Ethiopia. Cogent Economics & Finance, 11(2). https://doi.org/10.1080/23322039.2023.2244353
- Canare, T., Francisco, J. P., & Caliso, R. A. (2020). Decentralization and income inequality in a panel and cross‐section of countries. Journal of International Development, 32(4), 543–579. https://doi.org/10.1002/jid.3468
- Cohen, J. (1988). Statistical power analysis for the behavioral sciences. Lawrence Erlbaum.
- Diaz-Serrano, L., & Rodríguez-Pose, A. (2012). Decentralization, subjective well-being, and the perception of institutions. Kyklos, 65(2), 179–193. https://doi.org/10.1111/j.1467-6435.2012.00533.x
- Ferrante, L. (2016). Decentralization and health performance in Italy: theoretical and empirical issues [ Doctoral Dissertation, University of Catania].
- Fiszbein, A. (1997, December). Decentralization and local capacity: Some thoughts on a controversial relationship. In paper presented at the FAO/UNCDF/World Bank Technical Consultation on Decentralization, Rome.
- Freinkman, L., & Plekhanov, A. (2009). Fiscal decentralization and the quality of public services in Russian regions. SSRN Electronic Journal. https://doi.org/10.2139/ssrn.1548324
- Garson, G. (2016). Partial least squares regression and structural equation models. Statistical Associates.
- Ghebrehiwet, T. (2015). The practice of fiscal federalism in Ethiopia: A critical assessment 1991-2012. An institutional approach [ Doctoral Dissertation, University of Fribourg]. https://doc.rero.ch
- Hair, J. F., Hult, G. T. M., Ringle, C. M., & Sarstedt, M. (2017). A primer on partial Least Squares Structural Equation Modeling (PLS-SEM). Sage.
- Hair, J. F., Hult, G. T., Ringle, C. M., Sarstedt, M., Danks, N. P., & Ray, S. (2021). Partial least squares structural equation modeling (PLS-SEM) using R. Classroom Companion: Business. https://doi.org/10.1007/978-3-030-80519-7
- Hair, J. F., Sarstedt, M., Hopkins, L., & Kuppelwieser, G. (2014). Partial least squares structural equation modeling (PLS-SEM). European Business Review, 26(2), 106–121. https://doi.org/10.1108/EBR-10-2013-0128
- Hayes, F., & Scharkow, M. (2013). The relative trustworthiness of inferential tests of the indirect effect in statistical mediation analysis. Psychological Science, 24(10), 1918–1927. https://doi.org/10.1177/0956797613480187
- Henseler, J., Ringle, C. M., & Sarstedt, M. (2014). A new criterion for assessing discriminant validity in variance-based structural equation modeling. Journal of the Academy of Marketing Science, 43(1), 115–135. https://doi.org/10.1007/s11747-014-0403-8
- Jin, H., Qian, Y., & Weingast, B. R. (2005). Regional decentralization and fiscal incentives: Federalism, Chinese style. Journal of Public Economics, 89(9–10), 1719–1742. https://doi.org/10.1016/j.jpubeco.2004.11.008
- Kis-Katos, K., & Sjahrir, B. S. (2017). The impact of fiscal and political decentralization on local public investment in Indonesia. Journal of Comparative Economics, 45(2), 344–365. https://doi.org/10.1016/j.jce.2017.03.003
- Kock, N., & Lynn, G. (2012). Lateral collinearity and misleading results in variance-based SEM: An illustration and recommendations. Journal of the Association for Information Systems, 13(7), 546–580. https://doi.org/10.17705/1jais.00302
- Latan, H., & Ghozali, I. (2013). Partial least squares: Concept and application path modelling using program XLSTAT-PLS. Badan Penerbit Universitas Diponegoro.
- Lee, J. (n.d.). The Process of decentralization in Ethiopia since 1991: Issues on improving efficiency. Korea Review of International Studies. https://gsis.korea.ac.kr/wp
- Lowry, P. B., & Gaskin, J. (2014). Partial Least Squares (PLS) Structural Equation Modeling (SEM) for building and testing causal behavioral theory: when to choose it and how to use it. IEEE Transactions on Professional Communication, 57(2), 123–146. https://doi.org/10.1109/tpc.2014.2312452
- Lozano-Espitia, L. I., & Martínez, M. A. (2013). Has fiscal decentralization improved the enrollment and quality levels of Colombia’s public primary education?. https://doi.org/10.32468/be.747
- Meheret, A. (2007). Rapid assessment of Woreda decentralization. In A. Taye & G. Tegegne (Eds.), Decentralization in Ethiopia. Forum for Social Studies.
- Moges, G. (2008). An economic analysis of fiscal federalism in Ethiopia. Northeast African Studies, 10(2), 111–140. https://doi.org/10.1353/nas.0.0005
- Morozov, B. (2015). Theory and practice of decentralization in developing countries: Evidence from the Republic of Moldova. http://irek.ase.MD
- Musgrave, R. (1959). The theory of public finance. McGraw-Hill.
- Musgrave, R. A., & Musgrave, P. B. (1989). Public finance in theory and practice (5th ed.). McGraw-Hill.
- Oates, W. E. (1972). Fiscal decentralization. Harcourt Brace Jovanovich, Inc.
- Oates, W. E. (2005). Toward a second-generation theory of fiscal federalism. International Tax and Public Finance, 12(4), 349–373. https://doi.org/10.1007/s10797-005-1619-9
- Paulos, C. (2007). What one hand gives, the other hand taketh. Shaker Publishing.
- Preacher, K. J., & Hayes, A. F. (2008). Asymptotic and resampling strategies for assessing and comparing indirect effects in multiple mediator models. Behavior Research Methods, 40(3), 879–891. https://doi.org/10.3758/brm.40.3.879
- Prud’homme, R. (1995). The dangers of decentralization. The World Bank Research Observer, 10(2), 201–220. https://doi.org/10.1093/wbro/10.2.201
- Ribot, J. (2002). African decentralization: Local actors, powers, and accountability. UNRISD Programme on Democracy, Governance and Human Rights (Paper No. 8). https://www.unrisd.org
- Robalino, D. A., Picazo, O. F., & Voetberg, A. (2001). Does fiscal decentralization improve health outcomes? Evidence from a cross-country analysis. Policy Research Working Papers. https://doi.org/10.1596/1813-9450-2565
- Rompuy, P. F. (2017). Sub-national fiscal autonomy, infrastructure investment, and regional disparities. SSRN Electronic Journal. https://doi.org/10.2139/ssrn.2989039
- Rondinelli, D. A. (1982). The dilemma of development administration: Complexity and uncertainty in control-oriented bureaucracies. World Politics, 35(1), 43–72. https://doi.org/10.2307/2010279
- Sarstedt, M., & Mooi, E. A. (2019). A concise guide to market research: The process, data, and methods using IBM SPSS statistics. Springer Berlin Heidelberg. https://doi.org/10.1007/978-3-662-56707-4
- Schneider, A. (2003). Who gets what from whom? The impact of decentralization on tax capacity and pro-poor spending IDS Working Paper, p. 179, IDS.
- Shmueli, G., Ray, S., Velasquez Estrada, J. M., & Chatla, S. (2015). The elephant in the room: Evaluating the predictive performance of partial least squares (PLS) path models. SSRN Electronic Journal. https://doi.org/10.2139/ssrn.2659233
- Shmueli, G., Sarstedt, M., Hair, J. F., Cheah, J., Ting, H., Vaithilingam, S., & Ringle, C. M. (2019). Predictive model assessment in PLS-SEM: Guidelines for using PLSpredict. European Journal of Marketing, 53(11), 2322–2347. https://doi.org/10.1108/ejm-02-2019-0189
- Silas, M. (2017). Effects of fiscal decentralization on poverty reduction outcome, income Inequality and human development in Kenya [ Doctoral Dissertation, University of Kenyatta]. https://ir-library.ku.ac.ke
- Sow, M., & Razafimahefa, I. (2015). Fiscal decentralization and the efficiency of public service delivery. IMF Working Papers, 15(59), 1. https://doi.org/10.5089/9781484351116.001
- Syamsul, T. M. (2003). Fiscal decentralization and economic development: A cross-country empirical study. Forum of International Development Studies, 8(24), 845–271. https://www.gsid.nagoya-u.ac.jp
- Tanzi, V. (1996). Fiscal federalism and decentralization. In M. Bruno & B. Pleskovic Eds., A review of some efficiency and macroeconomic aspects. Tanzi. 1996 (pp. 295–316). Annual World Bank Conference on Development Economics.
- Tiebout, C. M. (1956). A pure theory of local expenditures. Journal of Political Economy, 64(5), 416–424. https://doi.org/10.1086/257839
- Weingast, B. R. (2009). Second generation fiscal federalism: The implications of fiscal incentives. Journal of Urban Economics, 65(3), 279–293. https://doi.org/10.1016/j.jue.2008.12.005
- Zhuravskaya, E. V. (2000). Incentives to provide local public goods: Fiscal federalism, Russian style. Journal of Public Economics, 76(3), 337–368. https://doi.org/10.1016/s0047-2727(99)00090-0
Appendix
Table A1. Federal government budget in real Terms (in Billions)
Table A2. Examining the endogeneity of the model