
 ?Mathematical formulae have been encoded as MathML and are displayed in this HTML version using MathJax in order to improve their display. Uncheck the box to turn MathJax off. This feature requires Javascript. Click on a formula to zoom.
Abstract
The article studies the economic background and reasons for the protest actions of the population on the example of major riots in the regions of Kazakhstan in early 2022. The theory of relative deprivation explains the occurrence of unrest by the growth of social tension in groups of the population who are dissatisfied with living conditions. According to the authors, the causes of the unrest were economic factors. There are many studies on political, inter-ethnic, inter-religious, and other factors of protest actions, but not enough research on the economic factors of urban unrest. The study aims to identify the economic causes of the outbreak of violence in the country’s regions. The research methodology was based on comparative statistical analysis and building a probit model based on panel data. We have established that the growth of the subsistence minimum, the increase in the proportion of the population with incomes below the subsistence minimum, and, especially, the depth of poverty and the acuity of poverty are reasons for social tension, which, after the small trigger, turned into large-scale urban unrest. Moreover, neither income inequality nor rising unemployment was a significant factor in the protest actions. The results indicate the need for the authorities to monitor the socio-economic indicators of the regions and take measures to prevent their significant deterioration, especially the depth and acuity of poverty. A similar empirical approach can be applied to analyzing the economic causes of unrest in regions of other countries.
1. Introduction
Protests and demonstrations have been part of human history for centuries and have occurred in almost every country. People have come together to express their dissatisfaction, advocate for change and demand justice on various issues. Protests can take many forms, from peaceful marches and sit-ins to riots and violent clashes with law enforcement (Roberts, Citation2009).
Only in recent years in different countries have many protests turned into riots. For example, protests in Hong Kong (2019–2020) sparked by a proposal to introduce an extradition law; the Black Lives Matter (2020) protests in the US following the killing of a black man by police officers; the Arab Spring uprisings (2010–2012) caused by political oppression and lack of political freedom; Indian farmers’ protests (2020–2021) against new agricultural laws; yellow vest protests (2018–2019) caused by higher fuel taxes; protests in Sudan (2018–2019) caused by corruption and economic hardship (Global Protest Tracker, Citation2023).
Protests often have a specific trigger event or incident that catalyzes people to come together and demand change. However, the root causes of social and political unrest are often much deeper and more complex, rooted in long-standing grievances and systemic problems built up over the years and even decades. For example, the murder of George Floyd by police officers triggered the Black Lives Matter protests, and the real cause was years of racial injustice and police brutality against black people. Higher fuel taxes initially drove the Yellow Vest protests, but the real reasons for the grievances were economic inequality and social injustice.
Studying protests can provide valuable information about people’s problems and concerns about their government and society. Deep-seated grievances about inequality, injustice, and lack of access to basic needs and services often spark protests. Researching the root causes of protests and unrest can be a valuable tool for governments and societies to understand and address deeply rooted social problems. However, concrete action and policy changes must accompany it to be effective.
In early January 2022, protests broke out across Kazakhstan, triggered by a sharp increase in gas prices. The protests quickly turned into riots, with demonstrators storming government buildings and clashing with police. The unrest in Kazakhstan has highlighted long-standing problems, including corruption, a lack of political freedom, and economic inequality.
The article aims to identify the economic factors that caused the protest actions in Kazakhstan in 2022. Many economic reasons can stimulate protest movements around the world, including:
Income inequality. As the gap between rich and poor widens, people who feel left out or excluded from the benefits of economic growth may protest for a more equitable distribution of wealth. The January events of this year showed that income inequality in the regions and Kazakhstan as a whole had reached a peak. According to President K-Zh.K. Tokayev, 162 people, or 0.001% of the population, own 55% of the wealth of Kazakhstan. At the same time, 11711,334 people (96.6% of the total population) have less than $10,000 (Tengrinews, Citation2022).
Unemployment and job insecurity. High unemployment or precarious employment can lead to economic hardship and uncertainty for individuals and families, prompting them to demand better job opportunities and security.
Cost of living. Rising prices for necessities such as food, housing, health care, and education can place a significant financial strain on individuals and families, leading to protests in favor of affordable goods and services.
Poverty. When large segments of the population live in poverty and struggle to meet their basic needs, they may feel marginalized, excluded, and frustrated by the political and economic system. In such situations, protests and demonstrations can be a way for people to voice their dissatisfaction and demand change.
To achieve the study’s goal, we formulated and tested four hypotheses using a binary choice panel data model—panel probit model. The rest of the paper is organized as follows. The second section presents a literature review examining the background and causes of protests worldwide. The third section describes the methodology and data used for the analysis. The fourth section contains the results of statistical analysis and calculations based on the probit model. The fifth section presents a discussion and interpretation of the results, and the last section presents the study’s conclusions.
2. Literature review
Social tension, discontent, and mass protests occurred in almost all countries. In this regard, this problem has received comprehensive coverage in the scientific literature. Authors from all over the world have studied the background, causes, and consequences of such phenomena. The topic of protests and riots is relevant as they quickly develop into mass robberies, vandalism, and an outbreak of violence, denoting elements of the crime. Moreover, they lead to insecurity, such as worsening poverty, lack of food and fuel, death of people, rising unemployment, etc (Mongale, Citation2022).
As we know, intolerance breeds inequality, and inequality breeds intolerance. Research into the causes of social unrest usually focuses on structural factors or diffusion. The authors cite income inequality, the existence of huge privileges of some over others (Aidt & Leon-Ablan, Citation2022; Zuniga-Jara, Citation2022), social inequality (Bristow, Citation2013; Till, Citation2013), and inequality within and between ethnoreligious groups (Bulutgil & Prasad, Citation2022; Haight, Citation2013), racial inequality (Brazil, Citation2016; Rhodes, Citation2009).
The expression “urban protests” is also often found in studies. A large and rapidly growing urban population can increase competition for scarce urban resources, which fuels discontent expressed in protests (Castells-Quintana et al., Citation2022; Gizelis et al., Citation2021; Goldstone, Citation2010; Urdal & Hoelscher, Citation2012).
Despite strong theoretical expectations associated with the destabilizing effect of population growth, empirical evidence remains mixed. Nationwide, Fox and Bell (Citation2016) finds a negative and negligible association between urban growth and protests. This could depend on the scale used to measure the variable. However, the findings of numerous subnational studies have not consistently demonstrated a connection between population growth and protest activity (Dorward & Fox, Citation2022). Bahgat et al. (Citation2018) find no evidence for an association between urban population growth rates and social unrest. These results reflect that rural-urban migration, the most likely cause of social tensions, plays an increasingly limited role in urban population growth (Fox, Citation2017; Menashe-Oren & Bocquier, Citation2021). On the other hand, Ostby (Citation2016) discovers a positive correlation between urban unrest and the level of relative deprivation felt by rural-to-urban migration.
A recent study found that urban population growth driven by extreme flood displacement was associated with a higher likelihood of urban social unrest (Castells-Quintana et al., Citation2022). The authors distinguish between push factors (when adverse conditions elsewhere force people to move to urban areas) and pull factors (when migrants are attracted to urban areas by rich opportunities) that stimulate migration from rural areas to cities. Their results show that involuntary resettlement leads to social unrest in cities.
Among the causes of protests and riots, the authors also often include the process of globalization. Specifically, the existence of globalization losers, particularly in the lower middle class; increased competition from migrants for jobs and social benefits; the psychological readiness of some middle-class losers to attribute the worsening of their socioeconomic situation to the global “conspiracy of the elites”; erosion of the traditional industrial society structure and, as a result, degradation of the current political system (Sergeyev et al., Citation2018).
The nature of a country’s political regime also determines the opportunities, resources, and motives for protest mobilization (Chenoweth & Stephan, Citation2011; Dalton et al., Citation2010; Tilly & Tarrow, Citation2015). Countries closer to democratic and autocratic ideals are less likely to protest than more hybrid countries. More democratic countries with competitive leadership and free speech are dampening the grievances at the heart of the protests. Moreover, in countries with more authoritarian regimes, there are fewer protests, as they limit the opportunities for protest with censorship, restrictions on freedoms, and police/military surveillance, and more often than democracies, suppress protests forcibly.
Another essential prerequisite for the population’s discontent and protests is the country’s food security. However, these concerns vary both within and between countries. Sanchez and Namhata (Citation2019) found a negative relationship between increased cereal production and protests; high volatility in domestic food prices increases the likelihood of protests.
Protests fuel tensions between the police and the public due to a lack of public confidence and support for the police and increased political dissent. Some authors argue that excessive police violence provokes a political backlash, reducing overall support for the security apparatus and increasing the willingness of some populations to engage in public dissent (Curtice & Behlendorf, Citation2021; King, Citation2013).
Research indicates that riots are more likely to attract people living in poorer and marginalized residential areas (Kawalerowicz & Biggs, Citation2015; Lightowlers, Citation2015). Other authors argue that individuals and groups, with little chance of influencing political programs and decisions through more traditional political action, stage mass protests (Akram, Citation2014; Wacquant, Citation2008). A study by Nikitina et al. (Citation2022) postulate that participation in protest actions for modern youth manifests ideological sympathies and the need to belong to a social group. However, protest behavior is associated with the lack of institutionalized channels of influence on decision-making, with an opinion about a high level of corruption and disagreement with ongoing political processes.
Observations of researchers and surveys of participants in protest movements (Holdo & Bengtsson, Citation2020; Muñoz & Anduiza, Citation2019) have also shown that available local incentives correlated with individual motives lead to participation in riots only when the event that makes riots justified destabilizes fragile local equilibrium. Social movements often face tactical diversification, in which protesters fall into two groups: core supporters who justify and support violent action; and those who reduce their support for the protest after the onset of street violence, pogroms, and riots.
When studying protests, their causes and consequences, the authors often used econometric methods, such as regression analysis of panel data, including methods of instrumental variables, the difference-of-differences method, time series analysis, and non-linear panel analysis (Bezzola et al., Citation2022; Dosso, Citation2023; Hierro et al., Citation2017; Hillesund, Citation2023; Scapini et al., Citation2021; Walls & During, Citation2020; Watanabe et al., Citation2020). However, among the existing studies, we did not find studies that examine the causes of protests using binary choice models.
3. Data and methodology
According to the administrative-territorial division of 2021 in Kazakhstan, there were 17 regions, including 14 regions and three large cities of Republican significance. To characterize the socio-economic condition of these regions, we used the following indicators:
Gini10, Gini20 – Gini coefficients for decile and quintile groups, respectively;
CF – coefficient of funds, the ratio of 10 percent of the most and 10 percent of the poorest population;
Cons – income used for consumption, on average per capita per month, tenge;
SL – subsistence level, equal to the cost of the minimum consumer basket, in tenge;
ConsSL – the purchasing power of income, the ratio of income used for consumption to the subsistence level, in percent;
BelSL – the share of the population with incomes used for consumption below the subsistence level, in percent;
Depth – coefficient of the depth of poverty, the average deviation of the income level of people who are below the subsistence minimum from the subsistence level;
Acuity – coefficient of the acuity of poverty, the average of the squared deviations of the share of income deficits of the members of the surveyed households from the established criterion;
Unemp is the unemployment rate in percent.
All annual data on these indicators by region from 2017 to 2021 were obtained from the website of the Bureau of National Statistics of the Agency for Strategic Planning and Reforms of the Republic of Kazakhstan (KazStat, Citation2023). The selected variables are closely related to each other; therefore, in order to avoid specification errors, they were not considered within the framework of one model. Table contains descriptive statistics for the indicated indicators for five years.
Table 1. Descriptive statistics for annual data for 2017–2021
Protests and riots in January 2022 took place in many cities of the regions of Kazakhstan: Zhanaozen (Mangistau region), Almaty city, Taldykorgan (Almaty region), Shymkent (Turkestan region), Astana city, as well as in the administrative centers of the regions of Atyrau, Aktobe, Pavlodar, East Kazakhstan. The seizure and arson of government buildings, looting, and killings of both law enforcement officials and civilians accompanied the protest activity.
The prerequisites for the unrest could be increased income inequality, a decrease in real incomes of the population due to a decrease in their purchasing power, an increase in the proportion of the population with incomes below the subsistence level, an increase in poverty, and an increase in the unemployment rate. In Kazakhstan, in January 2022, the trigger for protest actions of the population, which then spread to other regions of the country and turned into riots, was a sharp increase in the price of gas for refueling cars in the city of Zhanaozen, Mangystau region.
Economic deprivation can create protest moods among the least well-to-do part of society. One reason may be income inequality (Aidt & Leon-Ablan, Citation2022; Zuniga-Jara, Citation2022).
Hypothesis H1.
Income inequality was the main reason for the protest actions and riots of the population in Kazakhstan in January 2022.
The primary source of income for most adults is wages. Without a permanent, a permanent well-paid job, people experience want and deprivation. With a large migration from rural areas to cities, the opportunities to provide jobs for young migrants are limited. Rising unemployment increases the risk of urban protests (Castells-Quintana et al., Citation2022; Gizelis et al., Citation2021; Goldstone, Citation2010; Urdal & Hoelscher, Citation2012).
Hypothesis H2.
Rising unemployment was the main driver of urban protests and unrest in the regions of Kazakhstan in 2022.
Rising prices, outpacing the growth of cash income, reduce the real income of households and are reflected in the growth of the subsistence level, aggravating the situation of the poorest segments of the population. Mainly, rising food prices affect protest moods (Sanchez & Namhata, Citation2019). As a result, the level of poverty is rising. Kazakhstan’s poverty line is at 70 percent of the subsistence level. This concept is conditional and depends on the government’s financial ability to support low-income people. Therefore, to isolate the part of the population with low incomes, we further use the indicator of the share of the population with incomes below the subsistence level.
Hypothesis H3.
The rising subsistence level, a decline in the purchasing power of incomes, and an increase in the share of the population with incomes below the subsistence level were the main factors behind street protests and riots in Kazakhstan’s cities in 2022.
However, the decrease in real income affects different segments of the population differently. Households with relatively high real incomes are more likely to cope with the difficulties that have arisen than those with low real incomes. The composition of the part of the population with incomes below the subsistence level is heterogeneous. There is a so-called inequality among people experiencing poverty. In particular, rural migrants in big cities experience deprivation due to difficulties in finding employment and housing (Ostby, Citation2016). They include many young people who often settle in marginalized residential areas and can quickly become involved in street riots (Kawalerowicz & Biggs, Citation2015; Lightowlers, Citation2015). People in extreme poverty are more likely to join protest actions, blaming the authorities for everything, than those who can more easily survive temporary hardships.
Hypothesis H4.
The increase in the depth and acuity of poverty was the leading cause of street protests and riots in the regions of Kazakhstan in 2022.
To test the formulated hypotheses and identify the main economic factors that could contribute to the emergence of protest moods in the country’s regions, an empirical study should be carried out based on the data collected by the regions of the country for the period from 2017 to 2021. Methods of statistical and econometric analysis are the basis for this study.
It is suitable to use a binary choice panel data model—a panel probit model—to quantify the influence of economic factors on the likelihood of protest actions leading to urban unrest. We used Gini10, CF, Unemp, SL, BelSL, Depth, and Acuity data to estimate model parameters as independent variables from 2017 to 2021 (KazStat, Citation2023). In this model for 2022, the dependent variable Unrest is equal to 1 for regions where protests and riots were brewing and, in January 2022, took on an enormous scale: in the cities of Mangystau, Turkestan, Akmola, and Almaty regions, including in the cities of Almaty, Shymkent, and Astana. For other regions and in other years for all regions, the Unrest variable is equal to 0. The components of vector are the values of independent variables with a lag of 1 and a constant, i.e.
The independent variables were used with a lag to eliminate the simultaneity problem. The existence of a latent quantitative variable is assumed to be related to the independent variables
and unobservable characteristics
by a linear additive relation
where β is the vector of coefficients, the unobserved quantity has a standard normal distribution. The latent variable determines the value that the dependent variable will take:
if
if
In this case, the probability that the dependent variable will take the value 1 is
Here F(∙) is the standard normal distribution function (Verbeek, Citation2004). If the estimated coefficient for the independent variable is significant and positive, then the growth of this variable increases the probability that the dependent variable will take on the value 1; in other words, it increases the probability of protest actions in the corresponding region. The probit model makes it possible to identify those socio-economic indicators that influenced the emergence of unrest in the country’s regions. Calculations are based on the use of the STATA software.
4. Results
The economic prerequisites for unrest in a relatively prosperous country such as Kazakhstan could not arise overnight but accumulated and matured over a long period.
4.1. Socio-economic situation in 2021
Unrest in the regions of Kazakhstan occurred at the beginning of 2022. Therefore, let us pay attention to the values of socio-economic indicators in the previous year, 2021. In Table , in bold type are the maximum or minimum values of indicators for all regions of the country. Note that in this table, the decile and quintile Gini coefficients Gini10 and Gini20, respectively, show that the highest level of income inequality was in the city of Almaty. The coefficient of funds CF, equal to the ratio of incomes of 10 percent of the most and 10 percent of the poorest population, showed the highest value also in the city of Almaty.
Table 2. Socio-economic indicators of the regions of Kazakhstan in 2021
The subsistence level SL was the highest in the Mangystau region. However, the purchasing power of income ConsSL, defined as the ratio of income used for consumption to the subsistence level, was the lowest in the Mangystau region. The proportion of the BelSL population with incomes used for consumption below the subsistence level was the largest in the Turkestan region.
Extreme forms of poverty, depth of poverty Depth, and acuity of poverty Acuity had the highest values in all regions in the Mangystau region. The highest unemployment rate in Unemp was in the city of Almaty.
Based on these observations, we can conclude that in 2021 the most unfavorable socio-economic situation developed in the city of Almaty, Mangystau, and Turkestan regions. Meanwhile, in some other regions, for which the values of the indicators in Table are close to their maximum or minimum values, the situation was also unfavorable. For example, the values of the Gini index of 0.319 in the East Kazakhstan region and 0.312 in the Pavlodar region are close to its maximum value of 0.321 in the city of Almaty.
4.2. Unemployment rate and purchasing power of income
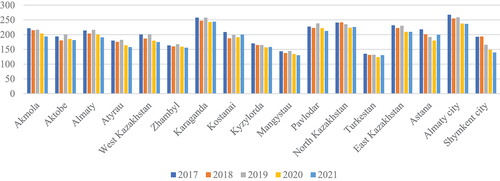
Sufficiently high employment and low inflation are important stabilizing factors in every country. Figure shows unemployment rates by regions of Kazakhstan in 2017 and 2021. Comparing them, one can see that the unemployment rate in all regions has decreased or remained at the same level, except for the regions of Akmola and Kyzylorda. However, in the city of Almaty, the Turkestan region, and the city of Shymkent in 2021, it still markedly exceeded the average unemployment rate in the country.
The real incomes of the population per capita in the country have been growing over the past five years; however, this growth has been different across regions. In the country as a whole, it rose to 123.5 percent of the 2016 level. In the Mangystau region in 2021, it decreased over this period to a level of 98.2 percent.
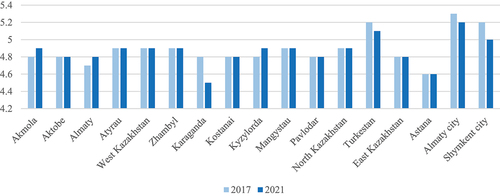
The indicator “Purchasing power of income” is estimated as the ratio of income used for consumption to the subsistence level. It reflects the availability of food and other goods, especially for people experiencing poverty. Figure shows that its lowest values were in the Turkestan and Mangystau regions. Moreover, the purchasing power has decreased in all regions. In 2021, compared to 2017, it decreased by 19.1 percent in the country and 30.7 percent in the city of Almaty. In the Mangystau region, where the value of the purchasing power of income was the lowest, it decreased by 13.4 percent.
4.3. Income inequality
A significant gap in the incomes of citizens can have a significant impact on social tension in society. In most regions, the Gini index for decile groups in 2021 increased compared to 2017. Its highest values were in the city of Almaty, East Kazakhstan, Pavlodar, and Karaganda regions. However, note that for the Mangystau and Turkestan regions, in which the most extensive protest actions took place, the Gini index has the lowest values in all regions.
The situation is approximately the same regarding the coefficient of funds, defined as the ratio of 10 percent of the richest and 10 percent of the poorest population. Moreover, this indicator has the highest value in Almaty city—the largest city in Kazakhstan.
4.4. Poverty indicators
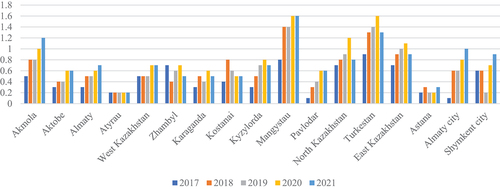
The indicator “The share of the population with incomes used for consumption below the subsistence level” clearly distinguishes Turkestan and Mangystau regions (Figure ). Compared to 2017, it increased in 2021 in all regions. Kazakhstan has set the poverty line at 70 percent of the subsistence level.
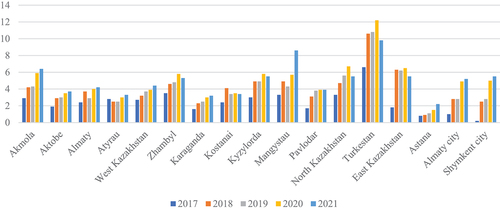
The factors of protests and riots may not be poverty itself but its extreme forms, measured by the indicators “Depth of poverty” and “Acuity of poverty.” In Figure , the Mangystau and Turkestan regions show the greatest depth of poverty. The most favorable situation for this indicator is in the Atyrau region and the city of Astana.
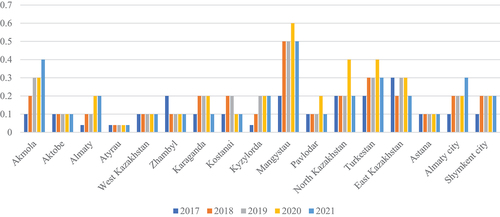
The “Acuity of poverty” indicator captures inequality among poor people (Figure ). The Mangystau region stands out on it. The city of Zhanaozen locates in the Mangystau region, and protests by the population began there on 2 January 2022. In the following days, they continued in other regions of Kazakhstan and escalated into violent riots.
Thus, the data on the socio-economic indicators of the regions of Kazakhstan from 2017 to 2021, presented in Figures , show that their extreme values were achieved in the Mangystau and Turkestan regions, the city of Almaty, as well as for individual indicators in the Akmola, East Kazakhstan, Pavlodar, and Karaganda regions. The most significant unrest occurred in Almaty city, Mangystau, and Turkestan regions. Conclusions on the histograms of indicators of income inequality, the purchasing power of income, unemployment, the share of the population with incomes used for consumption below the subsistence level, and the depth and acuity of poverty do not contradict the H1-H4 hypotheses. To answer the question of which of these indicators were the main factors in the unrest in Kazakhstan in January 2022, it is necessary to perform a quantitative analysis of the data.
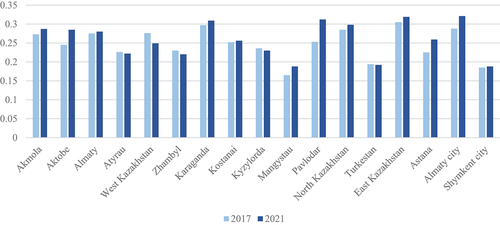
Figure 4. The share of the population with incomes used for consumption below the subsistence level, %.
4.5. Probit model
Table presents the results of calculations for the probit model. Of all possible specifications, the table includes only a part containing estimated coefficients that are significant at the 5 percent level. Specifications 1 and 2 show that the Gini income inequality index Gini10 and the coefficient of funds CF had no significant effect on the likelihood of disorder. The same result occurs when evaluating regressions with only one independent variable, Gini10, Gini20, or CF. Hence, income inequality was not the main reason for the protest actions and riots of the population in the cities of Kazakhstan in January 2022, and it rejects the H1 hypothesis.
Table 3. Probit-model, dependent variable unrest
None of the specifications is the estimated coefficient on the unemployment variable Unemp significant at even the 5 percent level. Therefore, the H2 hypothesis that unemployment was a significant factor in the unrest in the regions of Kazakhstan in 2022 is rejected.
The increase in the subsistence level SL reflects the rise in prices for consumer goods and the decline in real incomes of the population. Specification coefficients 3 and 5 show the positive impact of the growth of the SL indicator on the probability of protest actions. An increase in the BelSL indicator—the share of the population with incomes below the subsistence level—according to the estimated coefficients of specifications 3 and 6 also contributes to an increase in the likelihood of protests and riots. Thus, the indicators Cons – income used for consumption and ConsSL—the purchasing power of income did not significantly impact it. Consequently, the increase in the cost of living and the proportion of the population with incomes below the subsistence level were the main factors in street protests and riots in Kazakhstan in 2022. Hypothesis H3 is confirmed for the subsistence level SL and the share of the population with incomes below the subsistence level BelSL, but not for the purchasing power of ConsSL.
In specifications 1, 4, and 7, the estimated coefficients show the positive effect of Depth on the occurrence of unrest. In specifications 2 and 8, the estimated coefficients also suggest that the acuity of poverty Acuity contributed to the unrest. These results support the H4 hypothesis that depth of poverty Depth and acuity of poverty Acuity were significant drivers of unrest in the regions of Kazakhstan in 2022.
5. Discussion
In studies on this topic, the authors point to various causes of urban unrest: income inequality, ethnic and religious contradictions, the influx of migrants into cities, police violence, the tendency of a specific category of young people to commit illegal acts, disagreement with the political processes in the country, and others. The composition of the protesters is heterogeneous. Some of them start to protest actions and go to demonstrations with their demands to the authorities. Moreover, others join the protests when they have already begun. Moreover, the latter are responsible for riots, acts of vandalism, robbery, and arson of buildings. Political extremists can use protests to seize power.
There are no significant racial and interethnic conflicts in Kazakhstan. There are also no significant mass conflicts between migrants from rural areas and the urban population. However, urban poor people, including migrants from rural areas, experience relative deprivation, as they usually do not have the professions and qualifications required by the city. They usually do not have well-paid jobs and good living conditions. This creates conditions for their marginalization and incentives to easily join protest actions and riots.
For our study, we were interested in the reasons that forced people to take to the streets with protest demands against the authorities. Such actions can escalate into major urban riots. Why did big riots take occur in some regions of Kazakhstan while there were no significant protest actions in others? The preconditions for unrest are primarily economic factors. In a relatively prosperous country, wealthy people will be unlikely to participate in street protests and urban riots. Many researchers point to income inequality as the possible cause of social unrest, due to which some have great privileges while others experience deprivation (Aidt & Leon-Ablan, Citation2022; Zuniga-Jara, Citation2022). However, Jo and Choi (Citation2019) conducted a study across 45 countries and found no relationship between the Gini coefficient and the population’s protest participation. Another study by Grusky and Wimer (Citation2010) also found no impact of income inequality for street protests using a questionnaire method. Our study’s empirical analysis of data on the Gini index and the coefficient of funds using a regression probit model did not reveal a significant effect of income inequality on the emergence of protest actions and their transition to major riots (Table ). Indeed, as can be seen in Figure , the Gini index reached the highest levels in the city of Almaty, East Kazakhstan, Pavlodar, and Karaganda regions. Nevertheless, only in the city of Almaty were there significant protest actions. In contrast, the Gini index had the lowest values in the Mangystau and Turkestan regions and the city of Shymkent, where there were extensive riots. Hence, there is no reason to believe income inequality could cause social tension.
However, the protest movements began precisely in the Mangystau region, the main oil-producing region of Kazakhstan. Sakal (Citation2015), based on an analysis of the distribution of Kazakhstan’s oil wealth in the light of global initiatives, as well as official reports and statistics, proved that Kazakhstan’s natural resource policy has failed to improve the standard of living of the majority of people in Kazakhstan, especially people experiencing poverty and those who live in oil-producing and rural areas, despite rising oil prices and incomes. Heim and Salimov (Citation2020) have explored the impact of oil revenues on the economy of Kazakhstan with a focus on social development. Sanghera and Satybaldieva (Citation2021) also have explored the region’s income and wealth inequality.
For most people, having a steady job provides a regular income that prevents them from falling into the poor category. One can assume that unemployment is one of the significant reasons for the protest actions. Gizelis et al. (Citation2021), Castells-Quintana et al. (Citation2022), and others reached this conclusion. However, calculations using the probit model did not reveal a significant impact of unemployment on the likelihood of unrest in the regions of Kazakhstan. Indeed, among the country’s regions, it was highest in Almaty city and the Turkestan region, including its administrative center Shymkent (Figure ). However, unemployment levels were not high in other protesting Mangystau and Almaty regions.
Nevertheless, in Table , the coefficient at the Unemp variable is insignificant. Consequently, unemployment was not the cause of unrest in Kazakhstan’s regions since the unemployment rate in Kazakhstan was lower than in the countries studied in the above articles. The explanation can be like this. Rising unemployment affects the entire population and, more likely, to a lesser extent, the poorest population, for whom employment is already weak. More affluent households are less prone to protest actions since they have reserves with which they can more easily survive a temporary job loss.
The fall in real incomes due to rising prices for consumer goods and services leads to an increase in the subsistence level. Probit model calculations show that its growth significantly increased the likelihood of unrest in the country’s regions. At the same time, the purchasing power of income, calculated relative to the subsistence level, seemed to be a factor in the unrest (Sanchez & Namhata, Citation2019). Nevertheless, it is not. The association of purchasing power with unrest is ambiguous, being lowest in Turkestan and Mangystau regions but highest in Almaty city (Figure ). The growth of the subsistence level without a corresponding increase in real incomes leads to an increasing population share below its level. Moreover, this figure turned out to be a significant factor in the unrest in the regions of Kazakhstan. The deepening of poverty is associated with less food availability. Based on data from food riots in 14 African countries, Berazneva et al. (Citation2013) argue that worsening poverty increases the likelihood of unrest. The sharp increase in food prices significantly impacts people experiencing poverty, thus setting the stage for street protests (Bush, Citation2010). Although there is another observation, Vasquez (Citation2017) describes the situation in Peru as a paradox, where from 2000–2015, there was a high growth rate, a decrease in poverty rates, and at the same time, there was an increase in social unrest. Probably, along with the increase in the income of people in Peru, there were other reasons for the protest moods of the population.
However, the fact that the real incomes are below the subsistence level influences people’s dissatisfaction. Moreover, to an even greater extent, their dissatisfaction with their living conditions is influenced by the extent to which their real incomes turned out to be below the subsistence level. These people are in dire need and ready to go to street protests with demands on the authorities. Econometric calculations on the probit model confirmed that the depth of poverty and the acuity of poverty were significant factors in increasing the likelihood of past protests and riots.
6. Conclusion
This article examines the economic background that, after a minor cause, led to sizeable urban unrest in the regions of Kazakhstan in January 2022. Violence, pogroms, robberies, murders, seizure of government buildings, and arson accompanied them. They were unexpected in a relatively prosperous country. However, we argue that there were objective economic reasons for the unrest, which gradually accumulated, but the authorities did not pay attention to them promptly and did not respond appropriately.
As a result of the statistical and econometric analysis, we found that due to the decline in real incomes of the population, the main prerequisites and causes of unrest in some areas of Kazakhstan in 2022 were the growth of the subsistence level, which increased the share of the population with incomes below the subsistence level, and especially the increase in the depth and acuity of poverty. We argue that economic factors underlie the maturation of protest moods among the poorest segments of the population. Then a small trigger is enough for these protest moods to turn into significant riots. The results indicate the need to monitor the socio-economic indicators of the regions and take measures to prevent their significant deterioration, in particular, the depth and acuity of poverty. It is necessary to develop a system for collecting and analyzing data on the socio-economic situation of the regions, which will allow us to identify problem areas and trends and evaluate the effectiveness of the measures taken. The development of early warning mechanisms and monitoring systems will make it possible to quickly identify regions with unfavorable socio-economic situations and take measures to neutralize them. In this case, social programs, and policies to reduce poverty, combat inequality, create jobs, and increase the availability of essential services (education, health care, housing, etc.) can improve the socio-economic situation. At the same time, supporting entrepreneurship and attracting investment to the regions will help stimulate economic growth, create new jobs, and improve the population’s living standards. A similar empirical approach is suitable for analyzing the economic causes of unrest in regions of other countries.
Acknowledgments
This research was funded by the Science Committee of the Ministry of Science and Higher Education of the Republic of Kazakhstan (Grant No. AP13268961).
Disclosure statement
No potential conflict of interest was reported by the authors.
Additional information
Funding
References
- Aidt, T., & Leon-Ablan, G. (2022). The interaction of structural factors and diffusion in social unrest: Evidence from the swing riots. British Journal of Political Science, 52(2), 869–17. https://doi.org/10.1017/S0007123420000873
- Akram, S. (2014). Recognizing the 2011 United Kingdom riots as political protest: A theoretical framework based on agency, habitus, and the preconscious. British Journal of Criminology, 54(3), 375–392. https://doi.org/10.1093/bjc/azu013
- Bahgat, K., Buhaug, H., & Urdal, H. (2018). PRIO PAPER-Urban social disorder: An update urban social disorder: An update. Peace Research Institute Oslo.
- Berazneva, J., Lee, D. R., & Charles, H. (2013). Explaining the African food riots of 2007-2008: An empirical analysis. Food Policy, 39, 28–39. https://doi.org/10.1016/j.foodpol.2012.12.007
- Bezzola, S., Günther, I., Brugger, F., & Lefoll, E. (2022). CSR and local conflicts in African mining communities. World Development, 158, 105968. https://doi.org/10.1016/j.worlddev.2022.105968
- Brazil, N. (2016). Large-scale urban riots and residential segregation: A case study of the 1960s U.S. Riots. Demography, 53(2), 567–595. https://doi.org/10.1007/s13524-016-0459-9
- Bristow, J. (2013). Reporting the riots: Parenting culture and the problem of Authority in media analysis of August 2011. Sociological Research Online, 18(4), 100–110. https://doi.org/10.5153/sro.3147
- Bulutgil, H. Z., & Prasad, N. (2022). Inequality, elections, and communal riots in India. Journal of Peace Research, 60(4), 619–633. https://doi.org/10.1177/00223433221091307
- Bush, R. (2010). Food riots: Poverty, power, and protest. Journal of Agrarian Change, 10(1), 119–129. https://doi.org/10.1111/j.1471-0366.2009.00253.x
- Castells-Quintana, D., Del Pilar Lopez-Uribe, M., & McDermott, T. K. (2022). Population displacement and urban conflict: Global evidence from more than 3300 flood events. Journal of Development Economics, 158, 102922. https://doi.org/10.1016/j.jdeveco.2022.102922
- Chenoweth, E., & Stephan, M. (2011). Why civil resistance works: The strategic logic of nonviolent conflict. Columbia University Press.
- Curtice, T. B., & Behlendorf, B. (2021). Street-level repression: Protest, policing, and dissent in Uganda. Journal of Conflict Resolution, 65(1), 166–194. https://doi.org/10.1177/0022002720939304
- Dalton, R., Van Sickle, A., & Weldon, S. (2010). The individual–institutional nexus of protest behavior. British Journal of Political Science, 40(1), 51–73. https://doi.org/10.1017/S000712340999038X
- Dorward, N., & Fox, S. (2022). Population pressure, political institutions, and protests: A multilevel analysis of protest events in African cities. Political Geography, 99, 102762. https://doi.org/10.1016/j.polgeo.2022.102762
- Dosso, D. (2023). Institutional quality and financial Development in resource-rich countries: A nonlinear panel data approach. International Economics, 174, 113–137. https://doi.org/10.1016/j.inteco.2023.03.005
- Fox, S. (2017). Mortality, migration, and rural transformation in sub-saharan Africa’s urban transition. Journal of Demographic Economics, 83(1), 13–30. https://doi.org/10.1017/dem.2016.29
- Fox, S., & Bell, A. (2016). Urban geography and protest mobilization in Africa. Political Geography, 53, 54–64. https://doi.org/10.1016/j.polgeo.2016.02.004
- Gizelis, T., Pickering, S., & Urdal, H. (2021). Conflict on the urban fringe: Urbanization, environmental stress, and urban unrest in Africa. Political Geography, 86, 102357. https://doi.org/10.1016/j.polgeo.2021.102357
- Global Protest Tracker. 2023. Carnegie Endowment for International Peace. https://carnegieendowment.org/publications/interactive/protest-tracker
- Goldstone, J. A. (2010). The new population bomb: The four megatrends that will change the world. Foreign Affairs, 89(1), 31–43. https://www.foreignaffairs.com/articles/2010-01-01/new-population-bomb
- Grusky, D. B., & Wimer, C. (2010). Is there too much inequality? The inequality puzzle. Springer. https://doi.org/10.1007/978-3-642-15804-9_1
- Haight, A. D. (2013). The intolerance multiplier: A diagram. Review of Radical Political Economics, 45(4), 525–532. https://doi.org/10.1177/0486613412475193
- Heim, I., & Salimov, K. (2020). The effects of oil revenues on Kazakhstan’s economy. In I. Heim (Ed.), Kazakhstan’s diversification from the natural resources sector (pp. 55–81). Euro-Asian Studies. Palgrave Macmillan. https://doi.org/10.1007/978-3-030-37389-4_3
- Hierro, L. Á., Atienza, P., & Gómez-Álvarez, R. (2017). Asymmetrical treatment and revenue from regional protest. Revista De Economia Aplicada, 25(75), 109–131. https://doi.org/10.32466/eufv-xg.2017.0.268.109-127
- Hillesund, S. (2023). Choosing tactics: Horizontal inequalities and the risk of violent and nonviolent conflict. Journal of Peace Research, 002234332211118. https://doi.org/10.1177/00223433221111825
- Holdo, M., & Bengtsson, B. (2020). Marginalization and riots: A rationalistic explanation of urban unrest. Housing, Theory & Society, 37(2), 162–179. https://doi.org/10.1080/14036096.2019.1578996
- Jo, J., & Choi, H. J. (2019). Enigmas of grievances about inequality: Effects of attitudes toward inequality and government redistribution on protest participation. International Area Studies Review, 22(4), 348–368. https://doi.org/10.1177/2233865919833973
- Kawalerowicz, J., & Biggs, M. (2015). Anarchy in the UK: Economic deprivation, social Disorganization, and political grievances in the London riot of 2011. Social Forces, 94(2), 673–698. https://doi.org/10.1093/sf/sov052
- KazStat. (2023). Bureau of National statistics of the Agency for strategic planning and reforms of the Republic of Kazakhstan.
- King, M. (2013). Birmingham revisited – causal differences between the riots of 2011 and 2005? Policing and Society, 23(1), 26–45. https://doi.org/10.1080/10439463.2012.727611
- Lightowlers, C. L. (2015). Let’s get real about the ‘riots’: Exploring the relationship between deprivation and the English Summer disturbances of 2011. Critical Social Policy, 35(1), 89–109. https://doi.org/10.1177/0261018314545597
- Menashe-Oren, A., & Bocquier, P. (2021). Urbanization is no longer driven by migration in low- and middle-income countries (1985–2015). Population and Development Review, 47(3), 639–663. https://doi.org/10.1111/padr.12407
- Mongale, C. O. (2022). Social discontent or criminality? Navigating the Nexus between urban riots and criminal activities in Gauteng and KwaZulu-Natal Provinces, South Africa (2021). Frontiers in Sustainable Cities, 4, 865255. https://doi.org/10.3389/frsc.2022.865255
- Muñoz, J., & Anduiza, E. (2019). If a fight starts, watch the crowd: The effect of violence on popular support for social movements. Journal of Peace Research, 56(4), 485–498. https://doi.org/10.1177/0022343318820575
- Nikitina, A. S., Vasileva, E. I., Zerchaninova, T. E., Alatorceva, I. S., & Ruchkin, A. V. (2022). Protest activity of Russian youth: Motives & factors and value dominants. International Transaction Journal of Engineering, Management, & Applied Sciences & Technologies, 13(3), 1–9. https://doi.org/10.51691/2541-8327_2021_2_4. 13A3M.
- Ostby, G. (2016). Rural-urban migration, inequality, and urban social disorder: Evidence from African and Asian cities. Conflict Management and Peace Science, 33(5), 491–515. https://doi.org/10.1177/0738894215581315
- Rhodes, J. (2009). Revisiting the 2001 riots: New labour and the rise of ‘colour blind racism’. Sociological Research Online, 14(5), 80–91. https://doi.org/10.5153/sro.2048
- Roberts, A. (2009). Civil resistance and power politics: The experience of non-violent action from Gandhi to the present. Oxford University Press.
- Sakal, H. B. (2015). Natural resource policies and standard of living in Kazakhstan. Central Asian Survey, 34(2), 237–254. https://doi.org/10.1080/02634937.2014.987970
- Sanchez, A., & Namhata, C. (2019). What feeds protest participation in sub-saharan Africa? An empirical analysis. Global Food Security, 23, 74–84. https://doi.org/10.1016/j.gfs.2019.04.008
- Sanghera, B., & Satybaldieva, E. (2021). The rise of the rentier class and widening social inequalities. In Rentier capitalism and its discontents, chapter 0 (pp. 17–36). Springer BooksSpringer. https://doi.org/10.1007/978-3-030-76303-9_2
- Scapini, V., Vergara, C., & Contreras, J. (2021). Social crisis, protests and effects on public emergency services: Econometric analysis of the Chilean social outbreak. Paper Presented at the WIT Transactions on the Built Environment, 207, 101–108. https://doi.org/10.2495/DMAN210081
- Sergeyev, V. M., Kazantzev, A. A., Petrov, K. E., & Medvedeva, S. M. (2018). The crisis of contemporary U.S. and EU party systems: Causes and characteristics. Polis, 2, 130–149. https://doi.org/10.17976/jpps/2018.02.10
- Tengrinews. (2022). 162 people own half the fortune. Tokayev instructed to urgently change the situation. https://tengrinews.kz/news/162-cheloveka-vladeyut-polovinoy-sostoyaniya-tokaev-poruchil-459825/
- Till, J. (2013). The broken middle: The space of the London riots. Cities, 34, 71–74. https://doi.org/10.1016/j.cities.2012.01.004
- Tilly, C., & Tarrow, S. G. (2015). Contentious politics. Oxford University Press.
- Urdal, H., & Hoelscher, K. (2012). Explaining urban social disorder and violence: An empirical study of event data from Asian and sub-Saharan African cities. International Interactions, 38(4), 512–528. https://doi.org/10.1080/03050629.2012.697427
- Vasquez, E. (2017). The limits of structure and modus operandi of public and private sectors in Peru: Economic management under social unrest (2000-2015). Proceedings of the 25th International Scientific Conference on Economic and Social Development (ESD)/17th International Social Congress (ISC) Economic and Social Development (ESD 2017), Moscow, Russian Federation (pp. 278–297).
- Verbeek, M. (2004). A Guide to Modern Econometrics (2nd ed.). John Willey & Sons Ltd. England.
- Wacquant, L. (2008). Urban outcasts: A comparative sociology of advanced marginality. Polity Press.
- Walls, W. D., & During, A. (2020). The presidential amnesty programme of 2009 and Nigerian oil production: A disaggregate econometric analysis. OPEC Energy Review, 44(1), 27–42. https://doi.org/10.1111/opec.12168
- Watanabe, N. M., Cunningham, G. B., & Wetherell, G. (2020). The impact of race relations on NFL attendance: An econometric analysis. PLoS ONE, 15(1), e0226938. https://doi.org/10.1371/journal.pone.0226938
- Zuniga-Jara, S. (2022). Social crisis in Chile 2019: Review of two hypotheses as to its cause. CUHSO (Temuco), 32(1), 483–492. https://doi.org/10.7770/cuhso-v32n1-art2186