
 ?Mathematical formulae have been encoded as MathML and are displayed in this HTML version using MathJax in order to improve their display. Uncheck the box to turn MathJax off. This feature requires Javascript. Click on a formula to zoom.
Abstract
In 2010, Vietnam promulgated the Law on Environmental Protection Tax, introducing a comprehensive package of environmental levies. However, few studies have examined the impacts of such an environmental tax within the country. This study aims to explore the effects of the environmental protection tax, leading to higher fuel prices, on household welfare in Vietnam. Using data from the 2020 Household Living Standard Survey and an input-output approach, this paper finds that the total impact is relatively modest. Interestingly, the results reveal a non-linear relationship between the total effects of rising fuel prices and per capita expenditure. Households in the top quintile are the most affected, followed by those in the third and bottom quintiles. Geographically, wealthier urban households and poorer rural households are primarily affected. These findings suggest that increasing the environmental protection tax on petroleum products could be an effective measure to nudge households’ and producers’ demands toward a greener economy. Simultaneously, mitigating any adverse impacts on household welfare is crucial, particularly for poor households in rural areas. Possible solutions include (i) direct and indirect financial subsidies; (ii) clear public communication about the rationale behind an environmental tax on petroleum; (iii) promoting efficient fuel use and launching campaigns to adjust households’ and producers’ demand for fuel products, encouraging a shift from fossil fuels to greener energy alternatives.
1. Introduction
In pursuit of sustainable development, countries worldwide focus on mitigating greenhouse gases and carbon emissions to promote a low-carbon economy (Lee et al., Citation2018; Umer, Citation2020). Environmental protection is achieved through various measures designed to alter the perceptions and behaviours of entities that might negatively impact the environment and address environmental issues. Accordingly, using the tax system as an environmental policy tool has been introduced as a key instrumental factor in mitigation of energy-related emissions and environmental problems (Bashir et al., Citation2022; Miller & Vela, Citation2013; Schöb, Citation2003; Vatn, Citation2015; Vera & Sauma, Citation2015; Yuyin & Jinxi, Citation2018). Through either use of econometric models, input—output model or the CEG model, empirical studies have showed that the implementation of environmental taxes would reduce environmental pollution in both developed and developing countries (Fang et al., Citation2013; Miller & Vela, Citation2013; Morley, Citation2012; Shi et al., Citation2019; Tang et al., Citation2017; Vera & Sauma, Citation2015; Yuyin & Jinxi, Citation2018). These studies typically examine the impact of environmental taxes on reducing environmental pollution from a macroeconomic perspective (using environmental tax revenues) or analyze the reshaping of energy consumption patterns to promote renewable energy production industries, while the relationship at the micro level associated with household expenditure structure has been largely overlooked. The role of environmental tax policies in decreasing energy-related emissions has been clearly mentioned in many studies, nonetheless it is crucial to note that the effects of these taxes on the economy and welfare aspects still have various conclusions (Fullerton & Heutel, Citation2007; Hamaguchi, Citation2020; Khastar et al., Citation2020; McLaughlin et al., Citation2019).
In pursuit of environmental protection and mitigation of the negative impacts of production, consumption, or import activities on the environment, the Law on Environmental Protection Tax was promulgated in Vietnam in 2010 and acted in 2012. By imposing taxes on gasoline, oil, grease, lubricants, coal, HCFC solution, plastic bags, herbicides (limited use), termiticides (limited use), preservative drugs for forest products (limited use), and disinfectant stock (limited use), the government aims to incentivize individuals, households, and businesses to adopt more environmentally-friendly practices and lessen their environmental impact. From 2012 to 2019, this tax was adjusted three times, culminating in the highest tax rate applied to petroleum products and other items with significant environmental impact, effective from 1 January 2019, as per Resolution 579/2018/UBTVQH14. Furthermore, at the 26th UN Climate Change Conference of the Parties (COP26) in 2021, Vietnam committed to achieving net zero emissions by 2050, which may lead to further increases in environmental protection tax. Such increases, particularly in petroleum products—the main source of energy and inputs for many sectors, may substantially affect the country and also the welfare of all households and individuals. This study examines the impact of increased taxes on petroleum products on household welfare, specifically focusing on changes in household expenditure. The study will make a substantial contribution to fill the gap in the literature concerning environmental policy developments in Vietnam because to date, only few studies have examined the impacts of an environmental tax in the country. Firstly, we aim to investigate the total effect (both direct and indirect) of the increased tax on petroleum products on household expenditure by using a combination input—output model and microdata at household level. The previous studies on the impacts of environmental taxes on the economy only either used Input—output model or simulation models based on household’s data (Shahzad, Citation2020). Secondly, this paper will also examine the distributional effects of changes in petroleum prices on household expenditure due to the increased environmental protection tax. This will help to provide more detailed policy implications to mitigate the potentially adverse impacts of the environmental protection tax on household welfare in Vietnam.
The paper is organized as follows: Section 2 reviews related studies. Section 3 presents the methodology and data used to estimate the impact of an increase in petroleum prices on household expenditures. Data analysis and results are presented in Section 4. Section 5 concludes with policy recommendations along with study limitations.
2. Literature review
Over the past few decades, reviewing various emission reduction tools aimed at mitigating the impact of climate change has sparked heated debate. Much of this discussion has focused on the effects of environmental taxes, evaluating their impacts on welfare, the environment, the electricity market, renewable energy development, and many other indicators. In this study, we are seeking research that investigates the impact of environmental taxes on social welfare and households.
Tiezzi (Citation2005) researched the welfare effects and distributive impact of carbon taxation on Italian households. Welfare effects were calculated using True Cost of Living index numbers and Compensating Variation. The parameters were obtained by estimating a complete Almost Ideal demand system using household data from 1985 to 1996. The results showed that the welfare loss was substantial and significantly impacted Italian households. However, the distribution of welfare losses across different levels of total monthly expenditures did not support the regressivity of carbon taxation, as the effect increased as the income level rose. This evidence may encourage the use of carbon taxes, particularly in the transport sector, as cost-effective environmental policy instruments following the ratification of the Kyoto Protocol on Climate Change.
Kpodar and Djiofack (Citation2009) conducted research on the distributional effects of oil price changes on household income in Mali. The study employed a standard computable general equilibrium model to analyse the impact of rising petroleum product prices on household budgets. The results of the analysis indicated that diesel price increases tend to primarily affect richer households, while higher kerosene and gasoline prices tend to impact the poorest households more significantly. Furthermore, the study revealed a U-shaped relationship between the impact of fuel prices on household budgets and per capita expenditure. Irrespective of the petroleum product, high-income households tend to benefit disproportionately from oil price subsidies, indicating that these subsidies are ineffective in protecting the income of poor households compared to targeted subsidies.
In a study by Umar and Umar (Citation2013), the impact of higher fuel prices on different socio-economic groups in Nigeria was assessed using data from the 2010 Household Expenditure Survey. The households were divided into three income groups, and the effect of subsidy cuts was evaluated. The study showed that the increase in fuel prices had a greater negative impact on the middle 40% of households compared to the top 20% and bottom 20%. This was because the middle-income group allocated a larger portion of their budget towards fuel consumption. Additionally, the authors found that fuel subsidies were ineffective in protecting low-income households, as a significant portion of the benefits went to higher-income groups
Dissou and Siddiqui (Citation2014) conducted an assessment of the impact of federal carbon taxes in Canada using a general equilibrium model that accounted for changes in both commodity and factor prices. The authors observed that tax-induced alterations in household consumption expenditures had an adverse impact on welfare, with the effect being more pronounced among lower-income households. Conversely, tax-induced changes in household income had a positive effect on welfare. The study revealed that the relationship between carbon taxes and inequality exhibited a U-shaped pattern: at lower tax levels, carbon taxation could potentially reduce inequality, while at higher tax levels, this effect could be reversed. Fullerton and Heutel (Citation2010) analyzed the impacts of carbon taxes on household income using an analytical general equilibrium model. The authors noted that the effect of carbon taxes on household income could be progressive, regressive, or U-shaped depending on various parameter values, including factor intensities and substitution rates. For example, if carbon-intensive industries are also capital-intensive and capital is readily substitutable by labour, the returns on capital will decline more than real wages, thereby affecting households with larger income shares derived from capital. These findings highlight the importance of carefully assessing the distributional implications of carbon taxes when designing environmental policies.
Beck et al. (Citation2015) used a computable general equilibrium (CGE) model of the Canadian economy and household expenditure survey data to divide households into deciles based on annual income. The model showed that the existing British Columbia carbon tax was highly progressive even before the revenue recycling scheme. As a result, the negative impact of the carbon tax on households with below-median income was smaller than that on households with above-median income.
In their study, Gatawal and Abdullahi (Citation2017) sought to assess the impact of fluctuations in petroleum product prices on household well-being in Zaria Metropolis, Kaduna State, Nigeria. Participants were selected and categorized based on their geographic location. The study employed both descriptive and inferential statistical methods to analyse the data. Descriptive statistics were used to investigate the socio-economic characteristics of household heads and to evaluate the influence of petroleum product price changes on households. In contrast, inferential statistical tools were utilized to specifically demonstrate how changes in petroleum product prices affect households, resulting in decreased demand for the products, thereby having a multiplier effect on goods and services. Conversely, lower prices for petroleum products increase demand for them in Zaria metropolis. The research objective was achieved through the utilization of a non-parametric chi-square test. The results suggest that three petroleum products—petrol, gas, and kerosene—affect household welfare. Higher petroleum product prices lead to a decrease in demand, while lower prices result in increased demand, which is consistent with the demand theory adopted in the study. Furthermore, the research recommends that the government deregulate the downstream petroleum sector to foster increased competition and participation, ultimately leading to reduced petroleum product prices. Additionally, alternative energy sources such as gas, solar, wind, and hydraulic should be considered. The study proposes expanding the consumption capacity effect, which would boost demand for various consumer goods, leading to increased sales and profitability for a large number of Nigerians.
In 2017, Wesseh and colleagues conducted a research study investigating the impacts of carbon taxes. Their findings suggested that carbon taxes could lead to similar emission reduction effects in both low-income and high-income countries. However, in terms of welfare implications, they observed a contrasting outcome: carbon taxes were projected to have a negative effect on low-income regions, while high-income regions were expected to experience positive impacts (Wesseh et al., Citation2017).
Renner (Citation2018) used an input-output model coupled with household survey data to explore the welfare effects of different carbon tax rates on income distribution. The results indicated that higher simulated tax rates showed slight progressivity, but welfare losses remained moderate. Widening the tax base to include natural gas and other greenhouse gases resulted in more regressivity, poverty, and welfare losses.
Okonkwo (Citation2020) has used household survey data for the period 2009–2015 and the Quadratic Almost Ideal Demand System (QUAIDS) model to estimate welfare effects of carbon taxation on South African households. By simulating consumer responses to price changes resulting from carbon taxation, results show that an increase in electricity and public transport prices following a carbon tax policy is regressive while a price increase in motor fuel is progressive. In addition, when there is a simultaneous increase in the prices of energy goods, the poorest and middle income households disproportionately suffer a higher welfare loss compared to the richest households. Li et al. (Citation2020) have used the same method with the micro-data from the 2013 Chinese Household Income Project (CHIP) Survey to simulate and measure the impacts on the welfare of urban and rural households with different incomes after a carbon tax at 50 RMB/ton was levied in China. The results show that the collection of carbon tax will increase households’consumer spending to varying degrees. In urban areas, the carbon tax exerts the greatest impact on low-income households, followed by high-income households; while in rural areas, it has the most significant effects on high-income households and the least on low-income households.
By using the computable general equilibrium model to analyze the impact of the carbon tax on social welfare and the rate of emission reduction in Finland, the results show that despite carbon tax policy in Finland has been successful in the reduction of carbon dioxide emissions, however, it has negative effects on the social welfare of Finns Khastar et al. (Citation2020)
Kpodar and Liu (Citation2021) have extended their research on the effects of fuel price changes on household welfare by examining the indirect impact of fuel price increases on consumer price inflation. This study investigates how different categories of the Consumer Price Index (CPI) respond to changes in domestic fuel prices and evaluates the distributional impact of this pass-through by constructing CPI indices for the poorest and richest income quintiles using household survey data. To conduct this analysis, the authors updated the Global Monthly Retail Fuel Price Database, which now includes premium and regular fuels, has been extended to December 2020, and includes a sample size of 190 countries. The study yielded two key findings. First, the response of inflation to gasoline price shocks was smaller but more persistent and broadly based in developing economies compared to advanced economies. Second, while the purchasing power of all households decreased as fuel prices increased, the distributional impact was progressive. However, the progressivity phased out within six months after the shock in advanced economies, whereas it persisted beyond one year in developing countries.
In Vietnam, there have been several studies on the impact of taxes on household welfare. Nguyen (Citation2018) used the 2016 VHLSS and the Computable General Equilibrium (CGE) model to find that an increase in the value-added tax had no impact on the economy’s output but reduced the welfare of all households. The Policy Impact Assessment Report of the Government of Vietnam, published in 2010, predicted the economic and social effects of three scenarios of increasing the environmental protection tax rate on household welfare. The report found that such an increase would have a negative impact. Nghiem (Citation2019) used the 2016 VHLSS and the 2016 input-output table to show that a 200% increase in petroleum tax rates would result in a 1.03% increase in the CPI and changes in household expenditure for both rich and poor households. Truong (Citation2021) examined the implementation and evaluate the achievement and effectiveness of environmental protection tax in three aspects: economic and fiscal impacts, environmental impacts and social impacts, where the social impacts focused on impact on poverty. Considering the fact that Vietnam has several years of environmental tax policy application background, collecting more up-to-date data and using a similar method which has been used in previous researches to evaluate the impact of this policy on Vietnam’s household welfare will make the results of this research are more realistic.
3. Methodology and data
3.1. Methodology
Input-output model is an established technique in quantitative economic research. It belongs to the family of impact assessment methods and aims to map the direct and indirect consequences of an initial impulse into an economic system across all economic sectors (van Leeuwen et al., Citation2005). In this research, considering the previous studies and the capabilities of the input—output models, this model is chosen.
3.1.1. The direct expenditure effect
For a given product, its budget share is equivalent to the price elasticity of real income or total spending, assuming the volume of demand is constant. The budget shares give a first-order indication of the magnitude of income effects resulting from price changes.
where Y is the level of income or expenditure, bi is the share of spending on good i in total expenditure, and Pi is the price of good i.
The budget shares of petroleum products determine the direct effect on consumers of the increase in petroleum prices.
where ∂logYdi is the direct expenditure effect (expressed in percentage), bt is the budget share of the petroleum product t, Pt is the change in the price of petroleum product t, and n is the number of petroleum products consumed by households.
3.1.2. The indirect expenditure effect and the input-output approach
In order to comprehensively assess the impact of petroleum price increases, it is necessary to estimate the resulting price increases for all other final goods purchased by households. This can be achieved by multiplying the share of household expenditure on each final good by their respective price changes, providing a first-order estimate of the increased cost of purchasing the same basket of goods before and after the petroleum price rise. By doing so, the indirect effect resulting from petroleum price increases can be estimated, which is similar in formula to that of the direct effect:
where ∂ logYin is the indirect expenditure effect (expressed in percentage), bi is the budget share of good i, which is a final good other than petroleum products, Pi is the change in the price of good i, m and n are respectively the number of final goods and the number of petroleum products.
We use Kpodar (Citation2006) input-output approach to estimate the impact of changes in petroleum prices on commodity prices. There are two types of sectors in the economy: non-controlled sectors, where producer prices and taxes determine output prices, and controlled sectors, where output prices are subject to government regulation. Our analysis assumes constant consumption levels and no substitution effects and does not account for changes in consumption patterns or production factor usage by producers in response to the initial price shock. Moreover, we assume that other sectors of the economy fully pass on increases in petroleum prices. Despite these simplifying assumptions, this approach enables us to calculate changes in commodity prices resulting from changes in petroleum prices.
The input-output model, which captures the production technology through a coefficient matrix A, has been widely used to evaluate the effects of changes in the elements that make up sector costs on sector prices. Specifically, the element aij of matrix A denotes the cost of input i in producing one unit of output j and represents the change in the production cost of one unit of j due to a unit change in the price of input i. It is worth noting that the input-output price model assumes a fixed structure of sectoral payments and does not allow for any substitution among the elements that comprise sector costs. In the Leontief framework, which underlies the input-output model, this basic relationship can be expressed in matrix notation:
Where P is the n × 1 vector of sectoral prices, A’ is the n×n transpose matrix of input-output coefficients. V is the n × 1 vector of value added per unit of output.
By putting sectors together according to price control and by partitioning matrices A’ into four matrices A’1, A’2, A’3 and A’4, we obtain:
Where Pc is the p × 1 column vector of the prices in the controlled sectors
Pnc is the (n—p) ×1 column vector of the prices in the noncontrolled sectors
A’1 is the p ×p matrix of the input-output coefficients of the p controlled sectors.
A’2 is the p × (n—p) matrix of the input requirements from the n-p noncontrolled sectors for the production of one unit of output in each controlled sector
A’3 is the (n—p) × p matrix of the input requirements from the p controlled sectors for the production of one unit of output in each n-p noncontrolled sector
A’4 is the (n—p) × (n—p) matrix of the input-output coefficients of the n—p noncontrolled sector.
Vc is the p × 1 column vector of value added per unit of output in the controlled sectors.
Vnc is the (n—p) × 1 column vector of value added per unit of output in the noncontrolled sectors.
n is the total number of sector and p the number of controlled sectors.
The price system (5) gives:
As the prices in controlled sectors are set exogenously, we are only interested in the prices of noncontrolled sectors that are given by the following equation:
Thus:
Assuming that factor prices are constant (therefore v is constant), the change in prices in noncontrolled sectors is given as:
3.1.3. Total effect
Total effect is direct effect plus indirect effect.
3.2. Data
The Vietnam Household Living Standards Survey (VHLSS), initiated in 1993, has been an essential tool for policymakers and development planners to assess living standards. The General Statistics Office (GSO) conducted the survey every two years between 2002 and 2010, but from 2011 to 2020, it was an annual event. However, in odd-numbered years, only data on demographics, employment, and income were collected. The survey’s primary objective is to track and evaluate the living conditions of various demographic groups in Vietnam, monitor the implementation of the Comprehensive Poverty Reduction and Growth Strategy, and contribute to the assessment of the achievement of the Sustainable Development Goals (SDGs) and Vietnam’s socio-economic development objectives. The VHLSS 2020 was conducted nationwide and included 46,980 households in 3,132 communes and wards, representative at the national, regional, urban, rural, and provincial levels. Household and community-level questionnaires were used to collect information on demographics, employment and labour force participation, education, health, income, consumption expenditure, housing, fixed assets, durable goods, and participation in poverty alleviation programmes. The survey provides data on expenditures for health, education, total household consumption expenditures, and expenditures for eating, drinking, smoking, and non-eating, drinking, and smoking items, which include fuel (gasoline, diesel, kerosene, gas, coal, etc.) consumption.
As the 2020 input-output table is unavailable, the 2016 input-output table published by the Vietnam General Statistics Office has been used as an alternative. The implicit assumption behind this use is that there has been no dramatic change in the structure of the economy between 2016 and 2020. The Input-Output table contains data for 164 sectors: base price, production price, and user price. Due to the dynamic and diverse nature of the sector, it often does not align well with household consumption goods. Thus, to estimate the effect of changing prices of petroleum on households’ consumption expenditure, the products of the input-output table will be divided into two categories: the petroleum sector (controlled sector) and non-controlled sectors, which are integrated from industries based on household consumption structure as shown in Table .
4. Results
4.1. Overview of environmental protection tax on petroleum and fuel pump prices in Vietnam
Vietnam introduced the Law on Environmental Protection Tax in 2010, which became effective on 1 January 2012. The law covers eight taxable objects, including petroleum, coal, HCFC solution, plastic bags, herbicides (limited use), termiticides (limited use), preservative drugs for forest products (limited use), and disinfectant stocks (limited use). The government uses the environmental protection tax as a tool to lessen the negative effects of raw materials, fuels, goods, and services that have an impact on the environment during production. According to the Law, the tax imposed on petroleum is presented in Table below:
Table 1. Environmental protection tax bracket of petroleum
Based on changes in oil prices in the domestic and international markets, the National Assembly Standing Committee adjusts the practical rate of the environmental protection tax. The first adjustment was made in 2015 (Resolution 888a/2015/UBTVQH13), which raised the tax rate from 1,000 VND to 3,000 VND per litre of gasoline and aviation fuel, from 500 to 1,500 VND per litre of diesel, and from 300 to 900 VND per litre of fuel oil. In 2018, the National Assembly Standing Committee issued Resolution 579/2018/UBTVQH14 on the environmental protection tax, which increased the tax rates on certain petroleum products and items with adverse effects on the environment to their highest level. As a result, the tax rate on gasoline is now 4,000 VND per litre, 2,000 VND per litre of diesel, and 2,000 VND per litre of fuel oil, an increase of 33.3% for each commodity.
The price of petroleum in Vietnam is calculated on the basis of four main factors: (i) CIF price if imported or oil producer price if being produced domestically; (ii) taxation (an import tax (10% of CIF price), an excise tax (7–10% of CIF price), a value-added tax (10% of sale price), and environmental protection tax (for example: 1000 VND − 4000VND/litre of gasoline); (iii) cost normFootnote1 (950 VND − 1250VND/litre) and profit normFootnote2 (300 VND/litre), (iv) and buffer fund (300 VND/litre). Thus, it can be seen that the rate of tax and fee per litre of gasoline is estimated to range from 35% to 40% of the gasoline price, in which environmental protection tax accounts for 13% − 15% of the gasoline pump price, and similar with diesel, kerosene, etc. Based on this structure, when the environmental protection tax rate on petroleum increases by 1,000 VND will lead to an increase in the user price of fuel pumps of about 5%.
In this paper, we simulate a 5 percent rise in petroleum prices corresponding to the change in environmental protection tax.
4.2. Overview of household expenditure
VHLSS 2020 shows that the average monthly nominal consumption expenditure per person in 2020 is 2,890.2 thousand VND, which is a 13% increase from 2018. The average consumption expenditure per capita per month in urban areas is more than 1.6 times that in rural areas (3,775.8 thousand VND in urban areas compared with 2,384.1 thousand VND in rural areas), although the household size in urban and rural areas is not much different (3.5 people in urban areas and 3.7 people in rural areas).
Regarding the expenditure structure, total household expenditure is divided into consumption expenditure for living (food (eating, drinking, smoking), daily non-food, durable goods, healthcare, education, etc) and other consumption expenditure (e.g., public service fees, charity funds…), in which consumption expenditure for living accounts for a high percentage of total expenditure. In 2020, consumption expenditure for living accounted for 93.05 percent of total expenditure, with expenditure on eating, drinking, and smoking (i.e., food) accounting for 49.8 percent of total expenditure and non-eating, drinking, and smoking accounting for 43.25 percent of total expenditure. Households in rural areas spend more on food than their counterparts in urban areas (50% and 48.9%, respectively). Similarly, food consumption accounts for the largest share of poor households’ total expenditure (57% in the lowest income quintile and 44.4% in the highest income quintile).
Regarding non-eating, drinking, and smoking expenditures, education accounts for 5.5% of total household expenditure. The difference is observed between urban and rural areas and among the five income quintiles. Expenditure on education in urban and rural areas accounts for approximately 7% and 5% of total household expenditure, respectively.
Health expenditure per person per year in 2020 was 3,033.2 thousand VND, accounting for 6.1% of total household expenditure.
Fuel expenditure accounts for about 6% of the total household expenditure, a similar pattern observed in both urban and rural areas. However, petroleum consumption is different between rural and urban areas (3.5% and 4.5% of total household expenditure, respectively). Since grid electricity has covered most regions of the country and almost 99.5% of households will have access to grid electricity as the main source of lighting in 2020, petroleum consumption is largely for transportation.
The structure of other consumption expenditures varies from year to year and is not directly related to household welfare. To estimate the effects (both direct and indirect) in this paper, expenditure for living instead of total household expenditure is used. We classify goods consumed by households into six broad categories (non-controlled sectors). The table below presents the household expenditure structure for living in 2020.
4.3. The effects of increasing in petroleum prices (due to environmental tax) on household income and expenditure
Initially, we outline the direct expenditure effects distribution, followed by the assessment of the indirect distributional effects that emanate from the surge in other commodity prices. Subsequently, we highlight the distribution of the total effect and make comparisons with other relevant country studies. We adopt the convention of equating a rise in expenditure attributable to increased product prices with a decrease in real income for convenience.
4.3.1. The direct expenditure effects
Household fuel expenditure is predominantly for gasoline and diesel, which account for 45 percent of total spending on fuel. On average, 1.48 percent of household expenditures for living are allocated for gasoline and about 1.49 percent for diesel. Other sources of energy represent a relatively small share of household consumption.
The consumption of petroleum products differs significantly across household quintiles according to their expenditure levels (Table ). On average, the richest households allocate the highest portion of their budget for living to gasoline and diesel due to having more transport vehicles, especially cars (the number of cars per 100 households in the top quintile is 12.7, while there are only 0.5 cars per 100 households in the bottom quintile). Other fuel products are disproportionately consumed by wealthier households. However, the bottom quintile seems to consume a higher proportion of gasoline and diesel compared to the second and third quintiles, which may be due to diesel being used more frequently in agricultural activities, in which poor households are heavily concentrated.
Table 3. Household budget shares of fuel spending by product (percent of total household expenditure for living)
The direct impact of an increase in petroleum prices on household expenditure is found to be modest, resulting in a 0.2% increase in living expenses for a 5% rise in petroleum prices. The impact shows a non-linear distribution pattern across different household income quintiles. Among the quintiles, the lowest-income households are impacted more severely than those in other quintiles, except for the top quintile, as presented in Table . Specifically, a 5% rise in the prices of all petroleum products leads to a 0.182% increase in household expenditure for the bottom quintile. While households in the top quintile experience a larger increase in expenditure of 0.251%. The intermediate quintiles experience a smaller rising in expenditure than the top and bottom quintiles. Notably, although low-income individuals lose less in nominal terms than other income groups, the reduction in their real income is relatively higher, given their low level of expenditures.
Table 4. Direct expenditure effects of petroleum price increases by household income quintile, rural-urban
The distributional effects of the rise in petroleum prices are similar in both rural and urban areas, but urban households are, on average, more affected. A 5 percent increase in petroleum prices results in an average increase in expenditure of 0.225 percent for urban households and 0.173 percent for rural households. The bottom quintile households in rural areas experience the biggest increase in expenditure following a rise in petroleum prices resulting from an increase in environmental taxes on petroleum products. Given the pattern of household budget shares, the bottom quintile in urban areas will experience the biggest increase in expenditure when gasoline prices go up, while the bottom quintile in rural areas will experience be the biggest increase in expenditure following a rise in diesel prices.
4.3.2. The indirect effects
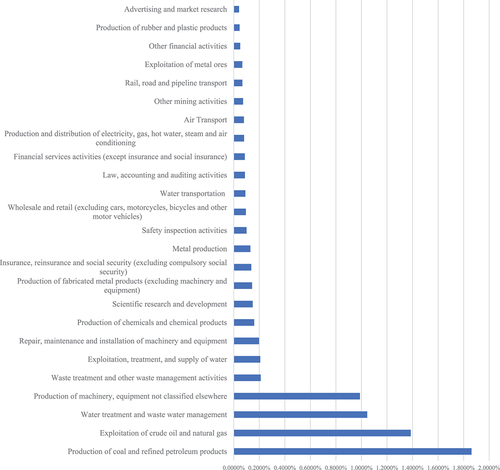
According to the input-output analysis, the impact of a 5 percent increase in petroleum prices on different sectors of the economy varies significantly depending on their input-output linkages with the petroleum sector (Figure ). The manufacture of coke and refined petroleum products sector experiences the largest increase in prices (1.9 percent), followed by crude oil and natural gas extraction (1.4 percent), drainage and sewage treatment (1.04 percent), and the manufacture of machinery and equipment not classified elsewhere (0.99 percent). The estimation of these price increases was based on the input-output matrix and assumed that the increases in production costs caused by higher petroleum prices were fully passed through to output prices. However, the prices of electricity and public services were assumed to be controlled by the government and, therefore, were exempt from this assumption.
Figure 1. Price changes of Commodities in other sectors due to a 5 percent increase in petroleum prices (in percent). Only sectors with an average expenditure effect greater than 0.03 percent are presented.
The bulk of the indirect expenditure effect comes through increases in daily non-food expenditures and expenditure on housing, electricity, water, and sanitation due to the high price increases rather than high budget shares. Although food expenditures account for a high budget share, the indirect expenditure effect of those sectors is small. That is mainly because they are less sensitive to the increase in petroleum prices (Table ). The results imply that the indirect impact of increased petroleum price s will hurt the poor slightly less than the rich since poor households spend more on food products and devote a relatively small share of their budgets to housing, electricity, water, and sanitation (Table ). The expenditure effects on education and health care are very small, especially in the education sector; thus, the increase in petroleum prices rarely affects households access to education and health.
Table 5. Indirect price and expenditure effects by sector (in percent)
Table 2. Share of household expenditure on different goods and services for living by household income quintile (in percent)
Analysis by income quintiles also shows that the indirect effects of rising oil prices are small and show a little bit of progression, with the biggest increases in spending happening in the wealthiest households (as shown in Table ). These findings provide further support for the conclusion that urban households are more susceptible to the impacts of petroleum price increases relative to their rural counterparts.
Table 6. Indirect expenditure effects by quintile, rural and urban
4.3.3. The total effects
The total expenditure effects, as presented in Table , reinforce the findings from the analysis of direct effects, which account for 72% of the total effect. The results show that the impact of petroleum price increases on household expenditures is limited, with urban households bearing a greater burden than rural households. Additionally, the highest incidence of rising petroleum prices is observed in the top income quintile. Finally, the relative share of the direct effect is about 2.5 times greater than the share of the indirect effect.
Table 7. Total direct and indirect expenditure effects by quintile, urban and rural
The impact of fuel prices on household budgets exhibits a non—linear relationship with per capita expenditure. Although the bottom, third, and top expenditure quintiles are the most significantly impacted, the effect is modest. Specifically, households in the bottom quintile experience a 0.254% increase in expenditures, which is smaller than the impact on households in the top quintile due to the higher share of the latter’s income spent on petroleum products and their ownership of more vehicles. However, the impact on households in the bottom quintile is still larger than the impact on households in the second and fourth quintiles.
5. Conclusion and policy implications
In Vietnam, an adjustment in the environmental protection tax imposed on petroleum products, resulting in increased fuel prices, has a negative, albeit modest, effect on household spending. Empirical findings reveal that a 5 percent increase in petroleum prices leads to an average 0.277 percent increase in household expenditures, with a slightly smaller effect observed in rural households (0.249 percent) than in urban households (0.307 percent) and most of the impacts is direct impact. The impact of rising petroleum product prices on household spending is non-linear across different income groups, with households in the top quintile experiencing the most significant effects, followed by those in the third and bottom quintiles. The increase in fuel prices primarily affects wealthy households in urban areas and poor households in rural areas. The indirect effect of petroleum price increases, resulting from higher prices of other goods and services, is evaluated using input-output linkages with the petroleum sector, and constitutes only about 28 percent of the total effect.
The inverse and nonlinear impact of increasing petroleum price due to the environmental protection tax on Vietnam’s household welfare is similar with other developing countries. The analysis results indicate that the impact of increased environmental protection taxes, leading to a rise in fuel prices, on household expenditures in Vietnam is relatively minor and mostly is direct impact, thus there is still room to increase the environmental protection tax in the future and an increasing the environmental protection tax on petroleum products could be an effective measure to nudge households’ consumption toward a greener
The results of the study have important policy implications. First, since the poor households in rural areas are more adversely affected than others, the government must implement short-term support policies to alleviate the adverse effects of this tax increase on vulnerable populations. Potential solutions could involve direct cash subsidies for the poor households or indirectly enhancing social services such as healthcare and education for rural and economically disadvantaged citizens.
Second, household fuel expenditure is predominantly for gasoline and diesel, to mitigate long-term adverse impacts of increasing environmental protection tax, households should adjust their fuel consumption, leading to a reduction in expenditure by substituting alternative fuels or other goods and services. It is essential to establish policies and measures that promote using more efficient and economical fuels. The government can use taxation tools to incentivize the use of transportation means that consume less fuel. Raising public awareness of economical fuel usage through mass communication campaigns is crucial.
Third, the indirect impact of rising fuel prices is progressive, affecting the affluent more significantly. This suggests that increasing environmental protection taxes aligns with Vietnam’s sustainable and equitable development goals. However, it is important to note that wealthy households also have a substantial potential to contribute to the budget. Therefore, corporate and personal income tax exemptions should be considered for businesses and individuals making significant contributions to environmental protection funds.
Fourth, the analysis results show that the oil refining industry is the most affected due to its significant reliance on fuel inputs. Therefore, to limit the adverse effects on this industry’s production and product pricing, the government needs to establish supportive measures for businesses in the sector. These measures could include preferential loans for technology innovation, and strategies to improve production efficiency. Such interventions will help enterprises reduce input costs and maintain stable operations.
Fifth, to ensure public support and unified action, the government must widely communicate the benefits of environmental protection taxes and clearly explain the rationale for the fuel tax adjustments. Citizens need to understand that the purpose of this measure is to protect the environment, not merely to increase budget revenue. This understanding will help garner societal consensus and facilitate cooperative implementation. In addition, enhancing public awareness and highlighting renewable energy benefits to win public acceptance of renewable energy deployment is important to change household’s energy structure consumption (Ali et al., Citation2023).
Last but not least, since the total impact is modest, alongside increasing environmental protection taxes, it is vital for the government to develop greener, more sustainable alternative energy sources such as solar power, wind power, and biomass energy. The government could also use budget tools to subsidise green products such as solar batteries, energy-saving LED lights, and solar panels. In addition, diversifying the fuel structure used in transportation and shifting consumer behaviour towards “greener” options are key solutions to achieve sustainable development. This will help gradually reduce dependence on fossil fuels and shift consumer demand towards more environmentally friendly options. The government should enact policies incentivising businesses to invest in transport vehicles using alternative fuels such as electricity, CNG, LPG, and LNG. Increased investment in subway systems, BRT buses, optimising routes and fares, and improving service quality, especially in large cities will encourage citizens to shift from private to public transportation to reduce individual fuel consumption. It will be an excellent effort for the country to fulfil Vietnam’s environmental commitments under COP26.
Support for citizens in replacing old devices with green technologies like biogas stoves and energy-saving light bulbs is also essential. These financial support policies will help reduce initial consumer costs, encouraging greener product selection.
While this study has made specific achievements, it has limitations and presents future research opportunities. First, the research focuses on the short-term impact of increasing environmental protection taxes. However, more extended research is necessary to assess the adaptation and adjustments of households and businesses over time. This will allow for the construction of more accurate scenarios and forecasts. Second, the current study assumes a fixed increase in environmental protection taxes on fuel as determined by the Government. However, applying this absolute tax rate has limitations and may not fully reflect the flexibility and effectiveness of tax policies in controlling pollution. For many products, the application of a fixed absolute tax lacks flexibility and may not be appropriate. Different products have varying degrees of environmental impact, necessitating appropriate tax mechanisms, possibly as a percentage or a combination, to encourage using more environmentally friendly products. Further in-depth research is needed on mechanisms for determining appropriate levels of environmental protection tax for each phase based on socio-economic factors. This will help refine Vietnam’s environmental protection tax policies to be more flexible and effective.
Acknowledgments
The researchers respect the National Economics University for funding this study.
Disclosure statement
No potential conflict of interest was reported by the author(s).
Additional information
Funding
Notes on contributors

Hoa Nguyen Quynh
Dr. Hoa Nguyen Quynh, with over two decades at National Economics University, now heads its Development Economics department. Her vast experience includes consulting on development projects and publishing papers on economic development and gender inequality.
Dr. Dung Ngo Quoc, a senior lecturer at the same institution, specializes in Economic Planning and Institutional Economics. He's keen on data analysis and emphasizes quantitative methods in his work.
Dung Ngo Quoc
Dr. Hoa Nguyen Quynh, with over two decades at National Economics University, now heads its Development Economics department. Her vast experience includes consulting on development projects and publishing papers on economic development and gender inequality.
Toan Pham Ngoc
Dr. Toan Pham Ngoc is a senior researcher at the Institute of Labour Science and Social Affairs. Specializing in Mathematical Economics, he employs econometric methods to analyze and predict labor and welfare issues.
Lien Nguyen Thi Thu
Dr. Lien Nguyen Thi Thu, an Assistant Professor at National Economics University, stands out in government and management accounting, contributing both academically and practically.
Notes
1. In Vietnam, since the petroleum sector is partly regulated by the government, in addition to the CIF, or producer price, and taxes, other costs and profits are set by the government, which are called cost norms and profit norms.
2. Similar above.
References
- Ali, M., Irfan, M., Ozturk, I., & Rauf, A. (2023). Modeling public acceptance of renewable energy deployment: A pathway towards green revolution. Economic Research-Ekonomska Istraživanja, 36(3). https://doi.org/10.1080/1331677X.2022.2159849
- Bashir, M. F., Ma, B., Bashir, M. A., Radulescu, M., & Shahzad, U. (2022). Investigating the role of environmental taxes and regulations for renewable energy consumption: Evidence from developed economies. Economic Research-Ekonomska Istraživanja, 35(1), 1262–18. https://doi.org/10.1080/1331677X.2021.1962383
- Beck, M., Rivers, N., Wigle, R., & Yonezawa, H. (2015). Carbon tax and revenue recycling: Impacts on households in British Columbia. Resource and Energy Economics, 41, 40–69. https://doi.org/10.1016/j.reseneeco.2015.04.005
- Dissou, Y., & Siddiqui, M. S. (2014). Can carbon taxes be progressive? Energy Economics, 42, 88–100. https://doi.org/10.1016/j.eneco.2013.11.010
- Fang, G., Tian, L., Fu, M., & Sun, M. (2013). The impacts of carbon tax on energy intensity and economic growth—a dynamic evolution analysis on the case of China. Applied Energy, 110, 17–28. https://doi.org/10.1016/j.apenergy.2013.04.041
- Fullerton, D., & Heutel, G. (2007). The general equilibrium incidence of environmental taxes. Journal of Public Economics, 91(3–4), 571–591. https://doi.org/10.1016/j.jpubeco.2006.07.004
- Fullerton, D., & Heutel, G. (2010). Analytical general equilibrium effects of energy policy on output and factor prices. Advances in Economic Analysis & Policy, 10(2), 376. https://doi.org/10.2202/1935-1682.2530
- Gatawal, N. M., & Abdullahi, Z. (2017). Impact analysis of petroleum product price changes on households’ welfare in Zaria Metropolis, Kaduna state. International Journal of Humanities and Social Science Invention, 6(4), 40–49.
- Hamaguchi, Y. (2020). Dynamic analysis of bribery firms’ environmental tax evasion in an emissions trading market. Journal of Macroeconomics, 63, 103169. https://doi.org/10.1016/j.jmacro.2019.103169
- Khastar, M., Aslani, A., & Nejati, M. (2020). How does carbon tax affect social welfare and emission reduction in Finland? Energy Reports, 6, 736–744. https://doi.org/10.1016/j.egyr.2020.03.001
- Kpodar, K. (2006). Distributional Effects of Oil Price Changes on Household Expenditures: Evidence from Mali. WP/06/91. IMF.
- Kpodar, K., & Djiofack, C. (2009). The distributional effects of oil price changes on household income: Evidence from Mali. Journal of African Economies, 19(2), 205–236. https://doi.org/10.1093/jae/ejp023
- Kpodar, K., & Liu, B. (2021). The distributional implications of the impact of fuel price increases on inflation (Working Paper No. 2021/271). IMF.
- Lee, C. T., Mohammad Rozali, N. E., Klemeš, J., & Towprayoon, S. (2018). Advancing low-carbon emissions in Asia: Mitigation of greenhouse gases and enhancing economic feasibility for major sectors. Clean Technologies and Environmental Policy, 20(3), 441–442. https://doi.org/10.1007/s10098-018-1511-9
- Li, X., Li, Z., & Wang, Z. (2020). The welfare effects of carbon tax on Chinese households: A study based on the 2013 chip survey data. Chinese Journal of Urban and Environmental Studies, 8(4), 2050019. https://doi.org/10.1142/S2345748120500190
- McLaughlin, C., Elamer, A. A., & Glen, T. (2019). Accounting society’s acceptability of carbon taxes: Expectations and reality. Energy Policy, 131, 302–311. https://doi.org/10.1016/j.enpol.2019.05.008
- Miller, S., & Vela, M. A. (2013). Are environmentally related taxes effective? Inter-American Development Bank IDB-WP-467. https://doi.org/10.2139/ssrn.2367708
- Morley, B. (2012). Empirical evidence on the effectiveness of environmental taxes. Applied Economics Letters, 19(18), 1817–1820. https://doi.org/10.1080/13504851.2011.650324
- Nghiem, T. V. (2019). Assessment of the impact of environmental tax, gasoline tax on household consumption in Vietnam (Report No.2.1.3-B18-19). GSO.
- Nguyen, D. T. (2018). Assessment of the impact of value added tax on the economy and household’s welfare. Hong Duc Publishing House.
- Okonkwo, J. (2020). Welfare effects of carbon taxation on South African households. Energy Economics, 96, 104903. https://doi.org/10.1016/j.eneco.2020.104903
- Renner, S. (2018). Poverty and distributional effects of a carbon tax in Mexico. Energy Policy, 112, 98–110. https://doi.org/10.1016/j.enpol.2017.10.011
- Schöb, R. (2003). The double dividend hypothesis of environmental taxes: A survey (CESifo Working Paper No. 946). CESifo. https://doi.org/10.2139/ssrn.413866
- Shahzad, U. (2020). Environmental taxes, energy consumption, and environmental quality: Theoretical survey with policy implications. Environmental Science and Pollution Research, 27(20), 24848–24862. https://doi.org/10.1007/s11356-020-08349-4
- Shi, Q., Ren, H., Cai, W., & Gao, J. (2019). How to set the proper level of carbon tax in the context of Chinese construction sector? A CGE analysis. Journal of Cleaner Production, 240, 117955. https://doi.org/10.1016/j.jclepro.2019.117955
- Tang, L., Shi, J., Yu, L., & Qin, B. (2017). Economic and environmental influences of coal resource tax in China: A dynamic computable general equilibrium approach. Resources, Conservation and Recycling, 117(A), 34–44. https://doi.org/10.1016/j.resconrec.2015.08.016
- Tiezzi, S. (2005). The welfare effects and the distributive impact of carbon taxation on Italian households. Energy Policy, 33(12), 1597–1612. https://doi.org/10.1016/j.enpol.2004.01.016
- Truong, D. D. (2021). Economic instrument in environmental management: A case study of environmental protection tax in Vietnam. Environment and Ecology Research, 9(5), 300–313. https://doi.org/10.13189/eer.2021.090509
- Umar, H. M., & Umar, M. S. (2013). An assessment of the direct welfare impact of fuel subsidy reform in Nigeria. American Journal of Economics, 3(1), 23–26. https://doi.org/10.5923/j.economics.20130301.05
- Umer, S. (2020). Environmental taxes, energy consumption, and environmental quality: Theoretical survey with policy implications. Environmental Science and Pollution Research, 27(20), 24848–24862. https://doi.org/10.1007/s11356-020-08349-4
- van Leeuwen, E. S., Nijkamp, P., & Rietveld, P. (2005). Regional input–output analysis. In K. Kempf-Leonard (Ed.), Encyclopedia of social measurement (pp. 317–323). Elsevier. https://doi.org/10.1016/B0-12-369398-5/00349-2
- Vatn, A. (2015). Markets in environmental governance: From theory to practice. Ecological Economics, 117, 225–233. https://doi.org/10.1016/j.ecolecon.2014.07.017
- Vera, S., & Sauma, E. (2015). Does a carbon tax make sense in countries with still a high potential for energy efficiency? Comparison between the reducing-emissions effects of carbon tax and energy efficiency measures in the Chilean case. Energy, 88, 478–488. https://doi.org/10.1016/j.energy.2015.05.067
- Vietnam National Assembly. (2010). Law environmental protection tax. No: 57/2010/QH12. National Assembly of the Socialist Republic of Vietnam.
- Wesseh, P. K., Lin, B., & Atsagli, P. (2017). Carbon taxes, industrial production, welfare and the environment. Energy, 123, 305–313. https://doi.org/10.1016/j.energy.2017.01.139
- Yuyin, Y., & Jinxi, L. (2018). The effect of governmental policies of carbon taxes and energy-saving subsidies on enterprise decisions in a two-echelon supply chain. Journal of Cleaner Production, 181, 675–691. https://doi.org/10.1016/j.jclepro.2018.01.188