?Mathematical formulae have been encoded as MathML and are displayed in this HTML version using MathJax in order to improve their display. Uncheck the box to turn MathJax off. This feature requires Javascript. Click on a formula to zoom.
Abstract
This article aims to explore the interplay between financial stability, financial inclusion, and inclusive growth in 40 African countries during the period 2004–2020. It acknowledges that an unstable financial system has the potential to erode confidence and hinder the essence of financial inclusion in promoting inclusive growth. However, studies regarding the combined effect of financial inclusion and financial stability on inclusive growth are hard to find, especially in Africa. By examining the effects of financial inclusion on inclusive growth and the synergistic relationship between financial stability and inclusive growth, this study seeks to shed light on how these factors interact in the context of African economies. To cater for endogeneity issues, we used a two-step system generalized method of moment. Our result reveals three outcomes: First, financial inclusion promotes inclusive growth. Second, financial stability alone is less effective to enhance inclusive growth. Lastly, financial stability forms synergy with financial inclusion to further spike inclusive growth. It is recommended that policymakers should strive to enhance financial inclusion by promoting financial stability.
1. Introduction
Financial inclusion has gained prominence in topmost policy agenda for policymakers around the world in terms of achieving inclusive growth. The concept of financial inclusion surfaced during the early 2000s, prompting governments and international organizations to prioritize it in their policies as a means to alleviate poverty and foster inclusive economic growth (Siddik & Kabiraj, Citation2020). It’s no surprise that the United Nations considered financial inclusion to be one of the most important vehicles to achieve the Sustainable Development Goals (SDGs). For instance, financial inclusion is seen as a key enabler in reducing poverty and inducing economic welfare (World Bank, Citation2022). Financial inclusion can be defined as the provision of financial services to businesses and individuals on an equal basis, with financial account being the primary consideration (World Bank, Citation2022). Financial inclusion is also seen an approach that ensures convenient accessibility, preparedness, and utilization of financial services for all individuals across a country (Sharma, Citation2016).
Theoretically, financial inclusion is regarded as a driving force towards economic growth (Sulong & Bakar, Citation2018). Evidence from Schumpeter (Citation1911) showed that through financial sectors’ services (i.e., allowing access to financial resources, innovation, efficiency, and investment), growth and development increase. Financial inclusion can induce inclusive growth through reducing poverty and inequality by allowing people to save for the future, plan their spending, and manage financial risk (Demirgüç-Kunt & Singer, Citation2017). By implication, financial inclusion can increase the level of firm formation, which has been one of the government policies in every country due to its impact on job creation, economic growth, empowerment, and poverty reduction (Fareed et al., Citation2017; Sethi & Acharya, Citation2018; Inoue, Citation2019).
The term for growth that allows every individual or group in society to participate in and contribute to the growth process equally, regardless of their individual circumstances, is known as inclusive growth (Ali & Son, Citation2007). The notion of inclusive growth entails the progression and result in which all segments of society have engaged in fostering growth and have experienced fair and equitable benefits from it (Anyanwu, Citation2013;Dollar & Kraay, Citation2002; Klasen, Citation2010; Ramos et al., Citation2013). The determination and measurement of inclusive growth frequently require the consideration of multiple factors, such as income, poverty, employment, and equitable distribution of resources (Anand et al., Citation2013; Klasen, Citation2010; Ramos et al., Citation2013). Non-inclusive growth often leads to an uneven distribution of wealth and income, concentrating economic gains among a small segment of the population while leaving others behind. This exacerbates the wealth gap and can lead to social unrest and instability (Ofori & Asongu, Citation2021, Citation2021; World Bank, Citation2020). For instance, there is political unrest in some countries in Africa such as Burkina Faso, Chad, Mali, Guinea, Nigeria, Niger, and currently Gabon considering the series of Coup d’etats in these countries (Ofori & Asongu, Citation2021, Citation2021; Henry & Murray, Citation2023; World Bank, Citation2020). This is because Africa has made effort over the years to attain economic growth, while less attention is paid on sustaining such growth. Evidence gleaned from Ofori and Asongu (Citation2022), Ofori and Asongu (Citation2021) and World Bank (Citation2020) showed that Africa, specifically Sub-Saharan Africa, experienced annual GDP growth of 5% on average between 2010 and 2020, compared to global growth of about 3%. However, the continent’s growth is non-inclusive despite its current performance (Ofori & Asongu, Citation2021, Citation2021). Failure to attain inclusive growth agenda could endanger the ability of African nations to attain Sustainable Development Goals (SDGs) and the African We Want (Agenda 2063). Achieving inclusive growth also means that the continent will be able to reduce poverty and ensure equality and economic growth as stated in Agenda 2063.
In Africa, where small and medium enterprises (SMEs) contribute more to growth, employment and job creation (Ayyagari et al., Citation2014), financial inclusion can provide suitable financial services to these SMEs which will help them to grow. It is against this background that this study seeks to investigate the possible relationship between financial inclusion and inclusive growth in Africa. Towards that end, many African countries have made notable efforts over the years to reform their financial system which help to make financial services available to most populace (Manu et al., Citation2011). Therefore, we propose financial inclusion as a channel to attain inclusive growth. However, stability is a prerequisite for fostering inclusivity within any financial system, ensuring that it can extend essential financial services to all segments of society (Amatus & Alireza, Citation2015). This is because many countries in Africa are actively working towards achieving greater financial inclusion, aiming to bring a larger portion of their populations into the formal financial system. However, without a stable and resilient financial infrastructure, the full potential of these inclusion efforts may not be realized.
Financial stability demonstrates financial efficiency and solidity, implying that key financial institutions must operate uninterrupted in order to increase public trust in the financial system. Financial stability encompasses a state wherein the financial system, including intermediaries, markets, and market infrastructures, possesses the resilience to endure shocks without significant disruptions in financial intermediation and the efficient allocation of savings towards productive investments (European Central Bank, Citation2023). Put simply, the financial system achieves stability when it effectively facilitates the functioning of the economy and effectively addresses both internal and external financial imbalances (Schinasi,Citation2004). When a financial system is stable, it can effectively support and sustain financial inclusion initiatives, which aim to provide access to basic financial services to all members of society, especially those who were previously excluded or underserved (Manu et al., Citation2011). This also means that the presence of a stable financial system fosters consumer confidence and trust, empowering individuals to save for the future, effectively plan their spending, and manage financial risks. Consequently, this reduction in poverty and enhancement of citizens’ income levels are achieved.
Financial stability is important because when foreign investors consider whether to set up businesses in foreign markets, one of the first priorities is the stability of the domestic financial system (Cheang, Citation2004). As a result, financial stability can boost inclusive growth by attracting foreign investors, who can provide the country with spillovers, forward and backward integration, and global value chain. Financial inclusion can spur economic growth and contribute to a more inclusive society. A stable financial system ensures that this growth is sustainable and balanced, fostering a positive feedback loop between financial inclusion and overall inclusivity. There is few evidence (Abor et al., Citation2018; Alemu, Citation2016; Cournède et al., Citation2015; Demirgüç-Kunt & Singer, Citation2017) on nexus between financial inclusion and inclusive growth. We take our motivation from this and extend the line of argument by investigating the impact of financial inclusion on inclusive growth in Africa. Also, we add to literature by determining the moderation role of financial stability on the nexus between financial inclusion and inclusive growth in Africa. This is because there is no empirical studies on the moderation role of financial stability on the nexus between financial inclusion and inclusive growth in Africa.
The rest of the article is structured as follows; literature review is captured in Section 2; materials and method are incorporated in Section 3; Section 4 presents the empirical results; and we finally conclude the study and provide empirical implication in Section 5.
2. Review of extant literature
The underpinning theory can be traced from finance-growth theory which is viewed in two ways. First, one wing of finance-growth theory is the supply leading hypothesis where finance tends to increase the level of growth through increased savings and reduction of poverty level (Gurley & Shaw, Citation1955; Mckinnon, Citation1973; Schumpeter, Citation1911; Shaw, Citation1973). This implies that efficient and effective allocation of financial resources enhance growth. The other wing, which is demand leading hypothesis argues that when an economy experienced an increasing growth, it will enhance the development of the financial system (Robinson, Citation1952). According to this hypothesis, the expansion of economic activities within an economy necessitates the presence of financial institutions to provide essential services for economic growth. As a result, growth takes the lead, and finance follows. Later, the finance-growth nexus was extended. For instance, Greenwood and Jovanovic (Citation1990) constructed a model that internally attributes significance to financial intermediation in economic growth and elucidates how financial intermediaries can make more productive investments compared to individuals. This is due to their superior ability to identify investment prospects that foster economic growth.
Recently, the policy direction of the financial system has shifted from financial development to financial inclusion. Studies on the nexus between financial inclusion and growth have received much attention in the developed countries than the developing countries. Without a doubt, Park and Mercado (Citation2015) concluded that financial inclusion in developing economies is still in its infancy. Despite much attention in developed economy, the nexus still remains debatable. Different estimation techniques such as generalized method of moment (GMM), ordinary least squares (OLS), panel regression [fixed effect and (or) random effect], vector autoregressive (VAR) models, and autoregressive distributed lag (ARDL) were employed, however, both similar results and contradictory results were found. For instance, some studies either in developed or developing countries concluded that financial inclusion enhances growth (see, Kim, Citation2016; Kim et al., Citation2017; Pradhan et al., Citation2021; Andrianaivo & Kpodar, Citation2011, Inoue & Hamori, Citation2016; Rasheed et al., Citation2016). According to these studies, the channels through which financial inclusion spur growth is when there is financial access efficiency, reliability and sustainability. For instance, Abor et al. (Citation2018) showed that if a poor household has access to financial resources (credit) at a cheaper price, the likelihood that the household will live in an extreme poverty is very minimal. Similar study by Cumming et al. (Citation2014) showed that entrepreneurs most especially small businesses stimulate to risk taking and encourage more investment which boost the growth of the economy.
However, some empirical studies have found that financial inclusion impedes growth due to a weak financial system, ineffective policy, and poor financial instruments (see Barajas et al., Citation2013; Bhattarai, Citation2015; Naceur & Ghazouani, Citation2007; Natamba et al., Citation2013; Pearce, Citation2011). Another finding by Arestis et al. (Citation2001) revealed that, despite differences in inflation, countries with efficient financial access maintained growth. In terms of the measurement of financial inclusion, while some studies use index (see Kim, Citation2016; Van et al., Citation2019), others use a single indicator (see Abor et al., Citation2018; Andrianaivo & Kpodar, Citation2011; Kim et al., Citation2017). Some of those who used index employed variables that capture access only, others also captured both access and usage. In the same vein, studies that employed individual variables either used the variables in the same regression (Kim et al., Citation2017; Inoue & Hamori, Citation2016) or used them in different regression (see Abor et al., Citation2018; Andrianaivo & Kpodar, Citation2011).
In general, most studies in the review focus on only GDP per capital or income rather than equality and poverty reduction when measuring inclusive growth. Therefore, we capitalise on that and add to literature by using a variable (human development index) that is beyond only capturing income or growth to incorporating poverty reduction, income (growth), education, health, gender equality and equality simultaneously. Although there is similar study (Boachie et al., Citation2023) that examine the relationship between financial inclusion, bank stability, and growth, that article used both banking stability and growth as dependent variables. Boachie et al. (Citation2023) failed to probe further to know how the presence of financial stability can enhance the relationship between financial inclusion and growth. Hence, we fill this gap by providing evidence on the moderation role of financial stability on the nexus between financial inclusion and inclusive growth in Africa. The current study focused on financial stability because the review suggests that lack of financial soundness can limit inclusiveness of finance to impact growth.
3. Method and materials
3.1. Method
We examined the effect of financial inclusion and financial stability on inclusive growth for 40 African countries. We also determined the moderation role of financial stability on the nexus between financial inclusion and inclusive growth. This was motivated by Schumpeter (Citation1911) finance-growth theory, which showed that through financial sectors’ services (i.e., allowing access to financial resources, innovation, efficiency and investment), growth and development increase. We specify our empirical model following dynamic model in levels and first difference to summaries the standard system GMM procedure as shown in equation (1) and (2).
From both equations (1) and (2), ,
,
denotes the parameter estimates;
and
are the time and country measurement;
(Tau) represents the coefficient of auto-regression;
is country-specific effects;
is time-specific constant; and
is the disturbance term. Also, PL denotes the various control variables such as competition, non-performing loans, trade openness, and population growth.
is the dependent variable which is inclusive growth; FII is the financial inclusion; FS represents financial stability;
is the interactive term of financial inclusion and financial stability.
We paid attention to GMM due to the variation in our cross sections (N = 40 countries) and number of years (T = 17 years). Specifically, GMM is suitable when N is greater than T. Also, the use of GMM becomes necessary as a result of high persistency of the explained variable. The persistent level is when there is a high correlation (rule of thumb 0.800) between the explained and its first lag. In our case, the persistent level is 0.99 as apparent in Table in the appendix, which is even above the rule of thumb. Also, we opt for GMM on grounds of endogeneity. The endogeneity problem emanates from past values of the dependent variable (inclusive growth), which could have a strong relationship with current inclusive growth values (Oduola et al., Citation2022; Ofori & Asongu, Citation2021; Van et al., Citation2019). This implies that the endogeneity problem can be traced from the conventional econometric assertion that depends on
and can also depend on the country-specific effect (i.e.,
). Although GMM has two main estimators (i.e., difference and system), we employed system GMM because of the limitation of difference GMM. This is because the difference GMM is confronted with weak instrument (Che et al., Citation2013). We thus used the system GMM because of the identification to limit instruments proliferation and its ability to control for cross-country dependence, which is mostly associated with panel data (Ofori & Asongu, Citation2021, Citation2021; Tchamyou et al., Citation2019). Also, we adopted dynamic system GMM of Roodman (Citation2009) on the grounds that Roodman’s extension used a forward orthogonal dispersion as against first difference.
Additionally, we opt for two-stage system GMM as against first-stage system GMM because it caters for autocorrelation and heteroskedasticity (Oduola et al., Citation2022; Ofori & Asongu, Citation2021; Tchamyou et al., Citation2019; Van et al., Citation2019). As shown in equations (1) and (2), the instruments used in estimating two-stage system GMM are the lags of the regressors for the difference equation and the first difference of the regressors for the level equation. However, there is need to test the validity of the instruments since it presents robust estimates. By so doing, we employed Hansen’s test of over-identification which is tested on the null hypothesis on the basis that the set of identified instruments and the residuals are uncorrelated. Therefore, when we fail to reject the null hypothesis, then will our estimates be robust implying that valid instruments were used. The study conducted additional robustness checks such as testing the significance of our interaction term; second-order serial correlation and the overall significance of the results (F-statistics or Wald test). We tested the significance of our interaction term by partially differentiating equation (1) with respect to financial inclusion to obtain the net effect of financial inclusion on inclusive growth. We specify the partial differential as follows:
where denotes average value of financial stability,
is the coefficient of the direct effect of financial inclusion, whereas
is the coefficient of the interaction term,
is the difference operator, igi is inclusive growth, and FII is financial inclusion.
3.2. Materials
The study employed a macro-data of 17 years spanning 2004–2020 for 40 African countries due to the availability of data. The inclusion of 40 African countries in the study was based on the availability of data regarding the main variables of interest, such as financial inclusion, financial stability, and inclusive growth, in these countries. Therefore, we chose to focus on those countries where sufficient data were accessible to ensure the reliability and accuracy of our analysis. The chosen time frame holds significant importance due to its alignment with critical global financial crises. Additionally, this time frame is particularly relevant as it coincides with the global surge in attention towards addressing the issue of financial inclusion (Siddik & Kabiraj, Citation2020). Moreover, it encompasses a period during which Africa dedicated substantial efforts towards bolstering financial inclusivity (Amatus & Alireza, Citation2015). We collected data from the World Bank database [World Development Indicators (WDI), Global Financial Development (GFD)] and Human Development Report Office (HDRO). The study used inclusive growth as the dependent variable which was measured using Human Development Index (HDI).
We used HDI because it is an index that captures equality, gender equality, education, health, income, and poverty alleviation (Ataey et al., Citation2020). As shown in Table , we source HDI from HDRO. Our variable of interest is the financial inclusion which was first proxied with financial inclusion index and later proxied with individual variables that were used to create the index. The former was created using principal component analysis (PCA) with five variables [ATMs per 100,000 adults; bank deposit (% GDP), credit allocated by banks and other financial institutions (%GDP), commercial bank branches per 100,000 adults, and bank branches per 100,000 adults]. After the index was created, we normalized it using minimum-maximum approach that helped our index to fall between 0 and 1. Although there are other variables that could be considered, data for variables have a lot of gaps for most countries in our sample, hence we focused on the aforementioned variables. The latter used the five individual variables in a separate regression to see their impact on HDI. All the variables were sourced from GFD.
Table 1. Variables and the sources of data
Our moderating variable is financial stability, on the grounds that regardless of the effort to make all financial services available to all populace, when the financial system is not stable, no one will be interested in patronizing the services in the financial system. We proxy financial stability with bank’s Z-score and was sourced from GFD. The study has four main covariates based on existing literature (see Manu et al., Citation2011; Fareed et al., Citation2017; Sethi & Acharya, Citation2018; Inoue Citation2019), availability of data, and characteristics of the Africa continent. The first two control variables (competition and non-performing loans) capture bank specific variables and the remaining two (trade and population) denote macroeconomic data. As shown in Table , we proxy competition with Boone indicator, whereas non-performing loans were proxied with bank non-performing loans to gross loans (%). African governments have strongly agreed to use trade liberalization to revitalize the region’s rural and urban areas. Therefore, it will be expedient to control for trade to see how it will enhance inclusiveness of growth. Additionally, with increasing population pressure, poverty remains a main major challenge in developing countries (Timothy et al., Citation2015), therefore we control for population growth proxied with population growth (annual %) to see how it will impact inclusive growth.
4. Empirical results and discussion
4.1. Descriptive summary and correlation matrix
As shown in Table (descriptive summary), the average inclusive growth score measured with HDI is 0.547 with its minimum value and maximum value of 0.285 and 0.807, respectively. By implication, the African sample is within medium range of HDI ranking. On country level, we find countries like Mauritius (0.77), Seychelles (0.76), and Libya (0.76) to have the highest HDI, whereas Chad (0.37) and Niger (0.35) have the least HDI (see Figure ).
Figure 1. In-country Human Development Index, 2004–2020.
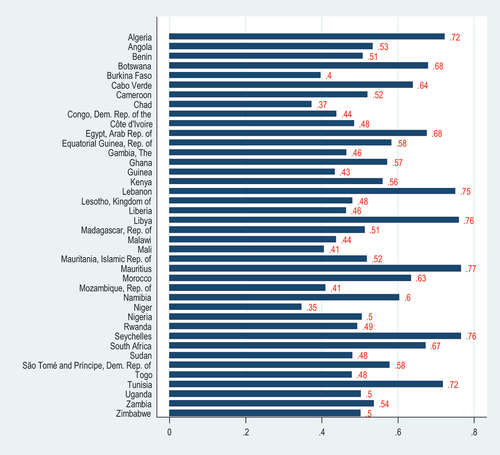
Table 2. Descriptive summary
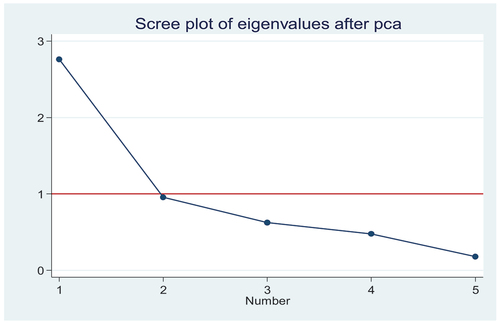
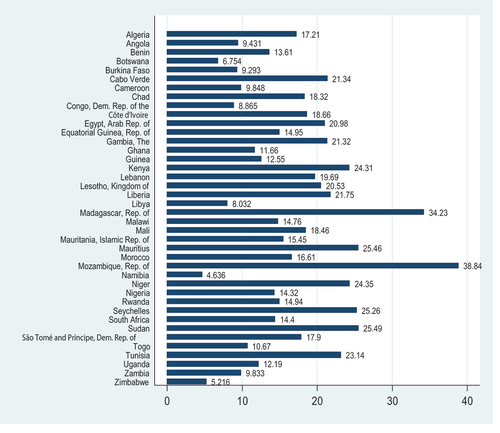
The study shows that the financial inclusion index proxied with normalized PCA output has a mean of 0.217. Seychelles (0.805) is the country in our sample that has the highest inclusive finance index, while D.R. Congo has limited data (see ). To confirm that our inclusive finance index is valid, we conducted a series of robustness checks such as Kaiser-Meyer-Olkin (KMO) test of sampling adequacy, number of eigenvalues and Bartlett test of sphericity. The eigenvalue of 2.762 which is higher than the rule of thumb of 1 means that our index is generated based on the first component which is 55% of the entire five variables (see , and Figure ). The KMO value of 0.689 is greater than the rule of thumb of 0.5, suggesting that the variables used in generating the index are adequate. Also, the index is robust because one of the assumptions of good index is that its variables should be interrelated. As indicated in Appendix (i.e., Table ), Bartlett test of sphericity’s chi-square and p-value of 999.637 and 0.000, respectively, provides a clue of how the variables are interrelated. Using a bank deposit (% GDP) and private credit as proxy for financial inclusion, we find that both variables have similar characteristics. In addition, we find ATMs per 100,000 adults to have higher average score (14.54%), whereas bank branches (8.02) have the lowest mean value. Averagely, our African sample’s financial stability scores 16.842% which means that on the range of 0 to 100%, our African sample is at the low range. In-country data reveal that Mozambique (38.84) financial system is stabilized, while Namibia (4.636) financial system is less stabilized (see Figure ).
Figure 2. In-country inclusive finance index, 2004–2020.
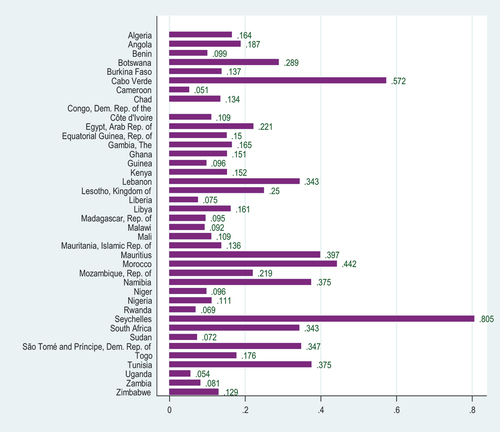
Figure 3. In-country bank’s Z-score, 2004–2020.
According to Table , African sample has low competition in the banking sector since Borne indicator as a proxy for competition has a negative mean value of 0.063, implying that the sample is in the low performing range. Additionally, we found that, on average, 7.9% of the gross loans of banks are ascribed as non-performing loans. This suggests that African sample is good in recovery loan, hence reducing the high level of non-performing loans because out of 100% loan giving to customers, only 7.9% was bad. Table reveals that trade liberalization of Africa is very high paying attention to its high mean value of about 75%. This is because on average, 75% GDP of our African sample is contributed by trade liberalization. This could help Africa in achieving AfCFTA and attract more foreign capital.
The correlation matrix suggests that while all the variables significantly correlate with inclusive growth, competition does not have any significant relationship with inclusive growth (see Table ). All the significant variables have positive relationship with inclusive growth except population. We also found that some of the predictors have a moderate relationship which may lead to multicollinearity. For instance, trade openness and commercial bank branches are correlated with a coefficient of 0.608. In the same vein, bank branches and trade openness are correlated (0.675). Since, this may lead to multicollinearity, we proceeded to test for multicollinearity using Variance Inflation Factor (VIF). As shown in Table , there is no presence of multicollinearity since VIF for each variable is less than 5 and average VIF is less than10.
4.2. Results of financial inclusion, financial stability and inclusive growth
In this section, our GMM estimates is based on equations (1) and (2) and are presented in Tables . We start with our first objective that is the effect of financial inclusion on inclusive growth (measured with HDI). The results from Table show that financial inclusion index, commercial bank branches, and bank branches significantly influence HDI. However, while financial inclusion index and commercial bank branches induce inclusive growth, bank branches dampen inclusive growth. Comparatively, we find the multidimensional financial inclusion to have a high coefficient of 2.0481. Financial inclusion has a significant positive effect on inclusive growth, indicating that when people are encouraged to save for the future, plan their spending, and manage financial risk (i.e., financial inclusion), it can promote inclusive growth by reducing poverty and inequality (Demirgüç-Kunt & Singer, Citation2017). In other words, as more people participate in the formal financial system, it contributes to poverty reduction, economic stability, improved education and healthcare, entrepreneurial growth, women empowerment, and enhanced resilience, all of which are fundamental aspects of the HDI. Our empirical findings corroborate with and provide robust support for some empirical studies despite different measure of (inclusive) growth (see Sulong & Bakar, Citation2018; Fareed et al., Citation2017; Sethi & Acharya, Citation2018; Inoue, Citation2019). These studies conclude that financial inclusion is a driving force towards economic growth and development.
Table 3. GMM results of financial inclusion and inclusive growth
Table 4. GMM results of the moderation role of financial stability on financial inclusion-inclusive growth nexus
We shift attention to our second objective which is determination of the moderation role of financial stability on the nexus between financial inclusion and inclusive growth. As presented in Table , we found that financial stability (proxied with Z-score) has a direct link with inclusive growth with the exception of when financial inclusion index was used as a proxy for financial inclusion (see Column 1 of Table ). However, when we interact financial stability with financial inclusion, we found that the interaction term has a link with inclusive growth. This motivated us to test for the significance level (magnitude of the impact) of the interaction following equation (3) in the previous section. This is applicable to the measure of financial inclusion which has a direct and indirect effect on inclusive growth. From the six proxies of financial inclusion, we find four (financial inclusion index, ATM, bank branches, and private credit) to be associated with the above characteristics, thus we computed their net effect, which is presented in Table . Although the net effect is applicable to ATM, bank branches, and private credit, the coefficient of their net effects was statistically insignificant. Hence, inferences were only made to financial inclusion index.
The presence of financial stability is important in boosting the positive effect of the financial inclusion index on HDI. Although in the presence of four proxies (i.e., financial inclusion index, ATM, bank branches, and private credit) of financial inclusion, financial stability matters and financial inclusion index provide better and significant results. The net effect of financial inclusion also implies that in the presence of confidence in the financial system, people will be willing to access the available financial services, which will help them to migrate from extreme poverty and inequality. Put differently, most citizens will patronize the services of the financial sector when no financial institution will collapse or no financial institution will run away with their savings, which will go a long way to reduce inequality and poverty in the continent. This indicates that in some Africa countries, despite efforts to promote financial inclusion, the prevalence of financial instability in many countries might hinder significant progress in achieving inclusive growth. As such, policymakers should prioritize addressing financial stability concerns as it acts as a catalyst for fostering financial inclusion and, in turn, amplifies the prospects of achieving more substantial inclusive growth in the region.
From our control variable, we find only a control variable (population) to influence the level of inclusive growth when financial inclusion index was a proxy for financial inclusion as shown in Table . However, when financial inclusion was measured with ATM, bank branches, private credit, commercial bank branches, and bank deposit, the controls had diverse effect on inclusive growth. Unlike population where it influences inclusive growth at all the levels, the results of the remaining control variables were significant for some levels (see Table ). For example, competition influences inclusive growth at only three instances instead of six. Additionally, non-performing loans dampen inclusive growth with the exception of when financial inclusion index was used as a proxy for financial inclusion. Starting with population, the results in Table show that increase in population growth of our Africa sample dampen inclusive growth in all levels as shown in Table . By implication when the population growth of Africa increases, it affects food and hampers equal distribution of resources which leads to hunger and poverty. The negative effect of population on inclusive growth implies that there is high pressure on limited public goods, which leads to poverty and inequality especially in the case of Africa (Timothy et al., Citation2015).
We examine the statistical implications of the computed coefficients in Tables for validity. We start with Arellano-Bond Autocorrelation (AR), while AR at order one [AR (1)] test suggests autocorrelation, AR at second order [AR (2)] test found that there is no serial correlation in our model. Hence, we made inferences with AR (2) since it takes priority over AR (1) (Tchamyou et al., Citation2019). Therefore, it can be said that since our AR (2) is insignificant, our model lacks serial correlation. Furthermore, the Hansen and Sargan over-identification constraints tests demonstrated a lack of correlation between the instruments and the disturbance term. Furthermore, our number of instruments is less than the number of groups (i.e., the countries used for the study), indicating that our results are robust. Our GMM results suggest that future inclusive growth can be influenced by current inclusive growth since the coefficient of the lag of inclusive growth is positive and statistically significant at 1%. Significant coefficient of the lag of inclusive growth satisfies one of requirement of GMM and also suggest that any effort made to enhance inclusive growth today will influence future inclusive growth positively.
5. Conclusion and implications
Africa has made significant efforts to achieve economic growth, but little emphasis has been placed on achieving inclusive growth, resulting in delay in achieving UN Agenda 2030 and African Agenda 2063. Recently, the continent has embarked on a number of financial system reforms in order to ensure the availability of services to its people. On this basis, we investigate the effect of financial inclusion on inclusive growth for 40 African countries using a macro-data of 17 years spanning 2004 to 2020. Regardless of whether the populace has access to all financial services, low confidence in the financial system may deter people from using financial services. As a result, we examine the moderating role of financial stability on the relationship between financial inclusion and inclusive growth. The results from the two-stage system GMM estimation showed that the multidimensional financial inclusion induces inclusive growth at a higher rate than the individual variables of financial inclusion. Furthermore, the study revealed that financial stability alone has a weak direct impact on inclusive growth. Lastly, our GMM results reveals that financial stability serve as a catalyst to induce financial inclusion index-inclusive growth nexus.
The article provides some practical implications based on the main results of the study. First, since we found that multidimensional inclusive finance enhances inclusive growth more than the individual indicator of inclusive finance, we propsose that policymakers should focus on attaining multidimensional inclusive finance agenda. For instance, instead of policymakers focusing on only efficient allocation of credit facilities, they should develop the various dimensions of financial product such as encouraging banks to have more ATMs at various places, more bank branches, mobilise more deposit, and among others. Additionally, we recommend that policymakers should use diverse means such as integration of ICT to improve upon financial inclusion. This can be achieved by easing the difficulties associated with the use of mobile money to access credit and make deposit. Lastly, since financial stability forms synergy with financial inclusion to induce inclusive growth, we propose that the regulators of banks should focus on enhancing the stability of the financial system. This can be attained if a separate unit or entity such as Financial Stability Authority is established with the exclusive oversight to oversee to the stability of the various aspects of financial systems.
Disclosure statement
No potential conflict of interest was reported by the author(s).
Data availability statement
The authors did not include the availability of data; however, it can be provided upon request.
References
- Abor, J. Y., Amidu, M., & Issahaku, H. (2018). Mobile telephony, financial inclusion and inclusive growth. Journal of African Business, 19(3), 430–19. https://doi.org/10.1080/15228916.2017.1419332
- Alemu, G. (2016). Financial inclusion, regulation and inclusive growth in Ethiopia. In Achieving Financial Stability and Growth in Africa (pp. 137–157). Routledge.
- Ali, I., & Son, H. H. (2007). Measuring Inclusive Growth. Asian Development Review, 24(1), 11–31. https://doi.org/10.1142/S0116110507000024
- Amatus, H., & Alireza, N. (2015). Financial inclusion and financial stability in Sub-Saharan Africa (Ssa). International Journal of Social Sciences, 36(1), 2305–4557.
- Anand, R., Mishra, S., & Peiris, S. J. (2013). Inclusive Growth: Measurement and Determinants. IMF Working Papers, 13(135), 1. https://doi.org/10.5089/9781484323212.001
- Andrianaivo, M., & Kpodar, K. (2011). ICT, financial inclusion, and growth: Evidence from African countries. International Monetary Fund.
- Anyanwu, J. C. (2013). Determining the Correlates of Poverty for Inclusive Growth in Africa (181). Working Paper Series.
- Arestis, P., Demetriades, P. O., & Luintel, K. B. (2001). Financial development and economic growth: The role of stock markets. Journal of Money, Credit and Banking, 33(1), 16–41. https://doi.org/10.2307/2673870
- Ataey, A., Jafarvand, E., Adham, D., & Moradi-Asl, E. (2020). The relationship between obesity, overweight, and the human development index in world health organization eastern Mediterranean region countries. Journal of Preventive Medicine and Public Health, 53(2), 98. https://doi.org/10.3961/jpmph.19.100
- Ayyagari, M., Demirguc-Kunt, A., & Maksimovic, V. (2014). Who creates jobs in developing countries? Small Business Economics, 43(1), 75–99. https://doi.org/10.1007/s11187-014-9549-5
- Barajas, M. A., Chami, M. R., & Yousefi, M. R. (2013). The finance and growth nexus re-examined: Do all countries benefit equally?. International Monetary Fund.
- Bhattarai, K. (2015). Financial deepening and economic growth in advanced and emerging economies. Review of Development Economics, 19(1), 178–195. https://doi.org/10.1111/rode.12133
- Boachie, R., Aawaar, G., & Domeher, D. (2023). Relationship between financial inclusion, banking stability and economic growth: A dynamic panel approach. JEAS, 39(3), 655–670. https://doi.org/10.1108/JEAS-05-2021-0084
- Cheang, N. (2004). Financial stability and economic growth of Macao. AMCM Quarterly Bulletin, 11, 67–87.
- Che, Y., Lu, Y., Tao, Z., & Wang, P. (2013). The impact of income on democracy revisited. Journal of Comparative Economics, 41(1), 159–169. https://doi.org/10.1016/j.jce.2012.05.006
- Cournède, B., Denk, O., & Hoeller, P. (2015). Finance and inclusive growth. SSRN Electronic Journal. https://doi.org/10.2139/ssrn.2649801
- Cumming, D., Johan, S., & Zhang, M. (2014). The economic impact of entrepreneurship: Comparing international datasets. Corporate Governance an International Review, 22(2), 162–178. https://doi.org/10.1111/corg.12058
- Demirgüç-Kunt, A., & Singer, D. (2017). Financial inclusion and inclusive growth: A review of recent empirical evidence. World Bank Policy Research Working Paper, (8040).
- Dollar, D., & Kraay, A. (2002). Journal of Economic Growth, 7(3), 195–225. https://doi.org/10.1023/A:1020139631000
- European Central Bank.(2023). Financial stability. European Central Bank, Frankfurt am Main. Retrieved from: https://www.ecb.europa.eu/pub/financial-stability/html/index.en.html (accessed 05 Feburary, 2023).
- Fareed, F., Gabriel, M., Lenain, P., Reynaud, J., Sand, I. C., Izquierdo Gómez, M. M., & Lange, R. A. (2017). β-blockers, cocaine, and the Unopposed α-Stimulation Phenomenon. Journal of Cardiovascular Pharmacology and Therapeutics, 22(3), 239–249. https://doi.org/10.1177/1074248416681644
- Greenwood, J., & Jovanovic, B. (1990). Financial development, growth, and the distribution of income. Journal of Political Economy, 98(5).
- Gurley, J. G., & Shaw, E. S. (1955). Financial aspects of economic development. The American Economic Review, 45, 515–538. http://www.jstor.org/stable/1811632
- Henry, A. S., Murray, E. (2023).What to Know About Gabon’s Coup. United State Institute of Peace. https://www.usip.org/publications/2023/08/what-know-about-gabons-coup
- Inoue T. (2019). Financial inclusion and poverty reduction in India. Journal of Financial Economic Policy, 11(1), 21–33. https://doi.org/10.1108/JFEP-01-2018-0012
- Inoue, T, & Hamori, S. (2016). Financial Access and Economic Growth: Evidence from Sub-Saharan Africa. Emerging Markets Finance and Trade, 52(3), 743–753. https://doi.org/10.1080/1540496X.2016.1116282
- Kim, J. H. (2016). A study on the effect of financial inclusion on the relationship between income inequality and economic growth. Emerging Markets Finance and Trade, 52(2), 498–512. https://doi.org/10.1080/1540496X.2016.1110467
- Kim, M., Zoo, H., Lee, H., & Kang, J. (2017). Mobile, financial inclusion and development: A critical review of academic literature. https://aisel.aisnet.org/globdev2017/4
- Klasen, S. (2010). Measuring and monitoring inclusive growth: Multiple definitions, open questions, and some constructive proposals (ADB Sustainable Development Working Paper Series).
- Manu, L. P., Adjasi, C. K., Abor, J., & Harvey, S. K. (2011). Financial stability and economic growth: A cross-country study. International Journal of Financial Services Management, 5(2), 121–138. https://doi.org/10.1504/IJFSM.2011.041920
- Mckinnon, R. I. (1973). Money and capital in economic development. Brookings Institution.
- Naceur, S. B., & Ghazouani, S. (2007). Stock markets, banks, and economic growth: Empirical evidence from the MENA region. Research in International Business and Finance, 21(2), 297–315. https://doi.org/10.1016/j.ribaf.2006.05.002
- Natamba, B., Peter, M., & Nakabuye Zulaika, B. (2013). Transaction costs and outreach of microfinance institutions in Uganda. Business Management and Economics, 1, 125–132. http://www.journalissues.org/IBME/
- Oduola, M., Bello, M. O., & Popoola, R. (2022). Foreign direct investment, institution and industrialisation in Sub-Saharan Africa. Economic Change and Restructuring, 55(2), 577–606. https://doi.org/10.1007/s10644-021-09322-y
- Ofori, I. K., & Asongu, S. (2021). Foreign direct investment, governance and inclusive growth in sub-saharan Africa. SSRN Electronic Journal. https://doi.org/10.2139/ssrn.3861549
- Ofori, I. K., & Asongu, S. (2022). Repackaging FDI for inclusive growth: Nullifying effects and policy relevant thresholds of governance. European xtramile centre of African studies WP/22/003. SSRN Electronic Journal. https://doi.org/10.2139/ssrn.3999095
- Ofori, I. K., & Asongu, S. A. (2021). ICT diffusion, foreign direct investment and inclusive growth in Sub-Saharan Africa. Telematics and Informatics, 65, 101718. https://doi.org/10.1016/j.tele.2021.101718
- Park, C. Y., & Mercado, R. (2015). Financial inclusion, poverty, and income inequality in developing Asia. Asian Development Bank Economics Working Paper Series, (426). https://doi.org/10.2139/ssrn.2558936
- Pearce, D. (2011). Financial inclusion in the Middle East and North Africa: Analysis and roadmap recommendations. World Bank Policy Research Working Paper, 5610. Available at SSRN https://ssrn.com/abstract=1794915
- Pradhan, R. P., Arvin, M. B., Nair, M. S., Hall, J. H., & Bennett, S. E. (2021). Sustainable economic development in India: The dynamics between financial inclusion, ICT development, and economic growth. Technological Forecasting and Social Change, 169, 120758. https://doi.org/10.1016/j.techfore.2021.120758
- Ramos, R. A., Ranieri, R., & Lammens, J.-W. (2013). Mapping Inclusive Growth,105.
- Rasheed, B., Law, S. H., Chin, L., & Habibullah, M. S. (2016). The role of financial inclusion in financial development: International evidence. Abasyn University Journal of Social Sciences, 9(2), 330–348.
- Robinson, J. (1952) The rate of interest and other essays. MacMillan.
- Roodman, D. (2009). How to do xtabond2: An introduction to difference and system GMM in Stata. The Stata Journal, 9(1), 86–136. https://doi.org/10.1177/1536867X0900900106
- Schinasi, Garry J., Defining Financial Stability (October 2004). IMF Working Paper No. 04/187, Available at SSRN: https://ssrn.com/abstract=879012
- Schumpeter, J. (1911). The theory of economic development. Harvard University Press.
- Sethi, D., & Acharya, D. (2018). Financial inclusion and economic growth linkage: Some cross country evidence. Journal of Financial Economic Policy, 10(3), 369–385. https://doi.org/10.1108/JFEP-11-2016-0073
- Sharma, D. (2016). Nexus between financial inclusion and economic growth: Evidence from the emerging Indian economy. Journal of Financial Economic Policy, 8(1), 13–36. https://doi.org/10.1108/JFEP-01-2015-0004
- Shaw, E. (1973). Financial deepening in economic development. Oxford University Press.
- Siddik, M. N. A., & Kabiraj, S. (2020). Digital Finance for Financial Inclusion and Inclusive Growth. In Babu, G. & Justin, P. (Eds.), Digital Transformation in Business and Society (pp. 155–168). Palgrave Macmillan. https://doi.org/10.1007/978-3-030-08277-2_10
- Sulong, Z., & Bakar, H. O. (2018). The role of financial inclusion on economic growth: Theoretical and empirical literature review analysis. Journal of Business & Financial Affairs, 7, 2167–2234. https://doi.org/10.4172/2167-0234.1000356
- Tchamyou, V. S., Asongu, S. A., & Odhiambo, N. M. (2019). The role of ICT in modulating the effect of education and lifelong learning on income inequality and economic growth in Africa. African Development Review, 31(3), 261–274. https://doi.org/10.1111/1467-8268.12388
- Timothy, M., Khazamula, C. P., Francis, A., Tichaona, K. P., Nelson, R. E., & Aluwani, M. (2015). Comparative impact of public expenditure on agricultural growth: Error correction model for South Africa and Zimbabwe. Journal of Human Ecology, 50(3), 245–251. https://doi.org/10.1080/09709274.2015.11906881
- Van, L. T. H., Vo, A. T., Nguyen, N. T., & Vo, D. H. (2019). Financial inclusion and economic growth: An international evidence. Emerging Markets Finance and Trade, 57(1), 239–263. https://doi.org/10.1080/1540496X.2019.1697672
- World Bank. (2020). Monitoring global poverty. https://doi.org/10.1596/978-1-4648-1602-4_ch1
- World Bank. (2022. March 29). Financial inclusion overview. Retrieved from https://www.worldbank.org/en/topic/financialinclusion/overview#1
Appendices
Table A1. Level of persistence
Table A2. Principal component and eigenvalues for financial inclusion index
Table A3. Contribution of each variable to a components
Table A4. Sampling adequacy and sphericity
Table A5. Pairwise correlation matrix
Table A6. Variance inflation factor
Figure A1. Scree plot for the eigenvalues.