?Mathematical formulae have been encoded as MathML and are displayed in this HTML version using MathJax in order to improve their display. Uncheck the box to turn MathJax off. This feature requires Javascript. Click on a formula to zoom.
Abstract
In SSA, evidence is scanty on the association between greenhouse gas emissions and food security, though the region is highly vulnerable to climate change. Thus, this study has examined the effects of greenhouse gas emissions on food security in 22 SSA countries for the period 2005–2018. We employed a one-step system GMM to control for endogeneity and individual heterogeneity problems. The GMM was also an efficient estimator for a dynamic panel data model. Results of the study revealed that most SSA countries are in the vicious circle of food insecurity, with very limited improvement over the study period. In addition, the GMM result found that the accumulation of greenhouse gases has significantly contributed to reduction of food security in SSA. Greenhouse gas emissions have a negative and statistically significant effect on food security. A 1% increase in greenhouse gas emissions has resulted in a 1.2% decrease in food security. However, livestock production, agricultural employment, and economic growth have improved food security, though livestock production and economic growth have very low significant coefficients. Therefore, the study recommends that the region should devote an immense effort to boost food security through combating greenhouse gas emissions and achieving the net-zero emission target of SDG 13 on climate change. Policy makers and governments should also consider policy interventions like providing funding to assist green projects and sustainable agricultural practices to reduce the negative effects of climate change.
1. Introduction
The adverse effect of climate change on agricultural productivity and food security in middle- and low-income economies is an emerging issue in policy debates. Climate change affects various dimensions of livelihood, which include food security, environment, health, and productivity (Adesete et al., Citation2022). Climate change and its variability are significant drivers of global food insecurity (Fanzo et al., Citation2018). Therefore, addressing climate change has become important for ensuring sustainable agriculture and food security in emerging economies (Wijerathna-Yapa & Pathirana, Citation2022). It is obvious that food is the basic thing that everybody needs for a healthy life. The concern is not just an extraordinary want in our lives; rather, it is a survival issue so that food security will come behind. However, it is achieved “when all people, at all times, have physical and economic access to sufficient, safe, and nutritious food that meets their dietary needs and food preferences for an active and healthy life” (WFS, Citation1996).
Literature demonstrates that food security has four major components, which includes; availability, access, utilization, and stability (Bank, Citation2012). Availability refers to having a balanced food supply and trade, not only in quantity but also having enough quality and variety of food (Peng & Berry, Citation2018). It shows whether there exists a stock of food by any means, including domestic production, imports, or food aid programs (Kumar et al., Citation2015). Access covers being economically and financially strong to get the required meals either through production or purchase from markets (FAO, Citation2017). Whereas stability and utilization consist whether there is a stable capacity to pass shocks and the degree of diversity of nutrients in one’s food system, respectively (FAO, Citation2017).
However, achieving all four pillars of food security is challenged by environmental problems (Adesete et al., Citation2022), and institutional factors (Ogunniyi et al., Citation2020; Woertz, Citation2017). Thus, a stable climate is among the critical factors that result in better agricultural productivity and thereby improve food security (Demeke et al., Citation2011; Islam et al., Citation2021). However, currently, the world is far from achieving many environmental and climate resilience goals due to greenhouse gas emissions, deforestation, land degradation, and the exploitation of natural resources (McGuire, Citation2015). The prospect of climate change is becoming worse. A report by the IPCC (Citation2021) indicates that the temperature will rise by more than 2°C over the coming two decades.
Similarly, African countries are struggling with climate change and costing their agricultural sector an estimated 0.13% to 2% of the national GDP (Mogess & Ayen, Citation2023). The effect of climate change on food security is severe in SSA, as farm households in the region are more vulnerable to several environmental problems such as soil degradation, deforestation, and smoke from fossil fuel energy consumption (Adesete et al., Citation2022; Affoh et al., Citation2022; Edoja et al., Citation2016). SSA is known for its large dependency on rain-fed agriculture and for always waiting for rainfall, clouds in the sky, and moisture for farming activities (Connolly-Boutin & Smit, Citation2016). According to the IPCC’s sixth assessment report, adaptation and mitigation practices in SSA are inefficient because most of the smallholder farmers live in subsistence and backward agriculture. Farmers cannot afford the advanced technologies, agricultural credits are minimal, and insurance and well-functioning markets are not available for risky farming activities (IPCC, Citation2021).
Climate change is putting enormous pressure on scarce natural and environmental resources in the region. Forest resources, land, water, air, biodiversity, and ecosystem services are facing formidable challenges to the extent that food insecurity, the prevalence of undernourishment, malnutrition, frequent maternal death, and dietary deficiency are its permanent features (Adesete et al., Citation2022). According to Zhang et al. (Citation2023), 282 million people, or 20% of the population in Africa south of the Sahara, were undernourished and food insecure in 2021. Climate change, conflict, economic downturns, and high food import bills are major factors behind this severe food insecurity (Zhang et al., Citation2023). Hence, among others, climate change is imposing serious threats to the agricultural production system and food security for the world’s most vulnerable people. It is therefore essential to look for the detrimental state of the climate change-food security link in the region to thrive under appropriate mitigation policies. Understanding how the detrimental effect will be severe in economies that are vulnerable to food insecurity is critical for the implementation of adequate environmental and food security policies (Saina et al., Citation2013).
The study at hand has examined the nexus between climate change and food security for selected SSA countries, using greenhouse gas emissions as a proxy for climate change (Adesete et al., Citation2022; Kumar et al., Citation2015). The primary goal of the paper was to construct a regional food security index that consists of all four major components (availability, access, stability, and utilization) and conduct an empirical examination of the association between greenhouse gas emissions and the food security index. We specifically investigated the detrimental effect of climate change and the implications of socioeconomic factors (agricultural employment, livestock production, inflation, agricultural subsidies, the growth rate of real GDP, and cropland shares) on the food security index we constructed. We employed dynamic panel data for 22 SSA countries, covering the period 2005–2018. Data have been obtained from different sources. Food security components were sourced from the FAO database (FAOSTAT), and all the explanatory variables were taken from the World Development Index (WDI) data base. The study contributes to the body of literature in several ways. First, it brings a more complete understanding of the elements to be incorporated in the food security index and the ways in which it is constructed. For example, several existing studies didn’t consider the utilization component as a food security indicator. Hence, analysis based on only a few indicators might be unrealistic to support evidence for the climate change-food security link. Furthermore, it is essential to generate regional food security index, and to the authors’ knowledge, this is the first study. Therefore, we produced a food security index for 22 SSA countries for the time span (2005–2018). This analysis would be useful to identify which countries are more food-secure than others. Second, its methodological advancement: By employing a system GMM (Generalized Method of Moments) analysis, the research contributes to the methodological toolbox used to analyze panel data with potential endogeneity issues. The use of advanced econometric techniques enhances the rigor of the study and sets a precedent for future research in the field. GMM analyses provide more detailed empirical investigation, variability, and efficiency (Roodman, Citation2009).
The last one is its regional relevance. Sub-Saharan Africa is particularly vulnerable to the impacts of climate change, and food security is a central concern for many countries in the region. By focusing on this specific region, the research directly addresses the unique challenges faced by countries in Sub-Saharan Africa, contributing to region-specific knowledge. This can help to achieve several SDGs, including SDG 2 (Zero Hunger) and SDG 13 (Climate Action), by informing relevant stakeholders about how climate change is affecting the region. Understanding the potential trade-offs and synergies between these two dimensions can help design more effective and integrated policies that promote sustainable development.
The remainder of the paper is organized as follows: A review of the literature on the climate change-food security link is presented in Section 2. The conceptual and empirical frameworks are presented in Section 3. Section 4 delves into the discussion of the findings and results. Finally, section 5 concludes.
2. Literature review
Climate change has ample negative impacts on food security, such as disrupting global food production and supply chains, reducing dietary diversity, and resulting in malnutrition (Adesete et al., Citation2022; Edoja et al., Citation2016; Hassan & Tularam, Citation2018; Kumar et al., Citation2015). Changes in temperature and precipitation patterns can lead to reduced agricultural productivity in certain regions, affecting the availability and affordability of food (Demeke et al., Citation2011; Islam et al., Citation2021). Furthermore, it leads to food price volatility, food shortages, and increased vulnerability to food insecurity, particularly in regions heavily reliant on agriculture for livelihoods and food provision (Affoh et al., Citation2022; Dagar et al., Citation2021; Delazeri et al., Citation2021).
A dynamic panel data analysis for 30 countries in SSA for the period spanning 2000–2019 by Adesete et al. (Citation2022) found that climate change would lead to a reduction in agricultural productivity and an increase in the prevalence of malnutrition. Their system-generalized method of moments (GMM) estimation has further revealed that the reduction in carbon emissions is predicted to enhance agricultural supply and production, reduce malnutrition prevalence, and promote food security. As a result, their report suggests that the SSA region should be more committed in its efforts to achieve zero net emissions.
Similarly, Ebi and Loladze (Citation2019), found that elevated atmospheric CO2 concentrations and climate change will affect the quality and quantity of our food. According to them, greenhouse gas emissions affect the quantity and quality of our food in two ways. First, they are drivers of anthropogenic climate change to the extent that it will be the reason for declining the yield of large cereals in some regions. Increased temperature, changes in precipitation patterns, increased ozone concentration, flooding, and drought can reduce crop yields, especially in the tropics, with growing risks of additional heating. Then, lower crop yields lead to an increase in shrinkage and waste in low- and middle-income countries. Second, increased concentrations of carbon dioxide (CO2) have a direct impact on plants by increasing the harmful nutritional quality of food by reducing the concentration of proteins and minerals up to 5–15% and up to 30% of vitamin B. The study emphasized that undernutrition is the greatest health risk of increasing greenhouse gas concentrations and climate change.
Another study was conducted by Islam et al. (Citation2021) using an ARDL approach to examine the effects of carbon emissions, rainfall, temperature, inflation, population, and unemployment on economic growth in Saudi Arabia. Their study found that there is a long-run negative relationship between one of the components of greenhouse gases, carbon emissions, and economic growth, and this will probably be true for carbon emissions and food security since economic growth is one indicator of food security. i.e., lower levels of GDP due to carbon emissions result in food insecurity (Swietlik, Citation2018; Torero, Citation2014; WHO, Citation2019).
A study by Kumar et al. (Citation2015), entitled “Carbon emissions and food security”, analyzed 31 countries with a panel cross-country analysis. They constructed a composite index from several food security indicators to generate the global food security index (GFSI) as a proxy for the general concept of food security. The study investigated the relationship between carbon emissions and three food security components (food availability, access, and stability). It has found a significant negative relationship between per capita carbon emissions and those components of food security. The finding is further emphasized as especially middle- and lower-middle-income countries need immense effort to work on alternative scientific techniques to abate the greenhouse gas effect and halt food insecurity.
An investigation by Affoh et al. (Citation2022) on the association between climate variables and food security in 25 SSA countries between 1985 and 2018 using panel autoregressive distributed lag discovered that rainfall had a positive and large long-run effect on access to food, food availability, and food utilization. Temperature, on the other hand, has a detrimental impact on food access and availability while having no effect on food utilization. In the short run, they discovered a causal association between food availability and CO2 emissions using fully modified ordinary least squares (FMOLS) and dynamic ordinary least squares (DOLS). In addition to these, their findings demonstrated that food utilization was substantially related to temperature, but the relationship with food accessibility was more visible. They suggested for governments in the region subsidize farmers and promote agricultural facilities.
Finally, a very recent cross-sectional study by Khan et al. (Citation2023) has investigated factors that affect food security in rural Pakistan. Their study explored that agricultural productivity lag, climate change, and exploitation of the environment had a negative impact on household food security. They are the major factors behind the hunger in the study area. According to them, designing a policy based on taking all these stylized facts into consideration is a timely approach.
3. Research method and data
In this section, we discussed the conceptual and econometric estimation strategies for estimating the effect of climate change on food security.
3.1. Generating food security index
In the existing body of literature, there are several ways of generating food security indexes. Kumar et al. (Citation2015) estimated country-wise food security index using the composite Z-index technique for an empirical analysis of the carbon emission-food security link for 31 selected countries in the world. They were used to aggregate food availability, food access, and food stability components. In Nigeria, the FSI is estimated using the actual nutrients consumed in a given food component (Ibrahim et al., Citation2009). Demeke et al. (Citation2011) generated a food security index in Ethiopia through principal component analysis to estimate the food security implications of human, social, physical, financial, and natural capital. The Economist Intelligence Unit (EIU) uses a composite Z-index to generate a global food security index (GFSI) for its four dimensions of food security (availability, access, stability, and safety and quality) (EIU, Citation2012, 2013, 2014, Citation2015,2016, 2017,2018,2019).
Affoh et al. (Citation2022) measured food security index by using different proxies for three food security dimensions incorporated in their study of the effect of climate change on food security in SSA during 1985–2018. Food availability is measured by cereal yield (CY), food accessibility is measured by agriculture gross domestic product (GDPA), and food utilization is determined by the Cereal Dietary Energy Supply (CDES). Similarly, Adesete et al. (Citation2022) measured food security through parallel proxies in their study of the nexus between climate change and food security in SSA. They used the inverse of the prevalence of malnourishment rate (100-PRM) as a proxy for food security, and food supply (FS) is measured by food production (FPRD). However, the use of proxies may be unrealistic to give a strong justification for the implications of climate change on food security, which consists of broad dimensions (availability, access, stability, and utilization). Hence, in this study, we employed the composite Z-index to generate the food security index, which consisted of all food security components for 22 SSA countries in the time span of 2005–2018. By adopting the techniques in the Economist Intelligence Unit (EIU), Kumar et al. (Citation2015), the Composite Z-index is estimated as:
Where CI is an index, Min(x) and Max(x) are the lowest and highest values in each series of data across countries for a specific variable, respectively; i indicates the ith variable. However, if the variable is negatively associated with food security, the normalization equation becomes:
In equations (1 and 2), all values are transformed into a positive number on a scale of 0–1, to make a direct comparison with each other (EIU, Citation2012, Citation2015). Then the final FSI for a particular country can be estimated using three approaches. They are simple arithmetic means, Shannon entropy, and geometric means. However, this paper delves only into the latter two approaches since the former has the problem of compensating the low-performing indicator with the better-performing indicator (Chand et al., Citation2015). The Shannon entropy FSI is determined after the following procedures: Normalization of the component index is given as:
Then the entropy is given by:
Where the constant entropy is given by
Using equation (5) we will derive the weight for the given components as,
After we make sure that, the sum of all weights is equal to 1, the composite food security index across countries will be computed as;
Where “DI” refers to the index of the dimensions such as availability index (), access index (
), stability index (
), and utilization index (
); “j” is the jth component or dimension; “m”, number of countries; “c” a specific country; “k”, number of dimensions and “t” is the time for the observed entities.
In our second approach, FSI by geometric mean is calculated as:
Where is the food security index for a given country relative to others; and the FSI value lies between 0 to 1; 1 (one) indicates the most food-secure country and 0 (zero) represents the highest food insecure country;
is the availability index;
is the index for the access component;
is stability index; and
is utilization index; c is a particular country, and t is the given period of study (2005–2018).
3.2. Data and variables
3.2.1. Study area
The study area is limited to 22 selected SSA countries. These economies are preferred purposefully; they are for information and data availability reasons. Sub-Saharan Africa is part of the African continent south of the Sahara Desert. It occupies most of the African land. Sub-Saharan Africa has many geographical features, including the Sahel region, savannas, arid plains, and tropical rainforests. It also includes the highest rivers and largest lakes on the continent. However, we took only the aforementioned countries for the sake of data consistency.
3.2.2. Data source
Variables used as indicators for each dimension of food security were adopted from FOSTAT, the Food and Agriculture Organization of the United Nations (FAO) statistical database. According to the organization, there are 32 food security indicators developed to date, and from these, availability and stability components have six indicators for each, access has eight indicators, and utilization consists of 12 indicators. However, the study had to refrain from taking some indicators due to an inability to get the required data. Greenhouse gas emissions and data for control variables were collected from the World Development Index (WDI) statistical data base.
3.2.3. Measurement and description
The aforementioned indicators of food security under Table have been selected because they were used by existing literature such as Izraelov and Silber (Citation2019); EIU (Citation2019); and Jones et al. (Citation2013). We used greenhouse gas emissions as a proxy for climate change, as employed by Adesete et al. (Citation2022) for the investigation of climate change and food security in selected SSA countries and by Affoh et al. (Citation2022) for the examination of the implications of climate change variables on food security in SSA. Furthermore, the study also used several control variables. The livestock production index was used as it was applied by Boka (Citation2020) to the examination of the role of livestock in dietary diversity. The inflation rate and growth rate of real GDP are selected as they were used by Adesete et al. (Citation2022) and Affoh et al. (Citation2022). Agricultural employment, subsidies, and shares of cropland were employed here because they were employed by Kumar et al. (Citation2015) in the analysis of carbon emissions and food security.
Table 1. Summary of indicators to construct FSI
3.3. Empirical estimation
3.3.1. Dynamic panel data Model
As the specified model in equation (8) below, we have an estimator that is suitable for situations of (1) “small T, large N” panels, meaning few periods and many cross-sections (we have 14 years and 22 countries in our case), (2) a linear functional relationship, and (3) a dynamic effect, i.e., if the variable depends on its past realizations. Furthermore, (4) if there are independent variables that are not strictly exogenous, that means they are correlated with past and possibly current realizations of the error term; (5) fixed individual effects; and (6) heteroskedasticity and autocorrelation problems within individuals but not across them. There are two types of GMM estimators: Arellano-Bond (Arellano & Bond, Citation1991) difference GMM and Arellano-Bover/Blundell-Bond (Arellano & Bover, Citation1995; Blundell & Bond, Citation1998) system GMM estimators. The general model for a GMM estimator in a dynamic panel data model is constructed as follows:
Where;
FSI is the estimated food security index for cross country; , is the lagged dependent variable of the food security index. While lnGHG, gGDP, lnempt, inf, livestockpi, lnassis, and scrl, are greenhouse gas emissions, growth rate of real GDP, employment in agriculture, inflation rate, livestock production index, financial subsidy for agriculture, and share of cropland respectively. The prefix ln refers for natural logarithms.
The Difference GMM approach solves the endogeneity issues due to the potential endogenous variables, and problems arise from the fixed effect relationship through first differencing. However, this transformation has several limitations. Though the fixed effects are gone with differencing, there is a chance for the lagged dependent variable to be still endogenous because there is a correlation with the lag of the disturbance term. Likewise, any predetermined variables that are not strictly exogenous become potentially endogenous because they too may be related to the lag of the disturbance term. As a result, System GMM is introduced by (Blundell & Bond, Citation1998), and (Arellano & Bover, Citation1995), which is based on an additional assumption that the first differences of instrument variables are uncorrelated with the fixed effects. The System GMM approach corrects endogeneity by introducing more instruments for any endogenous variable to improve robustness. Hence, as system GMM allows the application of more valid instruments and dramatically improves the efficiency of the estimator (Roodman, Citation2009), we preferred it for this study.
3.3.2. Selection between one-step and two-step System GMM
In Monte Carlo simulation, it has been suggested that the estimated asymptotic standard errors of an efficient two-step generalized method of moments (GMM) estimator are extremely vulnerable to downward biased problems in small sample sizes (Arellano & Bond, Citation1991; Roodman, Citation2009). Instead, they further suggested one-step GMM estimators of asymptotic errors are unbiased and preferred for such a case. In our case, we have 22 countries, a very small sample size. Hence, we used a one-step system GMM estimation to take into account the given concerns under a two-step system GMM.
4. Result and discussion
4.1. Descriptive analysis
In this section, we discussed the features of both variables (greenhouse gas emissions and food security) in the region over the study period with the help of graphical and tabular analyses.
4.1.1. Greenhouse gas emissions trend in SSA
Figure shows that average greenhouse gas emission is increasing in SSA, though efforts have been made to achieve a net-zero emission target by 2030 as per SDG 13 on climate change. In 2010, the average greenhouse gas emission of the region for countries considered in the study increased by 10.87% compared to the emission level during 2005, and in 2018, it rose to 12.92%. On average, it has an emission level of 0.1 kiloton per year. If it continues at this pace, it would be impossible to address climate change goals and achieve a net-zero carbon emission economy. Under Figure , we plot the volume of greenhouse gas emissions across the SSA countries considered in the study. South Africa is the largest emitter, and on average, it has an accumulated emission level of 521,047.122 kilotons of CO2 equivalent greenhouse gas. This is due to the fact that South Africa is the most industrialized country in SSA, which confirms the presence of impactful industries (Adesete et al., Citation2022).
Figure 1. Average greenhouse gas emission in SSA.
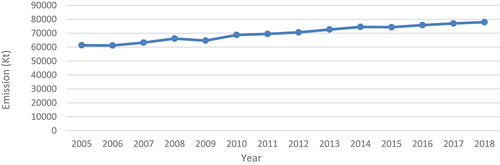
Figure 2. Country level average greenhouse gas emission (study countries).
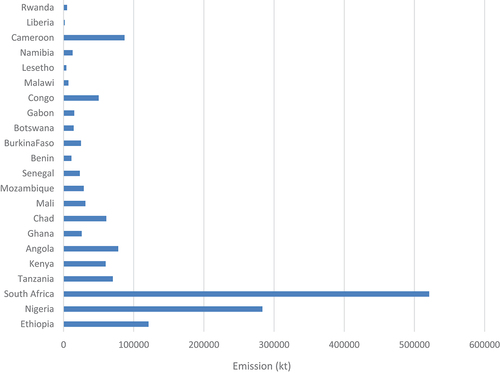
Nigeria is the second-largest emitter in the region, and it is because the country has the largest share of petrol oil in SSA as their major economic resource (Elwerfelli & Benhin, Citation2018). Its average emission level has reached 283,367.6058 kilotons of CO2-equivalent greenhouse gas. The third country that emits the third-largest share is Ethiopia. On average, Ethiopia has emitted and accumulated 121,086.3113 kilotons of CO2-equivalent greenhouse gas. This emission level in Ethiopia is due to large deforestation and the use of fossil fuels and biomass as the primary sources of energy (Oostdijk, Citation2021).
4.1.2. Sense of the constructed food security index (FSI) for cross country
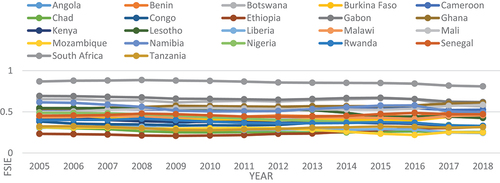
The study employed graphical and tabular methods to show and compare food security trends across regions in the study areas: central and east, south, and west African countries. Since the Shannon entropy and geometric mean composite indexes generated have shown consistent trends in food security conditions (appendices 2 and 3), the discussion is based on the Shannon entropy composite index. In east and central Africa, food security is converging over the study period. While it is worsening for Kenya, Rwanda, and the Congo, it is becoming better for Ethiopia but remains the same for Tanzania. Similarly, food security indices are converging to a similar score for most Southern African countries, with the highest index for South Africa and the lowest for Mozambique. However, in Western African countries, food security indices are diverging, with improved food security in Gabon, Ghana, and Mali but deteriorating in Liberia and Chad (see Figures ).
Figure 3. FSI pattern for central and Eastern African countries together.
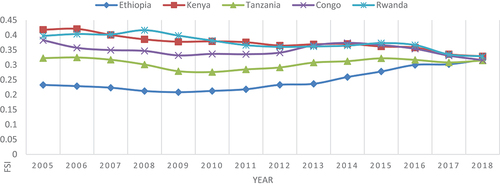
Figure 4. FSI pattern for Southern African countries.
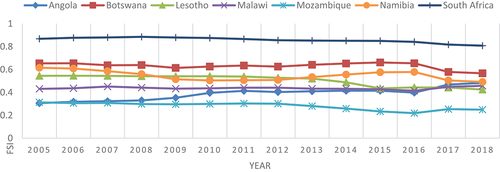
Figure 5. FSI pattern for Western African countries.
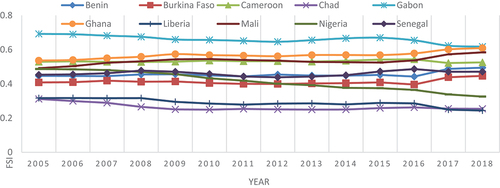
In general, countries located in southern Africa, like South Africa and Botswana, and Gabon and Ghana from western Africa are relatively showing better performance in food security, whereas countries in eastern and central Africa are performing poorly. Thus, food security problems vary across regions and countries in the SSA.
4.1.3. Ranking food security index and linking to their indicators
Since food security scores do not show large changes annually, the study tried to rank the food security status of countries based on the movements of estimated scores every five years. i.e., 2005, 2010, 2015, and 2018 (see Table ). Accordingly, the Shannon entropy composite index score indicates that South Africa and Gabon were ranked first and second, respectively, during the whole study period. Botswana stood third in 2005, 2010, and 2015, but failed to reach the 5th rank in 2018 as the 3rd place was overtaken by Ghana. The two highest economies, namely, South Africa and Gabon, have no significant change in their scores, but they stayed in the same rank, and this is because other economies have no visible improvement, which can override these two countries. Their promising performance in the food security index is largely attributable to their status as better-income economies (the two largest economies in per-capita income in the study area, as the data reveals). Both have a good share of land equipped for irrigation and relatively good infrastructure, such as water and sanitation services. They are the least vulnerable economies to maternal health problems like anemia among women of reproductive age (15–49 years), and the percentages of children under five years who are stunted are lower than in other SSA countries. Furthermore, they are the most efficient and productive economies in terms of consumption of animal products and protein supply of animal origin relative to other economies in the study area.
Table 2. FSI Score ranking among countries
4.1.4. Who is poor of the poor?
Chad, Ethiopia, Mozambique, Tanzania, and Liberia are the most food-insecure countries in the study area. They shared ranks from 17th to 22nd, with a little score variation across the series. However, we have seen that since 2015, Ethiopia has been relatively promising, even though it hasn’t shown much improvement. Many reasons are contributing to the poor performance of these countries. Low real GDP per capita, low share of arable land equipped for irrigation, increasing cereal import dependency ratio, and political instability and violence are some of the major issues that posed the inefficiency of FSI. Furthermore, when we come to Nigeria, its vulnerability to high food insecurity risk is increasing over the period (see Figure and Table ). This is highly attributable to the largest political instability index (−1.63, −2.21, −1.93, and −2.09) over the years 2005, 2010, 2015, and 2018, respectively. Politically, it is the least stable country in the SSA. Despite being the second-most natural resource-rich country next to South Africa in the region, its resource base is a curse rather than being a food (Dode, Citation2012; Elwerfelli & Benhin, Citation2018).
4.2. Econometrics analysis
4.2.1. Pre-estimation tests
In this section, we conducted basic estimation tests that could not be incorporated by the system GMM. Such as multicollinearity and cross-sectional dependence tests.
4.2.1.1. Multicollinearity test
We used variance inflation factor (VIF) to check for degree of multicollinearity among the explanatory variables given under Table . The mean VIF is less than 10, which means there is a low degree of multicollinearity among given variables.
Table 3. Multicollinearity test
4.2.1.2. Cross-sectional dependence test
In panel data estimation, it is advisable to test cross-sectional independence. The need for this is because it would indicate if there is a spillover effect of any policy change among the cross-section entities in the panel (Adesete et al., Citation2022). Therefore, we used Pesaran’s test to check for whether there is cross-sectional independence or not. We have a value of Pesaran’s test = 5.298, with Pr = 0.0720. In our study, it is statistically confirmed that climate change in any of the countries considered under the study could not have a spillover effect across them.
4.2.2. Empirical result
To check for the sensitivity of our estimates to measurements of indices, we estimated two models: the Shannon entropy and geometric mean indices. The results of the two models are consistent, and they have similar signs for their respective coefficients, identical significance levels, and close post-estimation results like the Hansen instrument validity test, the number of instruments, and autocorrelation tests.
Table reveals that the lagged dependent variables of food security index (FSI), total greenhouse gas emissions, livestock production index, growth rate of real GDP, agricultural employment, and percentage share of cropland have statistically significant effects at the usual level of significance on food security, while inflation rate and government financial assistance for agriculture have no significant effects on FSI. Specifically, greenhouse gas emissions have a negative and statistically significant (with a 5% level of significance) effect on food security. This implies that greenhouse gas emissions result in food insecurity in SSA. It halts the average value of food production and dietary energy supply derived from cereals, roots, and tubers, reducing water availability and the percentage of arable land equipped for irrigation. This finding is consistent with results by (Affoh et al., Citation2022; Islam et al., Citation2021; Richardson et al., Citation2018), which have found that, rise in temperature, increase in carbon emission, and depletion of water resource results food insecurity.
Table 4. Empirical result with Blundell and Bond’s (Citation1998) one-step system GMM estimation
Similarly, Verschuur et al. (Citation2021), in their study of climate change as a driver of food insecurity in the 2007 Lesotho-South Africa drought, found that climate-induced food production shocks, like droughts, were major causes of food shortages and price spikes, leading to severe food insecurity in the region. Khan et al. (Citation2023) also found that climate change was the major factor in hunger in the farm households of Pakistan under their study of determinants of food security through statistical and fuzzy mathematical synergy.
On the other hand, agricultural employment is playing a pivotal role in enhancing agricultural productivity and ensuring food security in SSA. It positively affects FSI with a 1% level of significance. It is in line with the findings of several studies; see examples (Kumar et al., Citation2015; Mkwambisi et al., Citation2011). Agricultural employment contributes to food security in two ways: first, it creates employment opportunities for those who are idle, and second, by intensifying and extending different agricultural practices, it boosts agricultural productivity and food security.
In summary, the paper concludes that greenhouse gas emission has a negative and significant impact on food security, while agricultural employment, livestock, and the growth of real GDP have a positive and significant effect on food security in SSA. However, only greenhouse gas emission has the highest negative coefficient, and agricultural employment has the highest positive effect. Therefore, it implies that countries in the region need to control climate change and increase agricultural employment opportunities to increase food security across the region.
5. Conclusion and policy implications
This study aimed at assessing the association between greenhouse gas emissions and food security among 22 SSA countries over the period 2005–2018 using Blundell and Bond’s one-step system GMM. The GMM estimator was helpful to control for potential endogeneity and unobserved heterogeneity. The GMM also resolved problems of heteroskedasticity and autocorrelation. We measured food security using Shannon entropy and geometric mean composite indices by considering four dimensions of food security (availability, access, stability, and utilization). The results of the study revealed that most SSA countries are in the vicious circle of food insecurity, with limited improvement over the study period. The study also found that the accumulation of greenhouse gases has significantly contributed to problems of food insecurity in SSA. However, several control variables like livestock production, employment in agriculture, and growth in real GDP have a positive contribution to the improvement in food security for the given countries.
Therefore, based on the findings, this study draws up key policy implications to provide for relevant stakeholders and policy makers. The governments of SSA countries should collectively combat the effect of climate change on food security through several mitigation measures. Such as using carbon tax or tradeable permits, they should take preventive measures against industrial waste and emissions. This implies that higher taxation of fossil fuels to respond to negative externalities resulting from their use would help stimulate the green economy. The other public intervention is that it needs to provide funding to subsidize and incentivize different eco-friendly projects, such as (1) carbon sequestration. According to the IPCC (Citation2014), deforestation is the first largest source of carbon emissions in SSA. Combating extensive deforestation, reforesting, and sequestering carbon in soils through improved agricultural practices and conservation of natural resources is therefore essential to reducing greenhouse gas emissions. (2), Low-emission energy supply: Fossil fuel combustion is the second-largest source of greenhouse gas emissions next to deforestation in SSA. Investment in alternative energy sources that emit less carbon is intriguing to the extent that its cumulative effect will be zero. Therefore, countries should provide enough funding to shift the energy supply from fossil fuels to less polluting alternatives like wind, solar, and hydropower for electricity generation and biofuel for direct sources of energy.
Similarly, relevant stakeholders should support farmers in creating an easy-access environment to create employment opportunities in agriculture and involve them in alternative agricultural practices such as the adoption of irrigation technologies, improved seed, organic pesticides, and fertilizer. Therefore, it is better if policymakers shift their eye towards intensifying and extending the sector by promoting sustainable and developed practices. Furthermore, there should be a platform that assists farmers in the decision-making process of coping with drought, climate change, weather variability, and food insecurity. For example, “AfriCultuReS” is playing a crucial role in this regard. It introduces different seed varieties, fertilizer supply through interest-free or low-interest credit, and weather and market information provision to support an effective adaptation scheme.
Indeed, to give insights for further research, it should be noticed that other approaches to food security index construction should also be followed. For example, giving weights to a particular indicator by identifying the one that needs to be prioritized through employing a panel of experts or a focus group discussion This is because the relative importance of a food security indicator may vary across regions depending on different socioeconomic characteristics. In addition to these, the given study is limited to a specific region and some countries that have more or less a similar agrarian economy. Therefore, the study strongly recommends that a further related gap be analyzed, which is about an economy that follows both agriculture and non-agriculture livelihood systems.
Conflict of Interest
No potential conflict of interest was reported by the author(s).
Authors’ contributions
The research idea was originally thought up by YMG. This author also searched for the existing literature and discussed it in collaboration with JBB. The empirical models were drafted by the first author and approved after consulting the second author, and then the econometric results were analyzed and discussed by YMG. They together discussed the findings, wrote up the manuscript, and revised the paper. Both authors read and approved the final manuscript.
Availability of supporting data
The data is ready and will be available upon reasonable request.
Acknowledgments
We would like to thank the anonymous reviewers for their helpful comments and suggestions. This manuscript has greatly improved because of their constructive comments and suggestions. So, we have heartfelt gratitude for them.
Additional information
Funding
Notes on contributors

Yezihalem Mebrie Gobezie
Yezihalem holds a Bachelor of Arts (BA) and a Master of Science (M.Sc.) degree in Economics from Addis Ababa University in Ethiopia. Currently, Yezihalem serves as a dedicated lecturer in Economics at Haramaya University, contributing to the academic growth and development of students. In addition to his teaching responsibilities, Yezihalem is pursuing a Ph.D. in Economics at the University of Verona, demonstrating a deep commitment to advancing knowledge and expertise in the field. His research and academic endeavors reflect a strong passion for the economic sciences and a dedication to contributing to the academic community. Yezihalem is driven by a desire to make meaningful contributions to the field of economics and shape the future of economic thought and policy.
References
- Adesete, A. A., Olanubi, O. E., & Dauda, R. O. (2022). Climate change and food security in selected sub-Saharan African countries. Environment Development and Sustainability, 1–18. https://doi.org/10.1007/s10668-022-02681-0
- Affoh, R., Zheng, H., Dangui, K., & Dissani, B. M. (2022). The impact of climate variability and change on food security in sub-Saharan Africa: Perspective from panel data analysis. Sustainability, 14(2), 759. https://doi.org/10.3390/su14020759
- Arellano, M., & Bond, S. (1991). Some tests of specification for panel data: Monte Carlo evidence and an application to employment equations. The Review of Economic Studies, 58(2), 277–297. https://doi.org/10.2307/2297968
- Arellano, M., & Bover, O. (1995). Another look at the instrumental variable estimation of error-components models. Journal of Econometrics, 68(1), 29–51. https://doi.org/10.1016/0304-4076(94)01642-D
- Bank, A. D. (2012). Food security and poverty in Asia and the pacific: Key challenge and policy issues. Asian Development Bank.
- Blundell, R., & Bond, S. (1998). Initial conditions and moment restrictions in dynamic panel data models. Journal of Econometrics, 87(1), 115–143. https://doi.org/10.1016/S0304-4076(98)00009-8
- Boka, J. B. (2020). The role of livestock in poverty reduction among Ethiopian households. Addis Ababa University Addis Ababa.
- Chand, P., Sirohi, S., & Sirohi, S. (2015). Development and application of an integrated sustainability index for small-holder dairy farms in Rajasthan, India. Ecological Indicators, 56, 23–30. https://doi.org/10.1016/j.ecolind.2015.03.020
- Connolly-Boutin, L., & Smit, B. (2016). Climate change, food security, and livelihoods in sub-Saharan Africa. Regional Environmental Change, 16(2), 385–399. https://doi.org/10.1007/s10113-015-0761-x
- Dagar, V., Khan, M. K., Alvarado, R., Usman, M., Zakari, A., Rehman, A., Murshed, M., & Tillaguango, B. (2021). Variations in technical efficiency of farmers with distinct land size across agro-climatic zones: Evidence from India. Journal of Cleaner Production, 315, 128109. https://doi.org/10.1016/j.jclepro.2021.128109
- Delazeri, L. M. M., Da Cunha, D. A., & Oliveira, L. R. (2021). Climate change and rural–urban migration in the Brazilian northeast region. GeoJournal, 87(3), 1–21. https://doi.org/10.1007/s10708-020-10349-3
- Demeke, A. B., Keil, A., & Zeller, M. (2011). Using panel data to estimate the effect of rainfall shocks on smallholder’s food security and vulnerability in rural Ethiopia. Climatic Change, 108(1), 185–206. https://doi.org/10.1007/s10584-010-9994-3
- Dode, R. O. (2012). The political economy of resource curse and the Niger delta crisis in Nigeria: Matters arising. European Journal of Sustainable Development, 1(2), 235–235. https://doi.org/10.14207/ejsd.2012.v1n2p235
- Ebi, K. L., & Loladze, I. (2019). Elevated atmospheric CO2 concentrations and climate change will affect our food’s quality and quantity. The Lancet Planetary Health, 3(7), 283–284. https://doi.org/10.1016/S2542-5196(19)30108-1
- Edoja, P. E., Aye, G. C., Abu, O., & Elliott, C. (2016). Dynamic relationship among CO2 emission, agricultural productivity and food security in Nigeria. Cogent Economics & Finance, 4(1), 1204809. https://doi.org/10.1080/23322039.2016.1204809
- EIU. (2012). Global food security index 2012. An assessment of food affordability, availability and quality. A report from the Economist Intelligence Unit. New York/San Francisco/London: The Economist. https://doi.org/10.10005/1298
- EIU. (2015). Global food security index report. In.
- EIU, E. I. U. (2019). Global food security index.
- Elwerfelli, A., & Benhin, J. (2018). Oil a blessing or curse: A comparative assessment of Nigeria, Norway and the United Arab Emirates. Theoretical Economics Letters, 08(5), 1136–1160. https://doi.org/10.4236/tel.2018.85076
- Fanzo, J., Davis, C., McLaren, R., & Choufani, J. (2018). The effect of climate change across food systems: Implications for nutrition outcomes. Global Food Security, 18, 12–19. https://doi.org/10.1016/j.gfs.2018.06.001
- FAO, F. A. A. O. O. T. U. N. (2017). In. Strengthening sector policies for better food security and nutrition results; policy guidance series. FAO.
- Hassan, O. M., & Tularam, G. A. (2018). The effects of climate change on rural-urban migration in sub-Saharan Africa (SSA)—the cases of democratic Republic of Congo, Kenya and Niger. Applications in Water Systems Management and Modeling.
- Ibrahim, H., Bello, M., & Ibrahim, H. (2009). Food security and resource allocation among farming households in north central Nigeria. Pakistan Journal of Nutrition, 8(8), 1235–1239. https://doi.org/10.3923/pjn.2009.1235.1239
- IPCC. (2014). Climate change, 2013, the physical science basis, working group I contribution to the fifth assessment report to the IPCC. In.
- IPCC. (2021). Climate change 2021: The physical science basis. contribution of working group I to the sixth assessment report of the intergovernmental panel on climate change, 2.
- Islam, M. M., Alharthi, M., Murad, M. W., & Ali, G. (2021). The effects of carbon emissions, rainfall, temperature, inflation, population. And Unemployment on Economic Growth in Saudi Arabia: An, 16(4), e0248743. https://doi.org/10.1371/journal.pone.0248743
- Izraelov, M., & Silber, J. (2019). An assessment of the global food security index. Food Security, 11(5), 1135–1152. https://doi.org/10.1007/s12571-019-00941-y
- Jones, A. D., Ngure, F. M., Pelto, G., & Young, S. L. (2013). What are we assessing when we measure food security? A compendium and review of current metrics. Advances in Nutrition, 4(5), 481–505. ARDL investigation. Plos one, 16(4), 0248743. https://doi.org/10.3945/an.113.004119
- Khan, Y., Ashraf, S., & Shah, M. (2023). Determinants of food security through statistical and fuzzy mathematical synergy. Environment Development and Sustainability, 1–19. https://doi.org/10.1007/s10668-023-03231-y
- Kumar, A., Ahmad, M. M., & Sharma, P. (2015). Carbon emission and global food security: A cross country analysis. PENCIL Publication of Agricultural Sciences, 2(1), 7–24.
- McGuire, S. (2015). FAO, IFAD, and WFP. The state of food insecurity in the World 2015: Meeting the 2015 international hunger targets: Taking stock of uneven progress. Advances in Nutrition, 6(5), 623–624. Rome: FAO, 2015. https://doi.org/10.3945/an.115.009936
- Mkwambisi, D. D., Fraser, E. D., & Dougill, A. J. (2011). Urban agriculture and poverty reduction: Evaluating how food production in cities contributes to food security, employment and income in Malawi. Journal of International Development, 23(2), 181–203. https://doi.org/10.1002/jid.1657
- Mogess, Y. K., & Ayen, D. D. (2023). The effects of climate change adaptation strategies on the welfare of rural farm households in Ethiopia. Food and Energy Security, 12(3), e451. https://doi.org/10.1002/fes3.451
- Ogunniyi, A. I., Mavrotas, G., Olagunju, K. O., Fadare, O., & Adedoyin, R. (2020). Governance quality, remittances and their implications for food and nutrition security in sub-Saharan Africa. World Development, 127, 104752. https://doi.org/10.1016/j.worlddev.2019.104752
- Oostdijk, S. (2021). Deforestation and forest fragmentation in Southwestern Ethiopia from 1973 to 2019.
- Peng, W., & Berry, E. (2018). The concept of food security. In. https://doi.org/10.1016/B978-0-08-100596-5.22314-7
- Richardson, K. J., Lewis, K. H., Krishnamurthy, P. K., Kent, C., Wiltshire, A. J., & Hanlon, H. M. (2018). Food security outcomes under a changing climate: Impacts of mitigation and adaptation on vulnerability to food insecurity. Climatic Change, 147(1–2), 327–341. https://doi.org/10.1007/s10584-018-2137-y
- Roodman, D. (2009). How to do xtabond2: An introduction to difference and system GMM in Stata. The Stata Journal, 9(1), 86–136. https://doi.org/10.1177/1536867X0900900106
- Saina, C. K., Murgor, D. K., & Murgor, F. A. (2013). Climate change and food security. Environmental Change and Sustainability, 10, 55206. https://doi.org/10.5772/46198
- Swietlik, K. (2018). Economic growth versus the issue of food security in selected regions and countries worldwide. Problems of Agricultural Economics, 3(3), 127–149. https://doi.org/10.30858/zer/94481
- Torero, M. (2014). Food security brings economic growth—not the other way around. IFPRI BLOG.
- Verschuur, J., Li, S., Wolski, P., & Otto, F. E. (2021). Climate change as a driver of food insecurity in the 2007 Lesotho-South Africa drought. Scientific Reports, 11(1), 3852. https://doi.org/10.1038/s41598-021-83375-x
- WFS. (1996) . World food summit: Rome declaration on world food security and world food summit plan of action.
- WHO. (2019). The state of food security and nutrition in the world 2019. In.
- Wijerathna-Yapa, A., & Pathirana, R. (2022). Sustainable agro-food systems for addressing climate change and food security. Agriculture, 12(10), 1554. https://doi.org/10.3390/agriculture12101554
- Woertz, E. (2017). Food security in Iraq: Results from quantitative and qualitative surveys. Food Security, 9(3), 511–522. https://doi.org/10.1007/s12571-017-0666-2
- Zhang, Z., Kattel, G. R., Shang, Y., Wang, G., Chuai, X., Wang, Q., Cui, X., & Miao, L. (2023). Steady decline in food self-sufficiency in Africa from 1961 to 2018. Regional Environmental Change, 23(2), 79. https://doi.org/10.1007/s10113-023-02074-7
Appendix 1:
List of SSA countries taken for the study
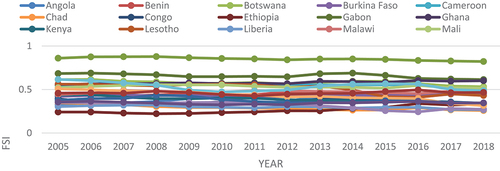
Appendix 2
Figure A1. FSI pattern from entropy aggregation for all countries in a single figure
Appendix 3
Figure A2. FSI pattern from geometric mean aggregation for all countries in a single figure