
Abstract
With the growing interest and concerns about the concept of smart city, assessing the smart city gains increasing attention from government planners, policy makers and related researchers around the world. This paper aims to provide a critical review of metrics involving national frameworks, institutional standards, and local reports, which focuses not only on the evaluation systems but also the assessing methodologies for assessing performance, risk and construction ability of smart cities. It is concluded that, most existing standards and research foci are on performance, and more attention needs to be paid to assessments of risk and construction ability. The former one suffers from the poor reliability and comparability resulting from massive indicators and unclear calculations, while the latter two are constrained by vague evaluation systems and insufficient method applications. Based on the comparison and discussion of the current research status, limitations and the future research directions, this research sheds light on better planning, monitoring and governance of smart cities. It also contributes to understanding and promoting the development of related research and even strategies or policies.
1. Introduction
Systems of cities often take many forms in terms of the integration of multiple activities across different sectors, playing the key role in economic, social and environmental development. Specifically, current cities are complex systems, which are characterized by massive numbers of interconnected citizens, business, and different modes of transport, communication networks, services and utilities (Neirotti et al., Citation2014). With the rapid development of new technological innovations, for the past two decades, the concept of “smart city” has become increasingly popular in scientific literature and international policies (Albino et al., Citation2015), as a solution for the better management of cities and global population (Adapa, Citation2018). At the crossroad of technological progress and urban development, the smart city represents a conceptual model on the basis of the utilization of human, collective and technological capital for the development of urban agglomerations (Angelidou, Citation2014). Even though the agreed definition of it has not emerged, different descriptions and booming analyses of the characteristics and evolutions of smart cities can be found in the literature (see, Angelidou, Citation2015; Li et al., Citation2019). In practice, the number of smart cities worldwide, whether already developed, implemented, or planned, is growing (Hajek et al., Citation2022). According to the Annual Report on World Smart City (2016–2017), to realize smart development, many medical institutions (e.g., Teladoc, American Well, Doctor on Demand, and Partners Health Care) in the U.S.A. have incorporated internet technology (e.g., big data analysis, telemedicine monitoring, and mobile smart devices) into public health services. In addition, E-government has been applied widely in Sweden, South Africa and China via establishing the mobile tax payment system, refreshing the health-care industry and simplifying a wide range of urban services (including hospitals, traffic and transportation, and law enforcement). As International Data Corporation (IDC) released, in 2020, the worldwide spending on smart cities and relevant market is roughly $114.4 billion, and experts have projected those would increase with the compound annual growth rate (CAGR) of 14.6% after 2021. With the second largest spending scale around the world, the expenditure on smart cities and relevant market in China reached $25.9 billion in 2020, which has been predicted to be more than $45 billion in 2024 at a CAGR over 16% (IDC, 2020).Footnote1 Moreover, so far more than 1000 smart cities have been initiated or constructed around the world, especially in Europe, North America and Asia (Jiang et al., Citation2021). By 2016, all sub-provincial cities and 89% of cities at prefecture level and above in China promoted the construction of smart cities, and from 2012 to 2020 the numbers of national pilot smart cities expanded from 90 to over 900 (Tianyancha Research, Citation2022).Footnote2 These indicate that smart cities have great impacts on global urban development, and there are also growing frameworks and literature focusing on smart cities conception and assessment. To understand and discuss this concept, it is important to consider and review the following questions.
What is the smart city? It is a widely used concept but without a uniform and consensual definition yet. This term was first introduced in 1990, which is deemed as a new approach and an ideal solution to the environmental challenges of the rapid urbanization, and whose origin could be traced back to the Smart Growth Movement of the late 1990s (see, Al Sharif & Pokharel, Citation2022; Harrison & Donnelly, Citation2011; Jiang et al., Citation2021; Li et al., Citation2018) since not only they center on the similar focus but also the choice word of “smart” to describe cities proceeds from the smart growth movement (Gaffney & Robertson, Citation2016). Its definitions initially focused on the information and communication technologies (ICT) and modern infrastructures application. Then, the Center of Governance at the University of Ottawa started criticizing such ideas as being too technically oriented and emphasizing the governance-oriented aspect. Later, remaining the main focus on ICT infrastructure, much research has also taken the role of resources, human and social capital, relations and networks in economy, environment and living into considerations (see, Ahvenniemi et al., Citation2017; Caragliu & Del Bo, Citation2012; Caragliu et al., Citation2011; Cretu, Citation2012; Giffinger et al., Citation2007; Hajek et al., Citation2022; Hollands, Citation2008; Jiang et al., Citation2021; Kourtit & Nijkamp, Citation2012; Lazaroiu & Roscia, Citation2012; Lombardi et al., Citation2012; Patrão et al., Citation2020; Sharifi, Citation2020; Thite, Citation2011; Zygiaris, Citation2013). In general, a smart city is a designation given to a city that mainly incorporates ICT, people, education, community to improve the quality and performance of urban services such as energy, transportation and utilities for the reduction of resource consumption, wastage and overall costs. After summarizing the definitions and characteristics of the smart city, this study deems that assessing it efficiently is a significant topic worth further discussion.
Why need to assess it? Smart city is regarded as a crucial direction of future city development, whose aim is to enhance the quality of living for its citizens through smart technology. Since this concept has been quite fashionable in the policy arena in recent years (Lombardi et al., Citation2012), more governments have planned and constructed the cities in a smarter way. In this sense, assessing smart cities is becoming an increasingly important factor in tracking the progress of rapid growth of smart city initiatives (Hajek et al., Citation2022), which is quite critical for urban planning and policy making. Specifically, the construction ability assessment of smart cities can be viewed as the foundation and guarantee, contributing to shaping the design and identifying the direction and particularly practicability of a smart city plan, while the performance assessment and risk assessment will help monitor, improve and even guide the smart city construction and governance.
Assessing it for whom? The stakeholders of planning for and managing smart cities might majorly be official users including government planners, policy makers or public managers as the major driver, whilst there are other end-users of related information, such as IT experts, policy/service domain experts, visitors, investors and citizens. As the practitioners and participants of smart city construction, such unofficial users may also be attracted and affected by the assessing results.
How can we assess it? Among a considerable amount of research on assessing smart cities, there are majorly two strands of investigations based upon assessment indicators or assessment practices/studies. Since smart cities represent a multidimensional and multidisciplinary field that is being experimented and analyzed in both practice and academia, a number of institutions and scholars have constructed and further applied their indicator systems for assessing smart cities (e.g., Carli et al., Citation2013; ISO, Citation2018; Lazaroiu & Roscia, Citation2012; Li et al., Citation2019; Liu et al., Citation2022). On the other hand, through some qualitative methods such as interviews with city authorities, review of city reports, comparative analyses on existing practices, and bibliometric analyses on assessing literature, the status and future of smart city assessment can be discussed as well (e.g., Caird, Citation2018; Hajek et al., Citation2022; Huovila et al., Citation2019; Orejon-Sanchez et al., Citation2022; Sharifi, Citation2019).
Although the past decade has undergone a remarkable development of analyses on assessing smart cities, the holistic review or comparative analysis is still scarce. For one thing, the previous establishment or review of assessment index systems and analyses is mostly constrained by the performance assessment and mixes up the existing assessing framework at different scales and in different contexts. For another thing, beyond index system construction, the method application to draw and further compare the assessing conclusions is another indispensable part for smart city assessment. However, review of this is often neglected and lacking. To fill these gaps and bring about some novelty, with regard to not only performance assessment, but also risk assessment and construction ability assessment of smart cities, this paper aims to provide a multi-level and relatively comprehensive review of metrics involving national frameworks, institutional standards, and local reports. Furthermore, the present study focuses on not only the indicator systems but also the assessing approaches. It is of great theoretical and practical significance in extending our review scope and promoting better planning, monitoring and governance of smart cities. Through conducting comparisons, this study also contributes to the understanding and identification of the development and future directions of related academic research and even practical strategies or policies.
Except the introduction of research background and significance, the remainder of this study is organized as follows. First, echoing the research aims and contributions, the study introduces the analytical framework and research methods. Then, this paper analyzes the research status of smart city assessment by analyzing 4377 including 2049 most related journal articles published since 2000 in the Web of Science (WoS) database. After dividing the common research themes into three domains: performance assessment, risk assessment and construction ability assessment, it reviews and compares the evaluation systems in terms of national frameworks, institutional standards, and local reports. In the next section, the relevant assessing methodologies applied in current research (including both qualitative and quantitative methods) are also reviewed from the perspectives of the above-mentioned three thematic foci. Based on the above analysis, then the present research discusses the limitations of existing frameworks and the further research directions. Finally, a brief summary of the findings and implications for future studies is given in the last section.
2. Analytical framework and research methods
2.1. Analytical framework
To conduct a multi-level and holistic review, this study is developed in three steps. It begins with the general searching for recent literature on assessing smart cities, to determine the thematic focus (i.e., performance assessment, risk assessment, and construction ability assessment) for analysis. Second, the present study reviews and categorizes the existing literature of relevance, with highlights on various sources of assessing frameworks (i.e., national frameworks, institutional standards, and local report) and methodologies for assessing (i.e., descriptive or qualitative analysis and semi-quantitative or quantitative analysis). Third, regarding the relatively abundant discussion and mature analysis of performance assessment, a focal analysis on 20 evaluation frameworks is developed to reveal more specific patterns and limitations (presented in section 4.1.4). Accordingly, the analytical framework of the study can be specified as the following Figure illustrates.
Figure 1. Analytical framework of this study.
2.2. Materials and methods
According to the above-mentioned three steps of analysis, firstly the procedures for literature search and selection from the WoS database are in line with the bibliometric review conducted by Hajek et al. (Citation2022) and Sharifi et al. (Citation2023). Specifically, this study selected “assessing smart city” “smart city assessment” “smart city measurement” “smart city indicator” and “smart city index” as the unit of analysis and performed the literature collection through conducting a comprehensive search of the WoS Core Collection database, which is recognized as a reliable source (Bartolacci et al., Citation2020). Then, since “smart city performance measurement framework” is found to dominate the discourse and assessments of risks and construction ability associated with smart cities are crucial but lacking (Hajek et al., Citation2022; Zhang et al., Citation2017), this study concentrated on three themes for further review and analysis. To uncover the growing concern about and great significance of the selected themes, the present study adopted the following search criteria for the identification of the relevant research:
(TS = (smart city assessment)) OR TS = (assessing smart city);
((TS = (smart city assessment)) OR TS = (assessing smart city)) AND TS = (performance assessment);
((TS = (smart city assessment)) OR TS=(assessing smart city)) AND TS = (risk assessment);
and ((TS = (smart city assessment)) OR TS = (assessing smart city)) AND TS = (construction ability assessment).
In the first step, literature published in 2000–2022 was searched, which contained the period of the exponential growth of smart city publications (see, Hajek et al., Citation2022; Zheng et al., Citation2020). In the second step, literature and in particular assessing frameworks were categorized and compared from the perspectives of index systems and assessing methodologies. It is noted that analyses in these two steps are developed based on the division of three themes. Furthermore, in the third step, 20 influential and holistic frameworks assessing smart city performance were chosen for the in-depth analysis. For these investigations, except literature review, methods of the basic bibliometric analysis (including content analysis, word cloud method and co-word analysis) were used in the following sections.
3. Foci for assessing smart cities
More governments have planned to develop the city in a smart way, and both planners and scholars have concerned more about assessing the smart level. In particular, since 2010, after the appearance of the initial smart city projects, the number of articles, regulations, and reports regarding the topic has increased significantly (Orejon-Sanchez et al., Citation2022). For mapping a general picture of the growing concern, this study first used five key words associated with assessing smart cities for searching literature in the WoS database. Excluding the overlapping part, 4377 publications could be retrieved in 2000–2022 as the following Figure shows. It is revealed that, during the study period, the yearly amount of related literature has kept growing since the year 2009 and reached over 900 in 2021 and 2022.
Figure 2. Trend of related publications from 2000 to 2022.
Among these, 2049 publications focused on “smart city assessment” or “assessing smart city” have been searched from a total of 4377 related literature in this period. The temporal distribution of them is shown in the following Table . It is shown that the number of publications increased dramatically in 2018 with the similar trend presented in Figure .
Table 1. Yearly most related publications from 2000 to 2022
Results in Table confirm the growing significant role of assessing performance and risks in the domain of smart cities. Thus, given the predominance and importance of research foci among these most related publications, the selection, categorization and investigations of three themes (i.e., performance assessment, risk assessment and construction ability assessment) that this study was interested are reasonable and rewarding. Accordingly, more detailed review and analysis are presented as follows. Based on the objectives and contents of assessing, this study regards the construction ability assessment as the ex-ante evaluation which is usually completed before constructing a smart city, while the performance assessment and risk assessment are considered as the in-process assessments that are important to monitor the effect of related strategic planning and improve the smart city management and development.
4. Index systems for assessing smart cities
4.1. Performance assessment
The smart city is always considered to be a multi-dimensional definition or design, incorporating ICT, people, education, community and many other factors, and aiming at enhancing the performance of urban services. Thus, how to evaluate the performance of a smart city is quite fundamental and significant to related research. As the most popular topic on assessing smart cities in these years, not only plenty of research has discussed the performance assessment system of smart cities, but also many countries and related institutions have established their assessing frameworks for smart city development and governance (Hajek et al., Citation2022).
As the pilot and most cited framework in the domain of assessing smart city performance, Giffinger and his team (Giffinger et al., Citation2007) first developed an assessment metric containing specific indicators for identified dimensions of a smart city. It includes six aspects (i.e., smart economy, smart people, smart governance, smart mobility, smart environment and smart living), labeled as Ranking of European Medium-sized Cities. These dimensions are associated with traditional regional and neoclassical theories of urban growth and development (Lombardi et al., Citation2012). Furthermore, the index system consists of 74 variables, which is a good reflection of European regional characteristics with wide coverage and has been referred by the following research for long. This framework has been mostly cited and provided the theoretical basis for other research in the domain (Hajek et al., Citation2022). Thus, this study laid special emphasis on it and then introduced the other assessing systems as follows from three aspects of national frameworks, institutional standards and local reports.
4.1.1. National frameworks
With the only emphasis on hard environment, the smart city assessing model used by Korea is the Informatization Index since 1995, simply containing seven detailed objective indicators on computer, Internet, broadcasting and communication. This index is updated and released every 2 years to reflect the information level of major 50 economies around the world. Similarly, after the design and implementation of e-Japan and U-Japan strategies, related evaluation system has been applied in Japan with the sole focus on ICT. This system involves five categories (namely, ICT expense rate, ICT quality, ICT mobility, ICT popularization and ICT construction) and 10 factors. Additionally, compared with the above two information index systems, the assessment of smartness in Australia incorporated factors concerning smart people. This evaluation system was established by Australian Government Information Management Office using AGIMO Index after 2004, containing 29 indicators relating to technical dimension, Internet use, access level, infrastructure dimension, e-commerce, e-governance, etc. In the United States, the development plan of smart cities was first proposed in 2015 accompanied with abundant investments and campaigns. However, the Smarter Cities Ranking developed by the National Resources Defense Council is characterized by a strong bias towards environmental-related criteria (IDA, 2012).
In China, the national framework for assessing smart cities was mainly formulated by National Development and Reform Commission of China (NDRC) in 2016, which incorporated eight dimensions with all 54 objective indicators, subjective indicators and optional indicators. It emphasizes public service, precision governance, livable ecology, smart infrastructure, information resources, network security, innovation and public experience. For application, the data source is expected to include both national statistics and citizen survey. However, this evaluation system is quite complex, which makes it hard to compare among different cities.
4.1.2. Institutional standards
Dating back to 2010, as the pioneer of smart development, IBM’s view of the smart city derived from their notion of Smart Planet Strategy (2009) and envisioned three main characteristics as instrumented, interconnected and intelligent. IBM Smart City comprised six key systems: people, business, government, transportation, communication, water and energy. Correspondingly, the evaluation system consisted of four dimensions and 21 indicators on network interconnection, smart industry, smart service and humanity.Footnote3
Globally, except for IBM, there are other two institutions working on smart city evaluation. Since 2006, Intelligent Community Forum (ICF) has annually announced cities awarded as Smart 21 Communities, which earns high score in five factors (i.e., broadband connectivity, knowledge workforce, digital inclusion, innovation, and marketing and advocacy) to be an intelligent community.Footnote4 Afterwards, the International Telecommunications Union (ITU-T, 2016) constructed the Core Index System of International Information Society Measurement, aiming at assessing the smart sustainable city via six dimensions and 48 key performance indicators on information and communication technology (ICT), environmental sustainability, productivity, quality of life, equity and social inclusion and physical infrastructure. Besides, International Organization for Standardization (ISO) 37122 publicly released the international standard for smart cities in 2018. This evaluation system contains 19 main categories (that is, economy, education, energy, environment and climate change, finance, governance, health, housing, population and social conditions, recreation, safety, solid waste, sport and culture, telecommunication, transportation, urban/local agriculture and food security, urban planning, wastewater, water) and 85 indicators.
Furthermore, owing to the support and experiences of constructing and developing smart cities, many influential institutions and companies of the United States, China and the United Kingdom have dedicated to evaluate the performance of smart cities. In the U.S.A., International Data Corporation (IDC) is a wholly owned subsidiary of International Data Group (IDG), founded in 1964. As the premier global provider of events for the information technology, telecommunications, and consumer technology markets, this institution built the IDC Smart City Index first in 2011, which is calculated by 94 indicators of five dimensions (i.e., government, buildings, transportation, energy, environment and service). It also recognizes outstanding smart cities and projects every year, and the 2019 IDC Smart City Asia/Pacific Awards recognized in 12 categories concerning administration, civic engagement, digital equity and accessibility, etc.Footnote5
In China, three institutions of the Ministry of Industry and Information Technology have proposed the evaluation system of smart cities. In 2012, Center of Software and Integrated Circuit Promotion (CSIP) constructed the system with six primary factors concerning hardware infrastructure, information resources, intelligence industry, smart management, smart livelihood and smart security, which could be subdivided into 58 indicators. Then, in 2013, China Software Test Center (CSTC) established the index system (SMART Model) to measure the smartness with five basic dimensions and 71 specific indicators, with the focus on smart service, smart management (including management & maintenance) and smart preparation (including application platform, resource, and technology). In addition, the China Academy of Information and Communications Technology (CAICT, 2014) proposed the evaluation system with highlights of information infrastructure and smart application effects, which could be measured by 25 indicators. Apart from these, in 2012 the Ministry of Housing and Urban-Rural Development (MoHURD) erected the evaluation criteria system for pilot smart projects, which contains four fundamental dimensions and 59 indicators on security and infrastructure, smart construction and livability, smart management and service, smart industry and economy. Moreover, in 2013, the evaluation system of Chinese Academy of Engineering (CAE) emphasized management and service, industry and economy, construction and environment, information level and residents’ humanities quality of the smart city, which could be broken into 20 detailed indicators. And then, the Standardization Administration of China (SAC, 2015) produced the indicator list to assess the performance of a smart city, which is made up of several subjective indices on infrastructure, public service, social management, living conditions and industrial system. In the same year, Chinese Academy of Sciences (CAS, 2015) published the “Assessment Report on the Development Level of Smart Cities” and applied the index system consisting of six factors on smart people, smart management, smart service, smart economy, smart infrastructure and security system. Apart from these, it is noted that, as the leading explorer of smart city construction, a technology company named Bellsent raised the index system for the development evaluation of the smart city, including five dimensions and 64 indicators related to infrastructure, public management and service, information service development, humanities quality and citizens’ subjective perception of the smart city.
Recently, in the United Kingdom, the market research firm Juniper Research crowned Singapore as the smartest city, together with Barcelona, London, San Francisco and Oslo as the top five smartest cities on earth after sorting through a mountain of data related to cities around the world. To draw the conclusion, researchers at Juniper ranked cities by an array of factors including the adoption of smart grid technologies, intelligent lighting, the use of information technology to improve traffic, Wi-Fi access points, smartphone penetration, and the app landscape.
4.1.3. Local reports
The following review of this part is developed from two perspectives, the evaluation systems from local governments and influential research of scholars.
Assessing Smart Cities in the Mediterranean Region (ASCIMER) is a three-year research project developed by the Universidad Politecnica of Madrid (UPM) in 2014. Its first year of work was to classify the different dimensions of regional smart cities. Afterwards, Monzon (Citation2015) identified six main dimensions of relevance on governance, economy, mobility, environment, people and living with specific 38 factors as European smart cities’ challenges.
In China, Nanjing, Shanghai, Beijing have adopted local smart city evaluation system and published several reports. Firstly, in 2010, based on the local development status, Nanjing Information Centre constructed the Assessing Index System of Smart Nanjing, which consists of four dimensions containing network interconnection, smart industry, smart service and smart humanities and 24 detailed indicators. Later, Shanghai Pudong Smart City Research Institute proposed the Assessing Index System of Smart City 1.0 in 2011. It includes five dimensions and 64 detailed indicators on infrastructure, public management and service, information services and economic development, humanities quality and citizens’ subjective perception of the smart city. And then, this index system has been improved to 2.0 in 2012 through adding the dimension on soft environment construction and simplifying some indicators.Footnote6 Following the related national information planning, Beijing Municipal Commission of Economy and Information Technology (BJEIT) published the Smart City Development Index (SCDI) to assess and monitor the development of smart Beijing comprehensively, which is made up of four sub-index and 19 indicators to capture smart environment, smart infrastructure, smart application and development effect at the local scale. Furthermore, Taiwan authorities have engaged in constructing smart cities since 1998 and published the performance evaluation system of smart Taiwan in 2009, which aimed at evaluating both productivity and efficiency. The primary dimensions are concerned with broadband convergence network, cultural and creative industries, high-quality smart government, satisfying life applications and industries, fair digital opportunities and talent cultivation. Within this system, the sub-indices include the status value in 2008, predictive values in 2012 and 2016, but without further specific indicators.
On the other hand, different measures and indices have also been developed so far by many researchers. Cohen (Citation2012) put forward the Smarter Cities Wheel (SCW) theory and the related index system, aiming at urban innovation and sustainable development. This frequently cited evaluation system contains six primary dimensions, 18 working area and 24 indicators on economy, people, government, mobility, environment and living of smart cities. Meanwhile, Lazaroiu and Roscia (Citation2012) proposed the “Smart City Index” containing 18 indicators with a large amount of information on pollution, innovative spirit, transparent governance, separated littery, cycle lanes, fuels, availability of ICT-infrastructure, etc. This index system shares 10 indicators in common with the pilot evaluation system proposed by Giffinger’s team, but it stresses more on public environment and waste disposal. Moreover, Lombardi et al. (Citation2012) modified the triple helix model by adding the civil society to the previous three agencies (i.e., universities, industries and government). And they put forward a more sophisticated system to measure the smartness of a city from the aspects of smart economy, smart people, smart governance, smart environment and smart living. This framework is composed of 60 indicators selected from several assessing reports and datasets, and excludes the indicators on smart mobility. Afterwards, with the same six assessing dimensions used by Giffinger et al. (Citation2007), Carli et al. (Citation2013) defined an innovative framework to classify the performance indicators from the perspectives of objective degree and technological advancement level for data collection. Accordingly, they also developed the indicator system consisting of 52 different detailed indicators to monitor the smart city initiatives in the municipality of Bari (Italy) from a human centric viewpoint, which contained more subjective variables and less objective ones. Then, Lee et al. (Citation2014) studied six key dimensions and 17 sub-dimensions of smart cities, depicting urban openness, service innovation, partnerships formation, urban proactiveness, smart city infrastructure integration and smart city governance. Locally, Ernst and Young Global Limited (Citation2016) using Smart City Index compared all Italian municipalities, and the related ranking procedure monitored changes in a dynamic way by comparing the assessments in different years. This project evaluated urban smartness by examining 9 subjects with a total of 153 indicators, mainly on broad band, smart mobility, smart health, smart education, smart government, renewable energies, energy efficiency and natural resources.
4.1.4. Summary and comparison
To capture the characteristics of evaluation systems, this study produced the following word cloud to visualize and analyze the major dimensions of 20 evaluation frameworks selected from those reviewed before (including 2 at the national level, 11 at the institutional level and 7 at the local level).
The size of word mirrors the frequency it occurs. That is, the bigger a word displayed in the above figure, the more common it is among different frameworks. It is shown that, the biggest word “smart” occurs 44 times in the 106 dimensions, indicating the emphasis on smart which differs from the general city assessment. Then, “service” “infrastructure” “industry” “information” “management” “economy” “governance” and “environment” are relatively common among the selected dimensions, as the most core domains need to be considered when assessing smart cities.
Therefore, based upon word cloud method with word frequency analysis and basic co-word analysis, this study considered smart infrastructure, smart service, smart mobility, smart governance, smart economy, smart environment, smart people and smart living as the potential common dimensions. By examining whether the common dimensions are included, it further specified and compared the differences among assessing frameworks as the following Table shows.
Table 2. Common dimensions of 20 evaluation systems for smart cities
It is obvious that smart mobility is ignored in national and institutional assessing standards, while the assessment of smart infrastructure is involved in all selected frameworks only except for SCW. Furthermore, the considerations about dimensions on smart environment and smart living emerge relatively later than others, which reveals that the focus of smart city assessment expands to more factors related to sustainability and the quality of development. Through comparing the coverage, this study concludes that the evaluation systems of Korea and CAICT (China) are quite simple, with only one dimension reflecting hard environment, while the ones of SCW, EU and CAE (China) seem relatively comprehensive.
Moreover, Figure suggests that most of frequent words are objective. Some words such as “livelihood” “citizens” “residents” “perception” “experience” seem relatively unique among the analyzed frameworks, which shows that the subjective and soft-environment factors are incorporated less than the objective ones to some extent. In order to further analyze the types of smart city performance indicators, this study referred to and applied the divisions of not only indicators into subjective and objective (Carli et al., Citation2013), but also smartness into hard and soft (Ahvenniemi et al., Citation2017; Huovila et al., Citation2019). With the focus on the detailed indicators of six relatively more comprehensive frameworks given by Table (with names shown in bold), results are presented in the following Figure .
Figure 3. Word cloud chart of 20 evaluation systems for smart cities.
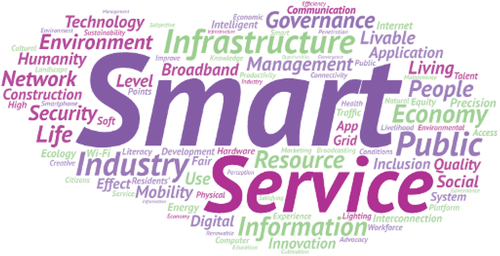
Figure 4. Balance between indicator and smartness types of six evaluation systems for smart cities.
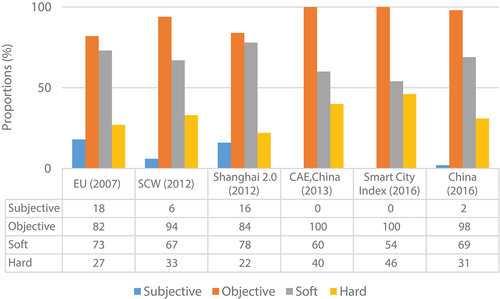
Not surprisingly, all selected evaluation systems contain more objective indicators than subjective ones. In particular, all the indicators of the assessing frameworks constructed by CAE, China and Ernst & Young Global Limited are objective. Among 74 indicators of EU framework, 18% reflect the satisfaction, perception or opinion of people, while this share is 2% for China’s evaluation system. With regard to the types of smartness, all selected performance evaluation frameworks consist of more indicators reflecting soft smartness. At the local level, the Smart City Index applied in Italy is relatively the most balanced between hard and soft smartness, while the evaluation systems of Shanghai and EU predominantly (78% and 73%) concentrate on soft smartness. The remaining three standards concern a bit less about the soft perspective, but related indicators still accounts for over 60%.
4.2. Risk assessment
Risk assessment is usually deemed as another crucial step after planning for and establishing a smart city. Relying on the Internet of things, cloud computing and many new information technology, the smart city provides potential advantages such as more convenient life and service, improved energy efficiency and pollution control, and new economic opportunities and management methods. However, some related risks are also easy to be ignored and likely to cause economic losses for governments and citizens. A body of literature on risk identification claims that, the major risk sources are concerned with personal information security, privacy protection, urban cyber security, network system and infrastructure maintenance, etc. (see, Belanche-Gracia et al., Citation2015; Fukuzawa et al., Citation2015; Li et al., Citation2018; Martinez-Balleste et al., Citation2013; Sen et al., Citation2013; Ullah et al., Citation2018). In short, in the construction and development of a smart city, the involved risks can be associated with not only technical but also managerial problems, which have aroused great concerns of both researchers and governors.
Efficient risk assessment links to better control over the security risk and protect the necessary information. Existing evaluation criteria are mainly concerning information security. Globally, U.S. Defense Science Board (1970), and Trade and Industry Department of British (1995) established the assessing factors on confidentiality (or privacy), integrity and availability to evaluate the trusted system and avoid related risks. Then, the Chinese government extended the considerations about guaranteeing the authenticity, verifiability, non-repudiation and reliability of information.
Furthermore, Ferraz et al. (Citation2013) discussed the information security and related risks from the perspective of system interoperability, application and platform structure. Specifically, Ferraz and Ferraz (Citation2014) depicted nine information security issues that a smart city might be under risk, concerning access to information from applications, information tracking, citizen tracking, user/citizen data loss, crossed access to information in data centers, crossed access in client side, lack of security in depth, viral effect in urban environment, and infection traceability and recovery. Then, focusing on the information security in smart cities, Zou et al. (Citation2016) established the risk assessment system with five levels in terms of smart infrastructure security risk, data service security risk, information content security risk, information management security risk, and public quality security risk. Similarly, Li et al. (Citation2018) elaborated five dimensions of the information security as smart infrastructure, smart database resources, smart control system, human factors and information content. The detailed descriptions of the dimensions in above two evaluation systems are reported in the following Table . Additionally, Belanche-Gracia et al. (Citation2015) viewed the sources of cyber risk in smart cities as network security management system, data leakage and damage threat, weak security awareness and vulnerability of equipment security. To assess the functional risk, Jiang et al. (Citation2018) constructed the evaluation index system through the functional risk analysis and index design, which embraced self-learning risk, optimal operation risk, prediction risk and security risk (see Table ).
Table 3. Risk evaluation system descriptions
Table demonstrates the components and structures of several risk evaluation systems in related literature on smart cities. Such assessments have laid enough stress on smart facility operation, information management, technology application and citizen awareness, with both subjective and objective indicators. Nevertheless, these seem relatively abstractive and call for the specification of measurements for further appraisal. Moreover, comparing these with the related rough national assessing factors and frameworks, this study uncovers the lack of comprehensive risk evaluation system and criteria for smart cities, especially at the national and institutional level.
4.3. Construction ability assessment
As one assessment usually completed in advance, construction ability assessment is to measure the capacity of urban construction, management and application. It aims to make full use of the resources and develop the advantages via evaluating and analyzing the status and features, and further to build an economic, green and practical smart city with local characteristics. It is quite fundamental and critical for both making and implementing the smart city plans.
At the institutional level, World Economic Forum (WEF) produced the Global Information Technology Report (GITR) containing the structure of Network Readiness Index (NRI) and its calculations of over 130 economies in 2001. NRI is a good reflection of potential smart city construction ability, and consists of three sub-indices on (market, policy and infrastructure) environment, (individual, enterprise and government) network readiness and (individual, enterprise and government) application with 68 detailed indicators. Additionally, in 2015, the Standardization Administration of China (SAC) designed the construction ability evaluation system that contained four factors and a series of objective indicators related to information resource security, development mechanism security, internet safety security and innovation ability security. Then, based on this institutional framework, Zhang et al. (Citation2017) employed the system and developed it to 16 detailed indicators, concerning new information technology, planning urban construction, improving urban management and public service. Obviously, the mentioned construction ability assessment frameworks are almost composed of objective indicators, based on data sensing and mining of the physical infrastructure.
However, there are limited standards, frameworks or even research focusing on this issue and some literature has mixed this with the performance assessment. There are common factors of these two assessments especially on the smart technology application, but the difference is also evident. That is, the construction ability assessment will put more emphasis on existing capacity and potentials of a city, while the performance assessment will focus on the effects of building and developing a smart city. In other words, the former seems to be the basis evaluation, and the latter could be viewed as the result appraisal. Compared with abundant research on performance assessment for smart cities, construction ability assessment deserves more investigations and needs more official criteria in particular at the national level as well.
5. Methodologies for assessing smart cities
In the evaluation process, except for constructing the index system of smart cities, using efficient and scientific assessing methodologies plays a critical role in reaching the conclusions. Research methods for smart city assessment can be mainly divided into two strands, descriptive or qualitative analysis and semi-quantitative or quantitative analysis.
5.1. Performance assessment
5.1.1. Descriptive or qualitative analysis
Radar Diagram Analysis is a direct presentation of the different value of multi-level assessing indicators through radar graphs, which is employed by a number of research of IBM (2010), Lazaroiu and Roscia (Citation2012), Dall’O’ et al. (Citation2017), etc. To evaluate the smart city performance, at the local level, Lazaroiu and Roscia (Citation2012) used this method to display and compare the 18 indicators value of 10 Italian cities, concluding that some parameters widely respect the smart city condition (e.g., pedestrian areas and fuels) and others need further efforts (e.g. education facilities, health conditions and CO2). The diagram is visible and clear, and thus this method is usually applied to analyze multiple indicators and compare the characteristics. Additionally, line graphs (Giffinger et al., Citation2007; Rad et al., Citation2018) and bar charts (Carli et al., Citation2018; Li et al., Citation2019) are also used to display and compare the performance of smart cities.
5.1.2. Semi-quantitative or quantitative analysis
For performance assessment, since assessing smart cities is a multiple task with multi-dimensional indices and measures, to introduce the quantitative analysis, two steps are vital for discussion: weight calculation and synthetic evaluation.
The most convenient way to determine the weights is a simple arithmetic weighting method to set all indicators in the same dimension with equal weights, which is employed by ICF and Rankings of European Medium-sized Cities. Nevertheless, more research considers the different importance of indicators and differentiates their weights through applying either subjective methods such as the analytic hierarchy process (AHP), analytic network process (ANP) and fuzzy logic based model, or objective methods such as the entropy weight method (EWM), artificial neural networks (ANN), principal component analysis (PCA), and factor analysis. Among these, ANP is more complex than AHP, with less assumptions of model but more considerations about the interactions between factors in the network system. Generally, the first three above-mentioned all involve the perception and opinions of experts or judges on the importance of indicators, which are also defined as the semi-quantitative evaluation methods. Using the quantitative methods such as EWM, ANN, PCA and factor analysis to compute the weights is more objective. Moreover, EWM, PCA and factor analysis are primarily based on the information conveyed by indicators, while the weights of the ANN model are obtained by case study after setting the learning rules or self-organizations.
On the other hand, the above methods also can be utilized to synthesize indicators for synthetic evaluation. In terms of performance assessment, AHP method is the most widely used one and has been utilized by the assessments of ICF, IDC, IBM, Korea, Japan, Australia, MoHURD, Shanghai Pudong, and Nanjing. Stanković et al. (Citation2017) employed the AHP method to determine the relative importance of criteria and then assessed 23 European cities’ smart performance through 26 indicators across five categories. They concluded that the most important criteria is employment and finance, while the least one is environment, and the final ranks of cities reflected a weak relation between smart performance and perceived satisfaction with life. Lombardi et al. (Citation2012) constructed an ANP model to analyze the four helices containing civil society, university, industry and government in the context of smart cities and discussed the priorities of four policy prototypes of smart cities, i.e. entrepreneurial city, pioneer city, livable city and connected city. Additionally, using the same model, Rad et al. (Citation2018) assigned the weights of components in smart cities and aggregated the assessments of experts with a decision-making trial and evaluation laboratory (DEMATEL) methods. Via calculating the ubiquitous coefficient and comparing related plans, they concluded that Seoul had better smart condition than Tehran. Moreover, Lazaroiu and Roscia (Citation2012) applied fuzzy logic model to assign the weights of considered indicators and evaluated the smart city conditions in Italy. They found that based on the judges’ opinion, the smart city assessment was less associated with transparent governance and availability of ICT-infrastructure. In the Chinese context, Shen et al. (Citation2018) combined Entropy method with Technique for Order Preference by Similarity to Ideal Solution (TOPSIS) to evaluate the overall smart city performance of 44 smart cities, and highlights the low-level, dimensionally unbalanced and regionally heterogeneous patterns. Li et al. (Citation2019) adopted the PCA-BP neural network assessment processing model to assess the development pattern of 35 smart cities in China, and clarified the different disparities existing in the technological innovation, smart economy, smart services, smart infrastructure, smart mobility and smart environment index among cities.
Furthermore, Self-Organizing Map (SOM) analysis is an increasingly popular quantitative statistical analysis in the modern social sciences. It is a special kind of unsupervised computational neutral network (Skupin & Agarwal, Citation2008) that combines both data projection and quantization or clustering of the input space without loss of useful information, while preserving the topological relationship in the output space (see, Colantonio & Cialfi, Citation2016; Kourtit et al., Citation2012). To visualize and assess smart city performance, Kourtit et al. (Citation2012) conducted PCA and SOM to present the static and dynamic results, and believed that most cities became more similar over time based on their smart performance data. Then, Colantonio and Cialfi (Citation2016) drew the insight that regions of northern Italy might increasingly be defined as “smart” from SOM analysis. Besides, Smart city value chain (SCVC) model (Liu et al., Citation2014), clustering analysis (Manitiu & Pedrini, Citation2016; Wu et al., Citation2016) and Hellwig’s synthetic indicators (Hajduk, Citation2018) are also sometimes performed in related research, to assess and compare the cities’ smart performance, while regression models (Caragliu & Del Bo, Citation2012; Neirotti et al., Citation2014) in related literature contribute to better understanding the influence of variables that characterize the development of a smart city.
5.2. Risk assessment
Regarding the risk assessment for smart cities, the qualitative method plays a dominant role. Fukuzawa et al. (Citation2015) using three attack models (i.e., direct attack model, indirect attack model and the group model) and meta-models to analyze both the information security psychology and risk management framework.
Similar to the performance assessment of smart cities, not only the quantitative methodologies (e.g., multi-criteria methods and fuzzy logic based methods) but also several hybrid (semi-quantitative) methods are employed in related research and of great importance in the field of risk assessment. For instance, Ullah et al. (Citation2018) employed the linear approximation, hierarchical fuzzy inference and hybrid approach to calculate the weights and finally the composite index reflecting underground risks in smart cities. Moreover, the traditional Failure Mode and Effects Analysis (FMEA) (Silva et al., Citation2014), clustering analysis (Zou et al., Citation2016), and grey FMEA (Li et al., Citation2018) are used in the studies for smart city risk assessment as well.
5.3. Construction ability assessment
However, the approaches applied to evaluate the construction ability of smart cities are relatively insufficient. Examples only include that, WEF (2001) employed the AHP method for appraisal, while Zhang et al. (Citation2017) selected Ward clustering method and decision tree C4.5 algorithm to establish construction ability evaluation model.
6. Limitations and further research directions
6.1. Limitations
The existing evaluation frameworks for smart cities have yet to be perfected, and some problems have arisen in their applications. Some notable examples and considerations can be summarized as below.
Generally, abundant attention has been paid to the performance assessment, while the lack of risk assessment and in particular construction ability assessment is significant.
Specifically, to evaluate the performance of smart cities, the first problem is related to indicators. The coverage of early national frameworks is narrow, which are lack in balancing subjective indicators with the objective ones and rely far more on the latter. Moreover, among the institutional and local standards, some evaluation systems contain too many indicators (e.g., IDC Smart City Index, Ernst & Young Smart City Index, ISO standard) resulting in poor practicality, whilst some are criticized for the local peculiarities and bad universality of detailed indicators (e.g., the criteria of EU, Shanghai Pudong and Nanjing) (Wu et al., Citation2016). Other limitations are raised in related studies, such as the effects and restraints of second-hand data sources from other assessments on the reliability of SCW ranking (Wu et al., Citation2016), the rough notion of indicators in Taiwan and ICF system making it hard for further quantification and analysis (Gong, Citation2014), and the intervention caused by subjective indicators or weights from survey or experts especially in the AHP method (see, Li et al., Citation2014; Wu et al., Citation2016). Except for the diverse indicators, most frameworks and reports are published without the weights of indices, and the non-transparent and heterogeneous weight calculations would also lower the comparability among assessing results. In summary, these echo the claim of Sharifi (Citation2019) that smart city assessment tools have achieved limited success in addressing criteria related to context sensitivity, presentation and communication of the results, uncertainty management, interlinkages, and feasibility.
With regard to the risk assessment and construction ability assessment for smart cities, lack of national framework is obvious and thus more attention should be paid to these particularly at the institutional and local levels. In addition, the indicator coverage of risk assessment is better than construction ability assessment due to the involvement of indicators on infrastructure and awareness, but the current evaluation systems of both need to be specified. Furthermore, the applied methods and empirical analysis in related assessments are far from sufficiency, so more qualitative and quantitative methodologies, especially for risk forecasting and management, are expected to be applied in the context of smart cities.
6.2. Further research directions
As the relatively well-developed domain, the national frameworks, institutional standards and local reports for smart city performance assessment contain abundant factors and indicators, which calls for better balance between subjective, objective, soft and hard indicators, and also more comparison analysis and discussion of the comparability among the evaluations. In this sense, the future standards and research are required to be more inclusive and comparable, with comprehensive but not complex index systems, standardized data, applicable and clarified computations and weights of both indicators and dimensions. These have been partly considered and realized in China’s assessing framework proposed in 2016.
In terms of the risk assessment and construction ability assessment for smart cities, the overarching national framework is needed for better understanding, reference and management, since among these two types of assessments, lack of the former would result in economic loss, and insufficient concern about the latter might lead to waste of resources and inefficient development. Moreover, the assessing indicators, data sources and research methods could be extended. For instance, given the risk assessment of underground facilities in smart cities, the applied methods can be categorized into direct and indirect. Direct method includes the visual inspection, such as cameras, CCTV, laser scanning, electromagnetic radiation based devices, acoustic method, etc. And, the indirect method is based on water auditing, flow testing and conducting soil test to identify risk (Ullah et al., Citation2018). Using such technical and smart facilities to recording the risks is a good way to expand and supplement the specific indicators for further appraisal. In addition, some widely used methodologies for risk management such as Facilitated Risk Analyze Process, Single-time Loss Algorithm, Security Attribute Evaluation Method, Hazard Impact Analysis, Probabilistic Risk Assessment (PRA), Dempster-Schafer theory of belief functions, Risk Assessment by Using Bayesian Learning Technique could be introduced in the research on smart cities. On the other hand, the indicators used for construction ability assessment are too rough. Except for the national assessing criteria, more detailed research and targeted attention on this topic are also needed. To measure the status, characteristics and potential of a city to become smarter, related assessments could link to the research on development path selection of smart cities (see, Wang et al., Citation2012; Zygiaris, Citation2013).
7. Conclusions
With the development of new technological innovations—mainly ICTs—the concept of the smart city emerges as a means to achieve more efficient and sustainable cities (Monzon, Citation2015). In academia, research on defining and assessing smart cities has been burgeoning. And in practice, not only China, a great number of economies, countries, cities and even districts around the world has regarded the smart city as the core direction and strategy of future development. In order to make proper development planning, and monitor the development of smart cities better, establishing the evaluation system is a crucial and fundamental step. This paper provides a critical and relatively comprehensive review of existing national frameworks, institutional standards, local reports and research for smart city assessment. The detailed evaluation systems and methodologies for performance assessment, risk assessment and construction ability assessment were summarized and discussed in this study.
It is concluded that, most assessing standards and research on smart city assessment focus on performance, and more attention needs to be paid to assessments of relevant risks and construction ability. More specifically, among the national and institutional frameworks, the majorities are designed to evaluate the performance and neglect the risk evaluation for smart cities. Furthermore, the indices in the existing evaluation systems on risk and construction ability need to be specified, and both data sources and research methods could be extended. These would also promote the development of related research. For the current research on smart city performance assessment, the indicator types and calculations of weights vary, resulting in the poor reliability and comparability of appraisals. In the future, based on comparative and dynamic analyses of the abundant criteria, a more inclusive and comparable framework containing the comprehensive but not complex index set, and definite computations of indicators and their weights would be the focus and research direction.
Acknowledgments
The draft of this work has once been discussed with Prof. Xiaoling ZHANG at Shenzhen Research Institute of City University of Hong Kong, and the author appreciates it greatly.
Disclosure statement
No potential conflict of interest was reported by the author(s).
Notes
1. Relevant data and information can be referred to IDC Worldwide Smart Cities Spending Guide released by International Data Corporation (2020), at: https://www.idc.com/cn/prodserv/new-research.
2. Relevant statistics can be collected in 2022 China Smart City Construction and Development Insight Report released by Tianyancha Research (Citation2022), which is partly available at: http://www.100ec.cn/home/detail–6621829.html.
3. Relevant information concerning IBM smart cities (2011) can be available at: http://www.ibm.com/ibm/smartercities/us/en/.
4. Relevant information released by Intelligent Community Forum (2011) can be available at: http://www.intelligentcommunity.org/.
5. Relevant information can be available at: https://www.idc.com/ap/smartcities/#category_nominations.
6. Relevant information is presented in Shanghai: Smart City Evaluation Index System 2.0 released by Shanghai Pudong New Area People’s Government (2012), which is available at: http://www.pudong.gov.cn/website/html/shpd/pudongNews_inform/Info/Detail_451178.htm.
References
- Adapa, S. (2018). Indian smart cities and cleaner production initiatives – integrated framework and recommendations. Journal of Cleaner Production, 172, 3351–21. https://doi.org/10.1016/j.jclepro.2017.11.250
- Ahvenniemi, H., Huovila, A., Pinto-Seppä, I., & Airaksinen, M. (2017). What are the differences between sustainable and smart cities? Cities, 60(Part A), 234–245. https://doi.org/10.1016/j.cities.2016.09.009
- Albino, V., Berardi, U., & Dangelico, R. M. (2015). Smart cities: Definitions, dimensions, performance, and initiatives. Journal of Urban Technology, 22(1), 3–21. https://doi.org/10.1080/10630732.2014.942092
- Al Sharif, R., & Pokharel, S. (2022). Smart city dimensions and associated risks: Review of literature. Sustainable Cities and Society, 77, 103542. https://doi.org/10.1016/j.scs.2021.103542
- Angelidou, M. (2014). Smart city policies: A spatial approach. Cities, 41, S3–S11. https://doi.org/10.1016/j.cities.2014.06.007
- Angelidou, M. (2015). Smart cities: A conjuncture of four forces. Cities, 47, 95–106. https://doi.org/10.1016/j.cities.2015.05.004
- Bartolacci, F., Caputo, A., & Soverchia, M. (2020). Sustainability and financial performance of small and medium sized enterprises: A bibliometric and systematic literature review. Business Strategy and the Environment, 29(3), 1297–1309. https://doi.org/10.1002/bse.2434
- Belanche-Gracia, D., Casaló-Ariño, L. V., & Pérez-Rueda, A. (2015). Determinants of multi-service smartcard success for smart cities development: A study based on citizens’ privacy and security perceptions. Government Information Quarterly, 32(2), 154–163. https://doi.org/10.1016/j.giq.2014.12.004
- Caird, S. (2018). City approaches to smart city evaluation and reporting: Case studies in the United Kingdom. Urban Research & Practice, 11(2), 159–179. https://doi.org/10.1080/17535069.2017.1317828
- Caragliu, A., & Del Bo, C. (2012). Smartness and European urban performance: Assessing the local impacts of smart urban attributes. Innovation: The European Journal of Social Science Research, 25(2), 97–113. https://doi.org/10.1080/13511610.2012.660323
- Caragliu, A., Del Bo, C., & Nijkamp, P. (2011). Smart cities in Europe. Journal of Urban Technology, 18(2), 65–82. https://doi.org/10.1080/10630732.2011.601117
- Carli, R., Dotoli, M., & Pellegrino, R. (2018). Multi-criteria decision-making for sustainable metropolitan cities assessment. Journal of Environmental Management, 226, 46–61. https://doi.org/10.1016/j.jenvman.2018.07.075
- Carli, R., Dotoli, M., Pellegrino, R., & Ranieri, L. (2013). Measuring and managing the smartness of cities: A framework for classifying performance indicators. Proceedings of the 2013 IEEE International Conference on Systems, Man, and Cybernetics, 13-16 October 2013, Manchester, UK. IEEE. https://doi.org/10.1109/SMC.2013.223
- Cohen. (2012). The top 10 smart cities on the planet. http://www.fastcoexist.com/1679127/the-top-10-smart-cities-on-the-planet.
- Colantonio, E., & Cialfi, D. (2016). Smart regions in Italy: A comparative study through self-organizing maps. European Journal of Business and Social Sciences, 5(9), 84–99.
- Cretu, L. G. (2012). Smart cities design using event-driven paradigm and semantic web. Informatica Economica, 16(4), 57–67.
- Dall’O’, G., Bruni, E., Panza, A., Sarto, L., & Kayathian, F. (2017). Evaluation of cities’ smartness by means of indicators for small and medium cities and communities: A methodology for northern Italy. Sustainable Cities and Society, 34, 193–202. https://doi.org/10.1016/j.scs.2017.06.021
- Ernst & Young Global Limited. (2016). Rapporto smart city index 2016. Retrieved January 13, 2017. http://www.ey.com/Publication/vwLUAssetsPI/EY-smart-city-index-2016/$FILE/2016-EY-smart-cityindex.pdf/
- Ferraz, F. S., & Ferraz, C. A. G. (2014). Smart city security issues: Depicting information security issues in the role of an urban environment. Proceedings of the IEEE/ACM International Conference on Utility & Cloud Computing, 8-11 December 2014, London, UK. https://doi.org/10.1109/UCC.2014.137
- Ferraz, F., Sampaio, C., Ferraz, C., Alexandre, G., & Carvalho, A. (2013). Towards a smart city security model exploring smart cities elements based on nowadays solutions. Achi.
- Fukuzawa, Y., Samejima, M., & Ujita, H. (2015). Survey on risk management based on information security psychology. In International Conference on Human-computer Interaction. Springer, Cham.
- Gaffney, C., & Robertson, C. (2016). Smarter than smart: Rio de Janeiro’s flawed emergence as a smart city. Journal of Urban Technology, 25(3), 47–64. https://doi.org/10.1080/10630732.2015.1102423
- Giffinger, R., Fertner, C., Kramar, H., Kalasek, R., Pichler-Milanovic, N., & Meijers, E. (2007). Smart cities - ranking of European medium-sized cities. Centre of Regional Science, Vienna University of Technology, http://www.smartcities.eu/.
- Gong, B. (2014). Overview on intelligent city index and evaluation methods. Inform China, 11, 38–42. https://doi.org/10.1016/j.evalprogplan.2013.08.002
- Hajduk, S. (2018). The smartness profile of selected European cities in urban management–a comparison analysis. Journal of Business Economics and Management, 19(6), 797–812. https://doi.org/10.3846/jbem.2018.6358
- Hajek, P., Youssef, A., & Hajkova, V. (2022). Recent developments in smart city assessment: A bibliometric and content analysis-based literature review. Cities, 126, 103709. https://doi.org/10.1016/j.cities.2022.103709
- Harrison, C., & Donnelly, I. A. (2011). A theory of smart cities. Proceedings of the 55th Annual Meeting of the ISSS, 55(1). https://journals.isss.org/index.php/proceedings55th/article/view/1703
- Hollands, R. G. (2008). Will the real smart city please stand up? Intelligent, progressive or entrepreneurial? City, 12(3), 303–320. https://doi.org/10.1080/13604810802479126
- Huovila, A., Bosch, P., & Airaksinen, M. (2019). Comparative analysis of standardized indicators for smart sustainable cities: What indicators and standards to use and when? Cities, 89(2019), 141–153. https://doi.org/10.1016/j.cities.2019.01.029
- ISO. (2018) . ISO/DIS 37122 sustainable cities and communities - indicators for smart cities. International Standardization Organization.
- Jiang, H. L., Jiang, P. C., Wang, D., & Wu, J. H. (2021). Can smart city construction facilitate green total factor productivity? A quasi-natural experiment based on China’s pilot smart city. Sustainable Cities and Society, 69, 102809. https://doi.org/10.1016/j.scs.2021.102809
- Jiang, W. Q., Wang, C. C., & Qi, C. C. (2018). Research on functional risk assessment model of smart city and its application. Journal of Intelligence, 37(1), 186–190.
- Kourtit, K., & Nijkamp, P. (2012). Smart cities in the innovation age. Innovation: The European Journal of Social Science Research, 25(2), 93–95. https://doi.org/10.1080/13511610.2012.660331
- Kourtit, K., Nijkamp, P., & Arribas, D. (2012). Smart cities in perspective – a comparative European study by means of self-organizing maps. Innovation: The European Journal of Social Science Research, 25(2), 229–246. https://doi.org/10.1080/13511610.2012.660330
- Lazaroiu, G. C., & Roscia, M. (2012). Definition methodology for the smart cities model. Energy, 47(1), 326–332. https://doi.org/10.1016/j.energy.2012.09.028
- Lee, J. H., Hancock, M. G., & Hu, M. C. (2014). Towards an effective framework for building smart cities: Lessons from Seoul and San Francisco. Technological Forecasting and Social Change, 89, 80–99. https://doi.org/10.1016/j.techfore.2013.08.033
- Li, X., Fong, P. S. W., Dai, S., & Li, Y. (2019). Towards sustainable smart cities: An empirical comparative assessment and development pattern optimization in China. Journal of Cleaner Production, 215, 730–743. https://doi.org/10.1016/j.jclepro.2019.01.046
- Li, N., Gong, K., & Yan, Y. (2014). Research on the evaluation index system of smart city. Standard Science, 10, 6–10. https://doi.org/10.3969/j.issn.1674-5698.2014.10.001
- Li, X. T., Li, H., Sun, B. Z., & Wang, F. (2018). Assessing information security risk for an evolving smart city based on fuzzy and grey FMEA. Journal of Intelligent & Fuzzy Systems, 34(4), 2491–2501. https://doi.org/10.3233/JIFS-172097
- Liu, J. J., Chen, N. C., Chen, Z. Q., Xu, L., Du, W. Y., Zhang, Y., & Wang, C. (2022). Towards sustainable smart cities: Maturity assessment and development pattern recognition in China. Journal of Cleaner Production, 370, 133248. https://doi.org/10.1016/j.jclepro.2022.133248
- Liu, Y., Wei, J., & Rodriguez, A. F. C. (2014). Development of a strategic value assessment model for smart city. International Journal of Mobile Communications, 12(4), 346–359. https://doi.org/10.1504/IJMC.2014.063652
- Li, G. J., Wang, Y. S., Luo, J., & Li, Y. L. (2018). Evaluation on construction level of smart city: An empirical study from twenty Chinese cities. Sustainability, 10(9), 3348. https://doi.org/10.3390/su10093348
- Lombardi, P., Giordano, S., Farouh, H., & Yousef, W. (2012). Modelling the smart city performance. Innovation: The European Journal of Social Science Research, 25(2), 137–149. https://doi.org/10.1080/13511610.2012.660325
- Manitiu, D. N., & Pedrini, G. (2016). Urban smartness and sustainability in Europe. An ex ante assessment of environmental, social and cultural domains. European Planning Studies, 24(10), 1766–1787. https://doi.org/10.1080/09654313.2016.1193127
- Martinez-Balleste, A., Perez-Martinez, P. A., & Solanas, A. (2013). The pursuit of citizens’ privacy: A privacy-aware smart city is possible. IEEE Communications Magazine, 51(6). https://doi.org/10.1109/MCOM.2013.6525606 136–141
- Monzon, A. (2015). Smart cities concept and challenges: Bases for the assessment of smart city projects. Proceedings of the International Conference on Smart Cities & Green Ict Systems, 20-22 May 2015, Lisbon, Portugal. IEEE.
- Neirotti, P., De Macro, A., Cagliano, A. C., Mangano, G., & Scorrano, F. (2014). Current trends in smart city initiatives: Some stylised facts. Cities, 38, 25–36. https://doi.org/10.1016/j.cities.2013.12.010
- Orejon-Sanchez, R. D., Crespo-Garcia, D., Andres-Diaz, J. R., & Gago-Calderon, A. (2022). Smart cities’ development in Spain: A comparison of technical and social indicators with reference to European cities. Sustainable Cities and Society, 81, 103828. https://doi.org/10.1016/j.scs.2022.103828
- Patrão, C., Moura, P., & De Almeida, A. T. (2020). Review of smart city assessment tools. Smart Cities, 3(4), 1117–1132. https://doi.org/10.3390/smartcities3040055
- Rad, T. G., Sadeghi-Niaraki, A., Abbasi, A., & Choi, S. M. (2018). A methodological framework for assessment of ubiquitous cities using anp and dematel methods. Sustainable Cities and Society, 37(2018), 608–618. https://doi.org/10.1016/j.scs.2017.11.024
- Research, T. (2022). China smart city construction and development insight report. http://www.100ec.cn/home/detail–6621829.html
- Sen, M., Dutt, A., Agarwal, S., & Nath, A. (2013). Issues of privacy and security in the role of Software in smart cities. In 2013 International Conference on Communication Systems and Network Technologies. https://doi.org/10.1109/CSNT.2013.113.
- Sharifi, A. (2019). A critical review of selected smart city assessment tools and indicator sets. Journal of Cleaner Production, 233, 1269–1283. https://doi.org/10.1016/j.jclepro.2019.06.172
- Sharifi, A. (2020). A typology of smart city assessment tools and indicator sets. Sustainable Cities and Society, 53, 101936. https://doi.org/10.1016/j.scs.2019.101936
- Sharifi, A., Khavarian-Garmsir, A. R., Allam, Z., & Asadzadeh, A. (2023). Progress and prospects in planning: A bibliometric review of literature in urban studies and regional and urban planning, 1956–2022. Progress in Planning, 173, 100740. https://doi.org/10.1016/j.progress.2023.100740
- Shen, L. Y., Huang, Z. H., Wong, S. W., Liao, S. J., & Lou, Y. L. (2018). A holistic evaluation of smart city performance in the context of China. Journal of Cleaner Production, 200, 667–679. https://doi.org/10.1016/j.jclepro.2018.07.281
- Silva, M. M., De Gusmão, A. P. H., Poleto, T. E., Silva, L. C., & Costa, A. P. C. S. (2014). A multidimensional approach to information security risk management using FMEA and fuzzy theory. International Journal of Information Management, 34(6), 733–740. https://doi.org/10.1016/j.ijinfomgt.2014.07.005
- Skupin, A., & Agarwal, P. (2008). Introduction: What is a Self-Organizing Map? In Self‐Organising Maps: Applications in Geographic Information Science. John Wiley & Sons, Ltd. https://doi.org/10.1002/9780470021699.ch1
- Stanković, J., Džunić, M., Džunić, Z., & Marinković, S. (2017). A multi-criteria evaluation of the European cities’ smart performance: Economic, social and environmental aspects. Zbornik Radova Ekonomskog Fakultet Au Rijeci, 35(2), 519–550. https://doi.org/10.18045/zbefri.2017.2.519
- Thite, M. (2011). Smart cities: Implications of urban planning for human resource development. Human Resource Development International, 14(5), 623–631. https://doi.org/10.1080/13678868.2011.618349
- Ullah, I., Fayaz, M., & Kim, D. (2018). Analytical modeling for underground risk assessment in smart cities. Applied Science, 8(6), 921. https://doi.org/10.3390/app8060921
- Wang, L., Wu, Y. D., & Li, Y. B. (2012). Comparative path analysis on smart city construction. Journal of Engineering Management, 26(5), 34–37.
- Wu, Z. Q., Pan, Y. H., Ye, Q. M., & Kong, L. Y. (2016). The city intelligence quotient (city IQ) evaluation system: Conception and evaluation. Engineering, 2(2), 196–211. https://doi.org/10.1016/J.ENG.2016.02.009
- Zhang, Z. Q. Y., Zou, K., Xiang, S., & Mao, T. T. (2017). Model construction and empirical study on smart city construction ability assessment. Science and Technology Management Research, 2, 73–76. https://doi.org/10.3969/j.issn.10007695
- Zheng, C. J., Yuan, J. F., Zhu, L., Zhang, Y. J., & Shao, Q. H. (2020). From digital to sustainable: A scientometric review of smart city literature between 1990 and 2019. Journal of Cleaner Production, 258, 120689. https://doi.org/10.1016/j.jclepro.2020.120689
- Zou, K., Xiang, S., Zhang, Z. Q., & Mao, T. T. (2016). Model construction and empirical study on smart city information security risk assessment. Library and Information Service, 60(7), 19–24.
- Zygiaris, S. (2013). Smart city reference model: Assisting planners to conceptualize the building of smart city innovation ecosystems. Journal of the Knowledge Economy, 4(2), 217–231. https://doi.org/10.1007/s13132-012-0089-4