
 ?Mathematical formulae have been encoded as MathML and are displayed in this HTML version using MathJax in order to improve their display. Uncheck the box to turn MathJax off. This feature requires Javascript. Click on a formula to zoom.
Abstract
This paper investigates the impact of fiscal consolidation in different states on domestic government debt in South Africa. The government budget constraint theoretical framework and Markov-switching dynamic regression (MSDR) from 1979 to 2022. The contribution of this paper is to examine fiscal consolidation on domestic government debt in different states using measures of fiscal consolidation that account for time-varying elasticity in the cyclical adjusted primary balance (CAPB). The U-shape is found which indicates that fiscal consolidation is effective in reducing domestic government debt at a low level. However, as domestic government debt reaches a high-level fiscal consolidation becomes detrimental and further increase domestic government. Given the result, it recommended that South Africa use less fiscal consolidation in the effort to reduce domestic government debt. Fiscal authorities need to use government expenditure in the productive sector of the economy that will bring about an increase in revenue rather than an increase in the tax rate as advocated in the fiscal consolidation policy. Moreover, develop a tax system that generates optimal tax revenue with adjustment of the tax rates.
1. Introduction
Fiscal consolidation is a fiscal policy that seeks to reduce government debt through spending cuts and revenue increases. The thinking around fiscal consolidation is that government expenditure cuts and tax increases will result in a decrease in debt. In the present, forward-looking economic agents will anticipate a reduction in tax and interest rates. This will reduce the debt services cost, increase permanent income as well crowd in investment; as such, there will be an increase in economic activities, leading to higher economic growth and higher tax collection that can be used to reduce government debt (Alesina & Ardagna, Citation2010; Mankiw, Citation2019). Fiscal consolidation is very important to debt sustainability because excessive debt levels can have negative consequences for an economy. When a government spends more money than it collects in revenue, it needs to borrow to cover the difference. Over time, this can lead to a buildup of debt that becomes increasingly difficult to manage. As debt levels rise, so do the costs of servicing that debt in the form of interest payments. This can lead to a situation where a government is spending more on debt services than it is on providing essential public services. One of the broad measures of discretionary government intervention to reduce the government debt that defines fiscal consolidation episodes is the cyclically adjusted primary balance (CAPB). The measure is concerned with the identification of discretionary fiscal policy changes in tax and government expenditure by filtering out changes that are due to economic fluctuations in tax as well as government expenditure (Alesina et al., Citation2019). Fiscal consolidation can help to prevent this by reducing the government’s budget deficit and stabilising its debt levels. This can help to reduce the costs of servicing debt over the long term and ensure that government resources are directed towards important public services and investments rather than interest payments on debt. However, it’s important to note that the timing and manner in which fiscal consolidation is implemented can have significant implications for economic growth and social welfare. A poorly designed consolidation strategy that focuses solely on cutting spending can lead to short-term economic contraction and social hardship, which can ultimately undermine the sustainability of the government’s finances. Therefore, any fiscal consolidation strategy should be carefully designed and implemented in a way that supports long-term economic growth and social well-being while also ensuring debt sustainability.
Figure reflects government debt share to GDP in South Africa overtime, it is noted that government debt has reflected upwards as well as downward swings from 1979 to 2022. The domestic government debt before democracy in 1994 is characterised by the variation cycle, which ranges between 29% and 41.80% (SARB, Citation2022). In the apartheid era, the government relied heavily on debt to finance its policies of racial segregation and oppression, resulting in a significant increase in public debt. The end of apartheid led to a brief period of debt relief as the international community forgave much of South Africa’s debt. After 1994, domestic government debt increased until it reached a rate of 44.66% in 1999 due to new government programmes. In the early 2000s government debt levels began to rise again due to factors such as increased government spending, declining tax revenue, and a growing trade deficit. South Africa’s debt levels surged during the 2008 global financial crisis as the government implemented a stimulus package to mitigate the impact of the crisis on the economy.
Figure 1. Government debt share to GDP in South Africa.
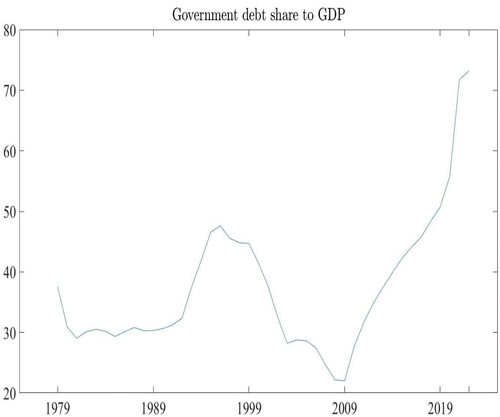
Government debt in the year 2010 reached a peak of around 31% of GDP. In the year 2018 government debt levels surpassed the 47% of GDP mark again, leading to concerns about the sustainability of the country’s debt. In the year 2020, the COVID-19 pandemic led to a significant increase in government spending, causing South Africa’s debt levels to surge to over 68% of GDP. The domestic government debt continues to increase until it reaches a rate of 71.72% in 2021 (SARB, Citation2022). This rate of 71.72% is the rate that is above the 60% threshold that is advocated by the Southern African Development Community (SADC, Citation2006). Protocol on Finance and Investment (PFI), which stipulates that all member countries should have a rate of government debt share to GDP that is equal to or below 60% (Buthelezi & Nyatanga, Citation2018; SADC, Citation2006).
At a policy level in South Africa (SA), fiscal authorities have made policy interventions to curb government debt. These interventions include the Public Finance Management Act of 1999 (PFMA), which advocates expenditure control. In 2012, the government introduced the expenditure ceiling to constrain high government debt, as such government committed to limiting real expenditure growth to an average of 2.9% per year (BR, Citation2012). In 2013, the government introduced cost-containment measures and cut expenditures on non-core goods and services, which amounted to R1.5 billion between 2013 and 2014 (BR, Citation2013). In 2014, the Financial and Fiscal Commission (FFC) recommended more fiscal consolidation stances to restore the fiscal position and reduce government debt (BR, Citation2014). The FFC recommendation outlined that, “Fiscal consolidation can no longer be postponed. Ensuring continued progress towards a better life obliges the government to safeguard public finances by acting within fiscal limits that can be sustained over the long term. To do otherwise would risk exposing the country to a debt trap, with damaging consequences for development for many years to come” (MTBPS, Citation2014). The Fiscal Responsibility Bill (FRB) was tabled for discussion in the parliament of SA in 2018. The bill seeks to introduce government expenditure cuts, limit new government borrowing, maintain an expenditure ceiling and eliminate wasteful expenditure (FRB, Citation2018). In the year 2019, the International Monterey Fund (IMF), Standard and Poor’s, Moody’s and Fitch stressed that SA needed to implement a credible fiscal strategy and fiscal consolidation to contain the rise in government debt. This recommendation came with concern that the country is faced with high government debt and that there is policy uncertainty (IMF, Citation2020).
South Africa was selected for investigation because fiscal authorities have shown interest in the adoption of fiscal consolidation in the effort to reduce government debt, however, there is limited research on the topic (BR, Citation2015, Citation2017, Citation2018, Citation2020; MTBPS, Citation2014, Citation2017). On the other hand, there is no consensus among scholars on the impact of fiscal consolidation on government debt. Case in point Alesina and Perotti (Citation1995), Blanchard (Citation1990), Brady and Magazzino (Citation2018), Marattin et al. (Citation2022), David et al. (Citation2022), and Afonso and Leal (Citation2022) among others found that fiscal consolidation reduces government debt. While Müller (Citation2014), Deskar-Škrbić and Milutinović (Citation2021), and Georgantas et al. (Citation2023) among others outline that fiscal consolidation increases government debt therefore it is self-defeating. As such, it is critical to have a country-based investigation to find out the impact of fiscal consolidation. In the effort to find the solution to the problem of high government debt, scholars like Agnello et al. (Citation2019) and Nunes (Citation2019) have investigated the success of fiscal consolidation (the after-effect of fiscal consolidation) on government debt. Hansen (Citation2000), Eyraud and Weber (Citation2013), Gechert and Rannenberg (Citation2015), Auerbach and Gorodnichenko (Citation2017), Quaresma (Citation2021), Olaoye and Olomola (Citation2022), and Marattin et al. (Citation2022) among others have looked at the nonlinearity, and the long and short-run effect of fiscal consolidation on government debt. The investigation of the impact of fiscal consolidation in different regimes has not been fully explored. This paper fills this gap in the body of knowledge, with the selected county being South Africa, with the identified problem being that there has been a cyclical movement of domestic government debt. The fluctuation reflects that there is some level of instability in domestic government debt. As such, it is critical to investigate the effect of fiscal consolidation in different regimes of domestic government debt. This paper uses the time-varying elasticity CPAB data by Buthelezi (Citation2023b). With the data this paper investigates the impact of fiscal consolidation coming from government expenditure, tax and both sides of the fiscal instrument with is expenditure and tax.
The economic question of the paper is what is the impact of fiscal consolidation using government expenditure to cut government debt in different regimes? What is the impact of fiscal consolidation using tax increases on government debt in different regimes? What is the impact of the policy mix of fiscal consolidation on government debt in different regimes? How long will the regime of domestic government debt run? What is the probability of transition to different regimes of domestic government debt given the presence of fiscal consolidation? The purpose of this paper is to investigate the impact of fiscal consolidation on domestic government debt in different regimes in South Africa. The paper employs Markov-switching dynamic regression (MSDR) using time-series data from 1979 to 2022. The contribution of this paper is to examine fiscal consolidation on domestic government debt in different regimes using measures of fiscal consolidation that account for time-varying elasticity. We found that fiscal consolidation using government expenditure cuts increases government debt. The impact of fiscal consolidation using tax increases on government debt was found to be insignificant. The policy mix of fiscal consolidation was found to increase government debt. We found three regimes of domestic government debt. In the first regime, fiscal consolidation reduces domestic debt, and in the second and third regimes, fiscal consolidation increases domestic government debt by 0.083% and 0.09%, respectively. This result reflects a U-shape impact of fiscal consolidation on domestic government debt. It is recommended that South Africa move away from the implementation of fiscal consolidation.
The rest of the paper highlights the following. Firstly, section 2 outlines the literature which includes a discussion of the theoretical literature review and empirical review of the impact of fiscal consolidation on government debt. Secondly, section 3 discusses the methodology. Thirdly, section 4 discusses descriptive statistics and empirical results. Finally, section 5 outlines the conclusion of the paper.
2. Literature review
2.1. Theoretical review related to fiscal consolidation
Theoretically, the Classical school of thought advocates that fiscal consolidation based on tax increases results in less production as taxes increase the cost of doing business. On the other hand, when fiscal consolidation is based on a government expenditure cut, this will crowd in investments (Buthelezi, Citation2023b; Mankiw, Citation2019). The traditional Keynesian model with sticky nominal wages and prices advocates that there are detrimental effects on economic growth that are induced by fiscal consolidation as it limits the government from spending on economic activities that can boost economic growth (Buthelezi, Citation2023a; Mankiw, Citation2019). The Ricardian Equivalence theorem argues that economic agents are forward-looking, meaning that an increase in government expenditure financed by debt triggers an expectation of higher taxes in the future. As such there will be less consumption in the current period. The fiscal consolidation rationale outlines that the acceptance of the Ricardian Equivalence suggests that the opposite is true. That is, if the government decides to make cuts (fiscal consolidation), people will recognise that there will be lower taxes in the future and therefore will spend more today (Buthelezi, Citation2023a; Deskar-Škrbić & Milutinović, Citation2021; Mankiw, Citation2019). The government budget constraint theory outlines that the government’s spending is limited by its ability to raise revenue. The theory assumes that the government has a limited amount of resources and can only spend what it can afford. Therefore, if the government wants to increase spending, it must find ways to raise revenue, such as through taxes or borrowing (Buthelezi, Citation2023b; Mankiw, Citation2019).
2.2. Empirical literature view of fiscal consolidation
Scholars have examined fiscal consolidation success using diverse criteria including Alesina and Perotti (Citation1995), Blanchard (Citation1990), Giavazzi and Pagano (Citation1995), McDermott and Wescott (Citation1996), Alesina (Citation1998) and Duperrut (Citation1998). Alesina and Perotti (Citation1995) define success as achieving a gross debt-to-GDP reduction of 5% through very tight fiscal policies. Alesina and Perotti (Citation1995) define the success of fiscal consolidation as changes in fiscal policy that are very tight, resulting in a gross debt share to GDP threshold that is 5% lower than the initial share. There were 66 successful fiscal episodes from 20 OECD countries between 1990 to 1992, and 14 episodes were very tight. Blanchard (Citation1990) filters out the cyclical movement to find a dictionary change that can be attributed to fiscal consolidation. Using a vector autoregressive model on 14 OECD countries from 1970 to 1985, it was found that in very tight years, taxes increased by 1.2% of GDP, and spending was cut by 0.79% of GDP. The success of fiscal consolidation is possible when implemented mainly through government expenditure cuts. Giavazzi and Pagano (Citation1995) use a defined approach in 20 Europe countries from 1970 to 1990, where fiscal consolidation is deemed when there is a cumulative change in the CAPB that is at least 5%, 4%, and 3% points of GDP in years 4, 3, and 2. They found 223 fiscal consolidation episodes using this definition. It was noted that countries in the 1990s were adopting government expenditure cuts and tax increases to reduce the government debt ratio to gross domestic product. The definition of a fiscal consolidation episode by McDermott and Wescott (Citation1996) was based on the threshold of a 1.5% increase in GDP over 2 years in 21 OECD countries from 1970 to 1995. There were 74 episodes based on revenue increases and 34 based on expenditure cuts. In a probit model, it was found that government expenditure cuts of government wages result in a 3.22% fall in government debt. These results suggest that government expenditure cut-based fiscal consolidations are more likely to be successful in reducing government debt. The CAPB threshold of a 2% or 1.05% increase in the share of GDP for two consecutive years by Alesina et al. (Citation1998) in 18 OECD countries from 1965 to 1995 was undertaken as the rationale to define fiscal consolidation episodes. The fiscal consolidation was deemed to be successful if the primary deficit had a threshold that was 2% below the GDP in the year of the tight policy. Using these thresholds, the authors found 51 fiscal consolidation episodes, 19 of which were deemed to be successful, while 23 had an expansionary effect on economic activities in OECD economies characterised by low unemployment. Duperrut (Citation1998) found that in South Africa from 1973 to 1997, fiscal adjustments were defined as a one-year improvement in the primary balance of the general government of more than 1.5% of GDP. It was found that there are episodes with 2 successfully representing 22.22% success. If the fiscal adjustment is of reasonable size, there is between a 1.5% and 2% negative impact on GDP.
Fiscal consolidation and its effectiveness in reducing government debt have been examined Hansen (Citation2000), Burger and Jimmy (Citation2006), Eyraud and Weber (Citation2013), Lodge and Rodríguez-Vives (Citation2013), Calitz, Du Plessis et al. (2014), Gechert and Rannenberg (Citation2015) and Yang, Fidrmuc et al. (2015). Hansen (Citation2000), defines the success of the fiscal adjustment when the CAPB threshold improves by 2.5% or there is an improvement of 2% for at least two consecutive years in 18 OECD from 1980 to 1998. It was found that there are 39 fiscal consolidation episodes. The authors used the OLS model and found a 4.55% fall in government debt share to GDP in the representation of fiscal consolidation programmes in OECD countries. The investigation of whether South Africa should have a fiscal rule was undertaken by Burger and Jimmy (Citation2006) using the Markov-switching dynamic regression from 1980 to 2003. It was found that there are two regimes of government debt with a mean of 27.4% and a value of 67% with transition probabilities of 0.925% and 75%, respectively. The use of standard VAR was utilised by Eyraud and Weber (Citation2013) to examine fiscal consolidation from 1970 Q1 and 2012 Q1 in OECD economies. It was found that a fiscal tightening of 1% at a high level of debt-to-GDP ratio results in an initial rise of the debt-to-GDP ratio by 1 percentage point. Although this effect is not long-lasting and debt eventually declines, it could be an issue if financial markets focus on the short-term behaviour of the debt ratio. Factors that sustain fiscal consolidations were examined by Lodge and Rodríguez-Vives (Citation2013) in 20 advanced economies over the period from 1970 to 2010. With the estimation of the estimating hazard functions, it was found that fiscal consolidation takes a long time to have an effect when initial public debt is high. The examination of fiscal sustainability in South Africa was undertaken by Calitz et al. (Citation2014) from 1974 to 2010 using the structural VAR model. It was found that unless the authorities take prompt action to control large budget deficits and reduce the burden of public debt as they have done in the past, the discretionary fiscal decisions made between 2007 and 2010 could endanger the long-term sustainability of fiscal policy. A qualitative analysis by Müller (Citation2014) looked at an empirical analysis of fiscal consolidation on government debt done from 1975 to 2008 in 17 OECD countries. It was found that fiscal consolidation was said to be no cure for government debt and likely to be self-defeating when sovereign risk is high. The combination of fiscal multipliers and meta-regression analysis was undertaken by Gechert and Rannenberg (Citation2015) to examine the costs of Greece’s fiscal consolidation between 2010 and 2014. The results suggested that it was the wrong time to implement fiscal consolidation through government spending cuts due to their strong multipliers in downturns. However, it was going to be much more effective at lowering the debt-to-GDP ratio. The macroeconomic effects of fiscal consolidation were examined by Yang et al. (Citation2015) using the 20 OECD countries from 1970 to 2009. Fiscal consolidation was proxied by CAPB, and the VAR model was utilised. It was found that fiscal consolidation results increase government debt.
These studies shed light on the intricate dynamics of fiscal consolidation found in Baharumshah, Jibrilla et al. (2016), Auerbach and Gorodnichenko (Citation2017), Brady and Magazzino (Citation2018), Agnello, Castro et al. (2019), and Nunes (Citation2019). The investigation of the public revenue-expenditure nexus in South Africa was undertaken by Baharumshah et al. (Citation2016) between 1960 and 2013. Using the nonlinear error-correction model it was found that the fiscal synchronisation hypothesis of government revenues and expenditures for long-run and short-run dynamic equilibrium indicates that the South African fiscal authorities should try to maintain or even improve the control of their fiscal policy instruments to sustain the prudent budgetary process. The fiscal consolidation policy of government expenditure cuts reduces government debt. According to Auerbach and Gorodnichenko (Citation2017), fiscal consolidation of the government expenditure cut was found to result in a 2.80% fall in government debt in the boom period. The shock of fiscal consolidation of government expenditure does not lead to persistent increases in debt-to-GDP ratios or costs of borrowing, especially during periods of economic weakness. The sustainability of Italian public debt was investigated by Brady and Magazzino (Citation2018) from 1862 to 2013 using Markov-switching dynamic regression. It was found that different regimes of high government debt fiscal rules can be successful in the event of a build-up in public debt. A competing risks tale on successful and unsuccessful fiscal consolidations investigation by Agnello et al. (Citation2019) was undertaken for 7 industrial countries over the period 1975 to 2013. It was found that economic and political factors, the size and typology of fiscal adjustments and the occurrence of crises explain the differences in the length and the success/failure of fiscal consolidations to reduce government debt. Nunes (Citation2019) used 28 OECD nations between 1978 and 2017 to investigate public spending’s influence on the success of fiscal consolidation using the probit model. It was found that there is a 47.67% chance of successful fiscal consolidation through government expenditure.
The researchers that explored different facets of fiscal consolidation types, the role of policy mix, and the timing include Glavaški and Beker-Pucar (Citation2020), de Rugy and Salmon (Citation2020), Ardanaz, Hallerberg et al. (2020), Kalbhenn and Stracca (Citation2020), Nakatani (Citation2021), Deskar-Škrbić and Milutinović (Citation2021) and Quaresma (Citation2021). Glavaški and Beker-Pucar (Citation2020) investigated episodes of fiscal consolidation using the autoregressive distributed lag (ARDL) model from 1950 to 2018. It was found that the cyclically adjusted primary budget balance in GDP increases by 1%, and the real economic growth in western China will grow by 0.26%. This means that fiscal consolidation has a positive impact on economic growth in this region. de Rugy and Salmon (Citation2020) investigated large fiscal consolidations in 26 countries from 1995 to 2018 in 26 countries. They found 62 successful consolidations and 73 unsuccessful consolidations. They found that there were 45 expenditure-based fiscal consolidations (EB) episodes, and more than half were successful, while there were 67 tax-based fiscal consolidations (TB) episodes in which less than 4 in 10 were successful. Ardanaz et al. (Citation2020) examined fiscal consolidations if the policy mix matters in Latin America from 1985 to 2018. The probit fixed effect model was used, and it found that 42% explain the importance of fiscal consolidation policy mix matter. There is less applicability of fiscal consolidation during the time of the election of political parties. The definition of a 2% CAB increase in 2 years was used by Kalbhenn and Stracca (Citation2020) to define fiscal consolidation episodes in 26 European Union countries from 1997 to 2017. Using the structural VAR it was found that the fiscal consolidation shock resulted in an increase in government debt in the first year and thereafter started to fall below equilibrium. The fiscal rule investigated by Nakatani (Citation2021) in 9 Pacific island states during the period from 1990 to 2018 found that when there is fiscal consolidation or fiscal rule in economies that are experiencing natural disasters and climate change, in the long run, government debt turns to increase. Deskar-Škrbić and Milutinović (Citation2021) used a small short-term semi-structural macro-econometric model of the Croatian economy from 2014 to 2016. The result indicated that the fiscal consolidation implemented during the excessive deficit procedure is self-defeating as it increases government debt. In 14 European Union countries over the period 1970 to 2019, Quaresma (Citation2021) combines the narrative technique with the standard CAPB method for identifying fiscal consolidations. The fixed effect model reflects that fiscal consolidation couple with a monetary expansion produces little evidence of non-Keynesian effects or reduction in government debt.
Studies that cover aspects of fiscal consolidation and its impact on government debt across different regions Olaoye and Olomola (Citation2022), Marattin, Nannicini et al. (2022), Afonso, Alves et al. (2022), David, Guajardo et al. (2022), Afonso and Leal (Citation2022), Lahiani, Mtibaa et al. (2022) and Georgantas, Kasselaki et al. (2023). Olaoye and Olomola (Citation2022) analysed the public debt structure of Sub-Saharan Africa’s five largest economies, including South Africa. The Markov-switching model was used, and it was found that the first regime of South Africa had 31.43% and 45.71% in the second regime with the expected duration of 13 and 10 years in the respective regimes. Marattin et al. (Citation2022) investigated revenue-expenditure-based fiscal consolidation in 20 regions in Italy using a difference-in-difference model. They provided evidence that there is a pass-through of fiscal consolidation to reduce government debt. The structural models of Afonso et al. (Citation2022) were used in the world economic outlook data based on the International Monetary Fund (IMF) with a sample of 174 countries between 1970 to 2018. There was evidence that fiscal consolidation improves the degree of public financial sustainability in advanced and developing economies. A panel VAR system was used by David et al. (Citation2022) in 21 emerging market and developing economies (EMDEs) from 2000 to 2018. They provided evidence that fiscal consolidation announcements, particularly if made by the government in a country with elevated vulnerability to government debt, have been successful in ameliorating default risk perceptions. In 17 OECD countries from 1970 to 2018, Afonso and Leal (Citation2022) examined fiscal consolidation episodes using a narrative approach and 1.5% CAPB change to identify fiscal consolidation episodes. It was found that countries with debates below 60% of GDP have a more successful result to recede debt than does with higher debt. An investigation of 23 emerging and middle-income countries for the 2009 to 2018 period by Lahiani et al. (Citation2022) using the GMM model outlines the improvement of government debt and current account when fiscal consolidation is adopted in the medium as well as the long term. The panel data investigation of 24 OECD countries from 1990 to 2021 by Georgantas et al. (Citation2023) found 257 cases of fiscal consolidation episodes out of 519 data points. Using the probit model, they noted evidence that fiscal consolidation through government spending in recessions, with tight monetary conditions and when the debt ratio is above 80% is self-defeating as it further increases government debt. Buthelezi (Citation2023b) investigated the impact of government expenditure on economic growth in different states in South Africa. It was found that government expenditure increases economic growth. However, the study was silent on the role of fiscal consolidation on economic growth in South Africa. Nevertheless, this study suggests that there are times in the economy when fiscal consolidation may not the relevant. This is back positive effect of an increase in government expenditure on economic growth, while fiscal consolidation advocates for a decrease in government expenditure. Buthelezi and Nyatanga (Citation2023b) investigated macroeconomic uncertainty on economic growth in the presence of fiscal consolidation in South Africa using the time-varying parameter vector autoregression (TVP-VAR) from 1994 to 2022. It was found the macroeconomic uncertainty in the representee of fiscal consolidation has a negative impact on economic growth. Buthelezi and Nyatanga (Citation2023a) investigated the threshold of the cyclical adjusted primary balance (CAPB) that can be attributed to fiscal consolidation in South Africa using the threshold autoregressive regime (TAR) from 1979 to 2022. It was found that the threshold of −1.28168%, 1.9182%, and 1.9270% for the CAPB of total government revenue increase, government expenditure cut, and the CAPB as a sum of both revenue and expenditure, respectively can be attributed to fiscal consolidation episodes. Buthelezi and Nyatanga (Citation2023c) investigated the threshold impact of government debt on economic growth in the presence of fiscal consolidation in South Africa from 1979 to 2022. The autoregressive threshold regime (TAR) model and two-stage least squares (2SLS) are used. The TAR provides evidence with the consideration of fiscal consolidation, there is evidence of the U-shape impact of domestic government debt on gross domestic product per person.
3. Methodology
This paper uses quantitative analysis to investigate the question of interest, and yearly time series data from South Africa from 1979 to 2022. The economic variables used are reflected in Table .
Table 1. Economic variables used
The data of ,
, and
is sourced from Buthelezi and Nyatanga (Citation2023a). This is the data of Buthelezi and Nyatanga (Citation2023b) we developed in the paper to improve the methodology of the Internation Monetary Fund (IMF) of calculating CAPB to proxy fiscal consolidation with contact elasticity to time-varying elasticity. The IMF calculation is reflected in EquationEquation 1
(1)
(1) .
EquationEquation 1(1)
(1) is the cyclical adjusted primary balance (CAPB), where y is nominal GDP, Y is the growth of nominal potential of GDP, which is estimated based on the country-specific production functions G government expenditure TR aggregate tax revenue
and
is the elasticity for revenue and government expenditure, respectively. The CAPB reflects the reaction function of the fiscal authorities in response to government debt through increasing tax and government expenditure cuts. It is important to note that elasticity is given by
and
is the constant elasticity of government revenue as well as government expenditure. The time-varying elasticity is reflected in Equations (2) to (4).
In EquationEquations (3(3)
(3) -Equation4
(4)
(4) ) Buthelezi and Nyatanga (Citation2023a) converted constant elasticity to time-varying elasticity where
and
with the key distinction being the
time subscript reflecting the time-varying elasticity. The model that is adopted in this paper is the Markov-switching dynamic regression model (MSDR) because it provides attractive features of transition over a set of finite regimes (Hansen, Citation1996). The MSDR model is used because government debt in South Africa has exhibited cyclical movements over the years. Therefore, the MSDR model is appropriate for fiscal consolidation and may be applicable based on the changes in economic conditions. During a period of less government debt, the government may adopt a regime that emphasises fiscal stimulus to maintain momentum. However, with high government debt government may shift to a regime that emphasises fiscal consolidation to reduce debt, and deficits and stabilise the economy. By using the Markov-switching model, we can analyse whether the impact of fiscal consolidation on government debt varies across different economic regimes. Other scholars that have used the model include (Burger & Jimmy, Citation2006, Burger & Marinkov, Citation2012, Burger et al., Citation2012, Burger et al., Citation2016 among others, to investigate the impact of fiscal consolidation on government debt.
3.1. Theoretical framework and model specification
This paper adopts the government budget constraint and outlines that the government can spend an amount equal to the tax receipt or less (Mankiw, Citation2019). The government budget constraint in the closed economy can be reflected in EquationEquations 5(5)
(5) and Equation6
(6)
(6) ).
The right-hand side of EquationEquation 5(5)
(5) reflects expenditure, and the left side reflects revenue. where g is the government expenditure,
is the government debt service payment,
is the government total revenue,
is the domestic government debt and
is the money supply proxied by
money in the economy. Domestic government debt is explained by the components of the government budget constraint; this can be reflected in EquationEquation 6
(6)
(6) . Markov-switching dynamic regression is used for series that are believed to transition over a finite set of unobserved regimes, allowing the process to evolve differently in each regime. The transitions occur according to a Markov process. The time of transition from one regime to another and the duration between changes in the regime are random (Hansen, Citation1996, Citation2000). If given an economic data series denoted by
, where
, is characterised by two regimes, such economic data series can be present in EquationEquation 7
(7)
(7) and EquationEquation 8
(8)
(8) ).
where and
are the intercept terms in regime 1 and regime 2, respectively, and ϵt is a white noise error with variance
. The two-regime model shifts in the intercept term (Hamilton, Citation1989, 1990). If the timing of switches is known, the above model can be expressed as in EquationEquation 9
(9)
(9) .
The subscript is 1 if the process is in regime 1 and 0 otherwise. Markov-switching regression models allow the parameters to vary over the unobserved regimes. The MSDR model with a regime-dependent intercept term is reflected in question (10).
where is the parameter of interest;
when
, and
when
. The probabilities of being in each regime can be estimated with transition probabilities. One-step transition probabilities are given by
, so for a two-regime process,
denotes the probability of staying in regime 1 in the next period given that the process is in regime 1 in the current period. Likewise,
and
denote the probability of staying in regime 2 and regime 3, respectively (Hansen, Citation1996, Citation2000). The transition probabilities from one regime to another can be presented in matrix (11).
The theoretical framework outlined in EquationEquation 6(6)
(6) is then extended in the Markov-switching dynamic regression, as reflected in EquationEquations 12
(12)
(12) -Equation14
).
4. Econometric results
Table shows descriptive statistics of economic variables from 1979 to 2022. The gd domestic government debt is found to have a mean of 37.22%. The level of government expenditure is found to have an average of 27.94% between 1979 and 2022. Total government revenue is found to have a growth rate mean of 14.32%. The supply of money, which is proxied by
is found to have an index value of 12.79 over the period. The GDP per person growth rate is found to be 0.25% between 1979 and 2022 on average. Last, the economic variable that is considered from the sourced data
the government debt served is found to have a mean growth rate of 3.4% in the period of analyses. The average values are relatively lower than those found in the time-invariant elasticity. The
time-varying CAPB for total government revenue,
time-varying CAPB for government expenditure, and the
time-varying CAPB are found to have mean values of −1.35%, 5.25%, and 6.61%, respectively.
Table 2. Descriptive statistics of the data sourced and estimated
Table reflects the Markov chain dynamic regression model from 1979 to 2022. In the first regime model estimation 1 of the domestic government debt, it is found to have a mean of 30.15%, which is statistically significant at a 1% p-value. Olaoye and Olomola (Citation2022) found 31.43% in this regime. In regime 1 estimation 2, it is found that a 1% increase in the
debt service ratio results in a 3.1% increase in domestic government debt. On the other hand, it is found that in regime 1, a 1% increase in the money supply
results in a 0.6% decrease in domestic government debt. Regime 1, estimation 2, reflects fiscal consolidation
through an increase in tax increase domestic government debt. These results are in line with the classical school of thought (Mankiw, Citation2019).
Table 3. Markov-switching dynamic regression from 1979 to 2022
On the other hand, in regime 1, estimations 3 and 4 reflect fiscal consolidation of government expenditure cuts and tvp_elstcy_CAPB fiscal consolidation that use synchronised expenditure cuts and tax increases in domestic government debt. These results are in line with those of Yang et al. (Citation2015), who provided evidence that fiscal consolidation results increase government debt. In regime 1, fiscal consolidation has an inverse U-shape at a lower rate of domestic government debt. In regime 1, fiscal consolidation has a U-shape at a lower rate of domestic government debt. Therefore, there is a need to consider the optimal timing and magnitude of fiscal consolidation efforts. When government debt is at a lower level, policymakers should carefully evaluate the potential benefits and costs of consolidation measures to avoid unintended consequences.
Regime 2, estimation 1, reflects that at this regime, domestic government debt has a mean rate of 44.89%. In regime 2, estimation 2, the fiscal consolidation of the government tax increase is found to result in a reduction in domestic government debt. Implementing targeted tax increases as part of fiscal consolidation measures could be an effective strategy to reduce domestic government debt. However, it is essential to carefully assess the potential impact on economic growth and consider the distributional effects of tax changes. These results are in line with the new Keynesian model and rationale for fiscal consolidation (Alesina et al., Citation2019; Mankiw, Citation2019). Baharumshah et al. (Citation2016) found a similar result: fiscal consolidation resulted in a fall in government debt in South Africa. In-regime 2, estimation 3,
fiscal consolidation of government expenditure cuts, increases domestic government debt. These results are contrary to the results of Alesina and Perotti (Citation1995), Alesina and Ardagna (Citation2010), Ghosh et al. (Citation2013), and Eyraud and Weber (Citation2013) among others, who found that government expenditure cuts are better at reducing government debt than a tax increase.
The findings suggest that a combined approach of expenditure cuts and tax increases may have limited effectiveness in reducing government debt. It is crucial to carefully calibrate the magnitude and timing of fiscal consolidation measures to minimize adverse effects on economic growth and maintain debt sustainability. In-regime 2, estimation 4, refelt synchronised fiscal consolidation of both government expenditure cuts and tax increase, it found that a 1% this government expenditure cuts and the tax increase will result in a 0.0831% increase in domestic government debt holding of other factors constant at 5% p-value of statistical significance. The findings suggest that a combined approach of expenditure cuts and tax increases may have limited effectiveness in reducing government debt. It is crucial to carefully calibrate the magnitude and timing of fiscal consolidation measures to minimize adverse effects on economic growth and maintain debt sustainability.
Regime 3, estimation 1, reflects that at this regime, domestic government debt has a mean rate of 72.39%. In regime 3, estimation 2, the fiscal consolidation of government tax increase is found to increase domestic government debt. In regime 3, estimation 3,
fiscal consolidation of government expenditure cuts show an increase of 1%, resulting in a 0.09% increase in domestic government debt. Regime 3, estimation 4,
g, shows that synchronised fiscal consolidation of both government expenditure cuts and tax increases results in a 0.091% increase in domestic government debt. These results are concerning given that when fiscal consolidation is not able to reduce government debt at a high level, it has been found to result in an unprecedented recession, as outlined by Monastiriotis (Citation2014). However, Gechert and Rannenberg (Citation2015) note that if fiscal consolidation is not adopted at a higher level of government debt, the economy may enter into a prolonged period of stagnation. In regime 3, it is found that
domestic government debt has a higher mean of 72.39% holding all other factors constant. At this higher mean in regime 3, it is found that the
debt service ratio has a positive impact on domestic government debt. A 1% increase in the debt service ratio results in a 2.801% increase in domestic government debt holding all other factors constant and statistically significant at a 10% p-value. On the other hand, the money supply m3 is found to harm domestic government debt. A 1% increase in the supply of money results in a 0.635% decrease in domestic government debt and is statistically significant at a 10% p-value.
Figure shows the filter transition probability from regime 1 to regime 3 as well as the gd domestic government debt. This result is in contrast to that of Burger et al. (Citation2016), which reflected 2 regimes in South Africa. In Figure , graph a, represents the regime 1 filter transition probability. The domestic government debt in regime 1 operates with a mean value of 30.15%. Olaoye and Olomola (Citation2022) found 31.43% in this regime. The first transition to regime 1 is from 1980 to 1992. During this period, it is found that the maximum domestic government debt was 32.33%, while the minimum domestic government debt was 29.00%, overall reflecting a slight upwards trend. Ten years after 1992, domestic government debt moved back to regime 1 from 2002 to 2012. During this period, the mean domestic government debt was 30.15%, and the movement of domestic government was on a downwards trend until it reached the minimum value of 21.99% in 2009. After that, it started to increase until it reached the maximum rate of 34.79% in 2012.
Figure 2. The regime 1 to 3 filter transition probabilities. Note the economic variables domestic government debt
,
, and
, are the government debt transition probabilities from state 1 to 3. Note the state is used interchangeably with the regime. The
and
, are the average mean of the domestic government debt from state 1 to 3. A state will run for a specific period; therefore, the model can generate the mean or average.
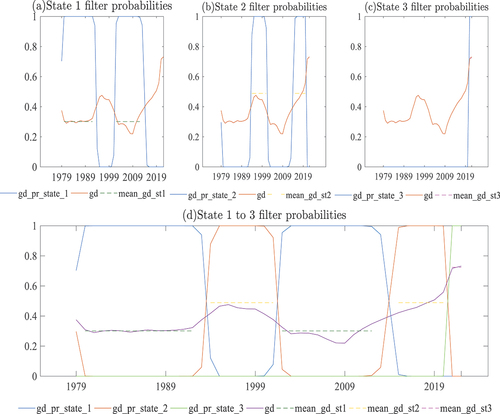
Figure , graph b, represents the regime 2 filter transition probability of domestic government debt. In-regime 2 domestic government debt is found to have a mean value of 44.89%. This second regime is similar to that of Olaoye and Olomola (Citation2022), who found a rate of 45.71% in the second regime. The transition to regime 2 is found between 1994 and 2001. In this period, domestic government debt started to increase until it reached the maximum value of 47.60% in 1996. Thereafter, domestic government debt started to have a downward trend until it reached a minimum value of 37.64% in 2001. Domestic government debt transitioned back to regime 2 from 2015 to 2020. Still operating under the mean of 44.89%. During this period, domestic government debt is observed to be on an upwards trend in 2015 starting with the minimum value of 42.22% and continuing with the upwards trend up until the maximum value of 55.82% in 2020. Figure , graph c, shows the regime 3 filter transition probability of domestic government debt. Since 1979, regime 3 has not been present, and the transition to regime 3 occurred from 2021 to 2022. Regime 3 domestic government debt has an equal value of 72.39% for minimum, maximum, and mean. Regime 3 has transitioned beyond the threshold of 60% of domestic government debt advocated by the SADC regional group. SADC outlines that all countries within the regional grouping need to have domestic government debt that is equal to or below the threshold of 60%.
Figure reflects the transition probabilities of different regimes that domestic government debt can enter. Regimes 1 to 3 are characterised by the means of 30.15%, 44.49%, and 72.39%, respectively, and of government debt, there are 92.26%, 75.54%, and 93.17% in the respective regimes. Across all regimes, the results indicate that the probability of transitioning between these three regimes is highly persistent. Burger et al. (Citation2016) found a transition probability of 0.925% in regime 1 and 0.075% in regime 2. Woldu (Citation2020) found a 93% probability of transitioning to a stable regime and an 89% probability of moving from an unstable regime.
Figure 3. Transition probabilities for domestic government debt regimes. Note the state is used interchangeably with the regime.
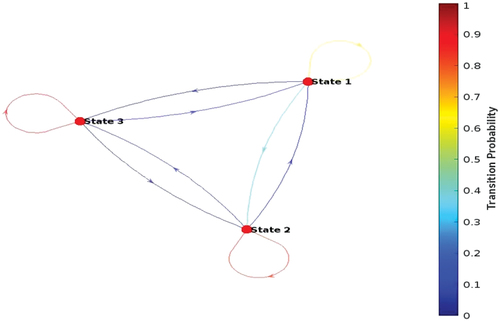
Table shows the expected duration of each regime. When the economy is in regime 1, it is found to run for 16 years. Regime 2 is found to run for 6 years 9 months, and regime 3 is found to run for 8 years and 2 months.
Table 4. Expected duration
5. Conclusion
The purpose of this paper is to investigate the impact of fiscal consolidation on domestic government debt in different regimes in South Africa. The paper employs Markov-switching dynamic regression (MSDR) using time-series data from 1979 to 2022. The contribution of the paper has provided evidence of fiscal consolidation in the different regimes using the cyclical adjusted primary balance (CAPB). The paper had an overview of the historical government debt in South Africa. The paper acknowledges there is no agreement among scholars as to the impact of fiscal consolidation on government. On the other hand, it was noted that disputes regarding the intervention of the South African fiscal authorises implementing fiscal consolidation have remained at a high level. The investigation of the impact of fiscal consolidation in different regimes has not been fully explored, this paper seeks to fill this gap in the body of knowledge. The economic question of the is paper is what is the impact of fiscal consolidation using government expenditure to cut government debt in different regimes? What is the impact of fiscal consolidation using tax increases on government debt in different regimes? What is the impact of the policy mix of fiscal consolidation on government debt in different regimes? How long will the regime of domestic government debt run? What is the probability of transition to different regimes of domestic government debt given the presence of fiscal consolidation?
The study identified three distinct regimes with varying mean levels of domestic government debt. In regime 1, fiscal consolidation through tax increases was found to increase government debt, while in regime 2, tax increases were associated with a reduction in government debt. This highlights the importance of considering regime-specific dynamics when formulating fiscal policies. Additionally, the study found that government expenditure cuts in regime 2 led to an increase in domestic government debt, contrary to the findings of previous studies. This suggests that the effectiveness of expenditure cuts in reducing government debt may be influenced by the specific regime. Policymakers should take this into account when designing fiscal consolidation strategies and consider alternative approaches in different regimes. Regime-specific fiscal strategies: In light of the varying effects of fiscal consolidation measures across different regimes, policymakers should adopt different approaches tailored to each regime. This requires a thorough understanding of the factors driving domestic government debt in each regime and developing targeted policies accordingly. By tailoring fiscal strategies to the specific dynamics of each regime, policymakers can maximize the effectiveness of fiscal consolidation efforts and optimize debt reduction outcomes.
Fiscal auhtiriesties need to focus on debt service management given the significant impact of the debt service ratio on domestic government debt, policymakers should prioritize effective debt management strategies. This includes optimizing borrowing costs, refinancing debt, and exploring opportunities for debt restructuring. By actively managing the debt service ratio, policymakers can ensure sustainable debt levels and reduce the burden of interest payments, freeing up resources for productive investments and economic development. There is a need for coordination between fiscal and monetary policy given the the paper highlights the importance of coordination between fiscal and monetary policy to effectively manage government debt. Policymakers should strive for a harmonized approach that balances fiscal consolidation measures with appropriate monetary policy actions. This requires close collaboration and communication between fiscal and monetary authorities to ensure that their policies are aligned and mutually reinforcing. By coordinating fiscal and monetary actions, policymakers can maintain economic stability, enhance the effectiveness of fiscal consolidation measures, and support debt reduction efforts
We found that fiscal consolidation using government expenditure cuts increased government debt, while the impact of fiscal consolidation through tax increases was insignificant. The policy mix of fiscal consolidation was found to increase government debt. We also identified three regimes of domestic government debt, with a U-shape impact of fiscal consolidation on domestic government debt across the different regimes. Our study highlights the importance of understanding the impact of fiscal consolidation in different regimes of domestic government debt to inform policy decisions aimed at reducing government debt. Based on our findings, we recommend that South Africa steers away from implementing fiscal consolidation measures. Policymakers must consider the potential negative impact of fiscal consolidation on government debt reduction and explore alternative approaches to managing government debt.
The policy implication of this paper is that South Africa should avoid fiscal consolidation because the paper found that fiscal consolidation using government expenditure cuts increased government debt, while the impact of fiscal consolidation through tax increases was insignificant. The policy mix of fiscal consolidation was also found to increase government debt. Therefore, it is recommended that South Africa steers away from implementing fiscal consolidation measures. There is a need to explore alternative approaches to managing government debt. The paper highlights the need for further research on effective debt reduction strategies that consider the potential negative impact of fiscal consolidation on government debt reduction. To understand the different regimes of domestic government debt, the paper identified three regimes of domestic government debt, with a U-shape impact of fiscal consolidation on domestic government debt across the different regimes. Policymakers should consider the potential impact of fiscal consolidation on government debt reduction in each regime to inform policy decisions aimed at reducing government debt. For long-term debt management, policymakers should consider long-term debt management strategies that take into account the cyclical movement of domestic government debt. Long-Term Debt Management Strategies: Policymakers should adopt long-term debt management strategies that account for the cyclical movement of domestic government debt. Understanding the U-shape impact of fiscal consolidation across different regimes emphasizes the importance of adopting a comprehensive approach that considers the varying dynamics of government debt over time. Further Research on Debt Reduction Strategies: The paper underscores the need for additional research on effective debt reduction strategies that account for the potential negative impact of fiscal consolidation on government debt reduction. This can help policymakers gain deeper insights into alternative approaches and develop evidence-based policies to manage and reduce government debt more effectively.
The paper has implications for the government community perspective, community and individual. In the context of the government (policymakers) point of view, the paper’s result note that the government needs to reconsider its approach to fiscal consolidation in light of the study’s findings. Implementing expenditure cuts as a means of reducing government debt may not be effective, while the impact of tax increases on debt reduction is insignificant. Policymakers should explore alternative approaches to managing government debt and tailor their financial strategies to the specific dynamics of each regime. The paper underscores the importance of understanding the regime-specific dynamics of domestic government debt. Policymakers should conduct further research to gain a deeper understanding of these dynamics and develop evidence-based policies that address the factors driving government debt in each regime. From the perspective of the local community perspective, the paper findings of the study highlight the need for policymakers to consider the potential negative impact of fiscal consolidation measures on government debt reduction. Local communities should advocate for policies that prioritize their well-being and economic development, taking into account the potential consequences of fiscal consolidation on public services, employment, and social programs. Local communities should be informed about the regime-specific dynamics of government debt and the importance of tailored fiscal policies. They can engage with policymakers to ensure that their voices are heard and that policy decisions take into account the specific needs and challenges of their communities. From the individual point of view, individuals should be aware that fiscal consolidation measures, particularly through government expenditure cuts, may not necessarily lead to a reduction in government debt. This understanding can help individuals make informed decisions and advocate for policies that prioritize sustainable debt management and long-term economic stability. Individuals should also be mindful of the potential impacts of government debt on the overall economy, public services, and their financial well-being. Individuals need to stay informed about fiscal policies and actively participate in discussions and debates on debt management strategies. Individuals may also need to adjust their financial planning and decision-making based on the prevailing regime-specific dynamics of government debt. Understanding the potential impact of fiscal consolidation measures on the economy can help individuals make informed choices regarding investments, savings, and personal financial goals.
Disclosure statement
No potential conflict of interest was reported by the author(s).
Additional information
Notes on contributors

Eugene Msizi Buthelezi
Eugene Msizi Buthelezi holds a master’s in economics from the University of KwaZulu-Natal. He is currently in advanced stage to completing a PhD (submitted for examination at UKZN). Currently, the author is an nGAP Lecturer at the University of Free State teaching economics for public managers at undergrad level. The author’s research interest is on the macroeconomics on the aspect of macroeconomic modelling; fiscal policy, monetary systems; inflation; interest rates; central banks and their policies.
Phocenah Nyatanga
Phocenah Nyatanga is an Associate Professor in Economics, and current College Dean of Research and Higher Degree: Her teaching spans both undergraduate and postgraduate courses, with specialization in teaching quantitative economics and postgraduate econometrics. Her research typically utilizes secondary data, and research interests include international trade and development economics.
References
- Fiscal Responsibility Bill (FRB). (2018). N. T. R. O. S. Africa. Communications Directorate, National Treasury, Private Bag X115.
- Afonso, A. (2022). To consolidate or not to consolidate? A multi-step analysis to assess needed fiscal sustainability. International Economics, 72(C), 106–19.
- Afonso, A., & Leal, F. S. (2022). Fiscal episodes in the economic and monetary union: Elasticities and non‐Keynesian effects. International Journal of Finance & Economics, 27(1), 571–593.
- Agnello, L. (2019). A competing risks tale on successful and unsuccessful fiscal consolidations. Journal of International Financial Markets, Institutions and Money, 63, 101148. https://doi.org/10.1016/j.intfin.2019.101148
- Alesina, A. (1998). The political economy of fiscal adjustments. Brookings Papers on Economic Activity, 1998(1), 197–266.
- Alesina, A. (2019). Effects of austerity: Expenditure-and tax-based approaches. Journal of Economic Perspectives, 33(2), 141–162.
- Alesina, A., & Ardagna, S. (2010). Large changes in fiscal policy: Taxes versus spending. Tax Policy and the Economy, 24(1), 35–68.
- Alesina, A., & Perotti, R. (1995). Fiscal expansions and adjustments in OECD countries. Economic Policy, 10(21), 205–248.
- Ardanaz, M. (2020). Fiscal consolidations and electoral outcomes in emerging economies: Does the policy mix matter? Macro and micro level evidence from Latin America. European Journal of Political Economy, 64, 101918. https://doi.org/10.1016/j.ejpoleco.2020.101918
- Auerbach, A. J., & Gorodnichenko, Y. (2017). Fiscal stimulus and fiscal sustainability, National Bureau of Economic Research. No. w23789.
- Baharumshah, A. Z. (2016). Public revenue‐expenditure nexus in South Africa: Are there asymmetries? South African Journal of Economics, 84(4), 520–537.
- Blanchard, O. J. (1990). Suggestions for a new set of fiscal indicators. Organisation for Economic Co-Operation and Development (OECD) (No. 79).
- BR. (2012). Budget Review 2012. N. T. R. o. S. Africa. Communications Directorate, National Treasury, Private Bag X115.
- BR. (2013). Budget Review 2013. N. T. R. o. S. Africa. Communications Directorate, National Treasury, Private Bag X115.
- BR. (2014). Budget Review 2014. N. T. R. o. S. Africa. Communications Directorate, National Treasury, Private Bag X115.
- BR. (2015). Budget Review 2015. N. T. R. o. S. Africa. Communications Directorate, National Treasury, Private Bag X115.
- BR. (2017). Budget Review 2017. N. T. R. o. S. Africa. Communications Directorate, National Treasury, Private Bag X115.
- BR. (2018). Budget Review 2018. N. T. R. o. S. Africa. Communications Directorate, National Treasury, Private Bag X115.
- BR. (2020). Budget Review 2020. N. T. R. o. S. Africa. Communications Directorate, National Treasury, Private Bag X115.
- Brady, G. L., & Magazzino, C. (2018). Government debt in EMU countries. Journal of Economic Asymmetries, 18, e00096. https://doi.org/10.1016/j.jeca.2018.e00096
- Burger, P. (2012). Fiscal sustainability and the fiscal reaction function for South Africa: Assessment of the past and future policy applications. South African Journal of Economics, 80(2), 209–227.
- Burger, P. (2016). Fiscal consolidation and the public sector balance sheet in South Africa. South African Journal of Economics, 84(4), 501–519.
- Burger, P., & Jimmy, C. (2006). Should South Africa have a fiscal rule? South African Journal of Economics, 74(4), 642–669.
- Burger, P., & Marinkov, M. (2012). Fiscal rules and regime-dependent fiscal reaction functions. OECD Journal on Budgeting, 12(1), 1–29.
- Buthelezi, E. M. (2023a). Dynamics of macroeconomic uncertainty on economic growth in the presence of fiscal consolidation in South Africa from 1994 to 2022. Economies, 11(4), 119.
- Buthelezi, E. M. (2023b). Impact of government expenditure on economic growth in different states in South Africa. Cogent Economics & Finance, 11, 2209959. https://doi.org/10.3390/economies11010029
- Buthelezi, E. M., & Nyatanga, P. (2018). Government debt and economic growth: Evidence from ECOWAS and SADC. African Journal of Business and Economic Research, 13. https://doi.org/10.31920/1750-4562/2018/v13n3a1
- Buthelezi, E. M., & Nyatanga, P. (2023a). Threshold of the CAPB that can be attributed to fiscal consolidation episodes in South Africa. Economies. https://doi.org/10.3390/economies11060152
- Buthelezi, E. M., & Nyatanga, P. (2023b). Time-varying elasticity of cyclically adjusted primary balance and effect of fiscal consolidation on domestic government debt in South Africa. Economies, 11(5). https://doi.org/10.3390/economies11050141
- Buthelezi, E. M., & Nyatanga, P. (2023c). The dynamic relationship between government debt, fiscal consolidation, and economic growth in South Africa: A threshold analysis. Cogent Economics & Finance, 11(2), 2261329.
- Calitz, E. (2014). Fiscal sustainability in South Africa: Will history repeat itself? Studies in Economics and Econometrics, 38(3), 55–78.
- David, A. C. (2022). The rewards of fiscal consolidations: Sovereign spreads and confidence effects. Journal of International Money & Finance, 123, 102602. https://doi.org/10.1016/j.jimonfin.2022.102602
- de Rugy, V., & Salmon, J. (2020). Flattening the debt curve: Empirical lessons for fiscal consolidation. Mercatus Special Study.
- Deskar-Škrbić, M., & Milutinović, D. (2021). Design of fiscal consolidation packages and model-based fiscal multipliers in Croatia. Public Sector Economics, 45(1), 1–61.
- Duperrut, J. (1998). “Successful fiscal adjustments”: Empirical evidence from South Africa. University of Cape Town.
- Eyraud, L., & Weber, A. (2013). The challenge of debt reduction during fiscal consolidation. International Monetary Fund.
- Gechert, S., & Rannenberg, A. (2015). The costs of Greece’s fiscal consolidation. Vierteljahrshefte zur Wirtschaftsforschung, 84(3), 47–59.
- Georgantas, G. (2023). Τhe effects of fiscal consolidation in OECD countries. Economic Modelling, 118, 106099. https://doi.org/10.1016/j.econmod.2022.106099
- Ghosh, A. R. (2013). Fiscal fatigue, fiscal space and debt sustainability in advanced economies. The Economic Journal, 123(566), F4–F30.
- Giavazzi, F., & Pagano, M. (1995). Non-Keynesian effects of fiscal policy changes: International evidence and the Swedish experience. National Bureau of Economic Research (NBER) Macroeconomics Annual NBER Working Paper w5332.
- Glavaški, O., & Beker-Pucar, E. (2020). Fiscal consolidation in the EU-28: Multiyear versus cold-shower episodes. Ekonomski horizonti, 22(1), 17–30.
- Hamilton, J. D. (1989). A new approach to the economic analysis of nonstationary time series and the business cycle. Econometrica: Journal of the Econometric Society, Econometrica, 57(2), 357–384. https://doi.org/10.2307/1912559
- Hansen, B. E. (1996). Inference when a nuisance parameter is not identified under the null hypothesis. Econometrica: Journal of the Econometric Society, 413–430. https://doi.org/10.2307/2171789
- Hansen, B. E. (2000). Sample splitting and threshold estimation. Econometrica, 68(3), 575–603.
- IMF. (2020). Cyclically adjusted balance. Retrieved November 8, 2022, from https://www.imf.org/external/datamapper/GGCB_G01_PGDP_PT@FM/ADVEC/FM_EMG/.
- Kalbhenn, A., & Stracca, L. (2020). Mad about austerity? The effect of fiscal consolidation on public opinion. Journal of Money, Credit, and Banking, 52(2–3), 531–548.
- Lahiani, A. (2022). Fiscal consolidation, social sector expenditures and twin deficit hypothesis: Evidence from emerging and middle-income countries. Comparative Economic Studies, 64, 1–38. https://doi.org/10.1057/s41294-022-00183-6
- Lodge, D., & Rodríguez-Vives, M. (2013). How long can austerity persist? The factors that sustain fiscal consolidations. European Journal of Government and Economics, 2(1), 5–24.
- Mankiw, N. G. (2019). Brief principles of macroeconomics. 2019. Cengage Learning.
- Marattin, L. (2022). Revenue vs expenditure based fiscal consolidation: The pass-through from federal cuts to local taxes. International Tax and Public Finance, 29(4), 834–872.
- McDermott, C. J., & Wescott, R. F. (1996). An empirical analysis of fiscal adjustments. Staff Papers, 43(4), 725–753.
- Monastiriotis, V. (2014). When) does austerity work? On the conditional link between fiscal austerity and debt sustainability. Cyprus Economic Policy Review, 8(1), 71–92.
- MTBPS. (2014). Medium term budget policy statement 2014 N. T. R. o. S. Africa. Communications Directorate, National Treasury, Private Bag X115.
- MTBPS. (2017). Medium term budget policy statement 2017. N. T. R. o. S. Africa. Communications Directorate, National Treasury, Private Bag X115.
- Müller, G. J. (2014). Fiscal austerity and the multiplier in times of crisis. German Economic Review, 15(2), 243–258.
- Nakatani, R. (2021). Fiscal rules for natural disaster-and climate change-prone small states. Sustainability, 13(6), 3135.
- Nunes, B. D. G. (2019). Does the level of public spending influence the success of fiscal consolidations? União Europeia, 1–48.
- Olaoye, O. O., & Olomola, P. (2022). Empirical analysis of asymmetry phenomenon in the public debt structure of sub-Saharan Africa’s five biggest economies: A Markov-switching model. Journal of Economic Asymmetries, 25, e00242. https://doi.org/10.1016/j.jeca.2022.e00242
- Quaresma, G. D. (2021). Monetary policy easing and non-keynesian effects of fiscal policy. Universidade de Lisboa (Portugal).
- SADC. (2006). Protocol on Finance and investment (2006). Finance.
- SARB. (2022, 2020). Online statistical query (Historical macroeconomic timeseries information). Retrieved November 3, 2022, from https://www.resbank.co.za/Research/Statistics/Pages/OnlineDownloadFacility.aspx.
- Woldu, G. T. (2020). Do fiscal regimes matter for fiscal sustainability in South Africa? A Markov-switching approach, WIDER working paper.
- Yang, W. (2015). Macroeconomic effects of fiscal adjustment: A tale of two approaches. Journal of International Money & Finance, 57, 31–60. https://doi.org/10.1016/j.jimonfin.2015.05.003