
 ?Mathematical formulae have been encoded as MathML and are displayed in this HTML version using MathJax in order to improve their display. Uncheck the box to turn MathJax off. This feature requires Javascript. Click on a formula to zoom.
Abstract
This study examines the determinants of capital adequacy and voluntary capital buffers among microfinance institutions (MFIs). We apply the two-stage least squares (2SLS) with instrumental variables to account for endogeneity. Using quarterly panel data of 439 MFIs in Ghana covering the period 2015–2018, the study found that credit risk, income diversification, size, profitability, lending channel, and equity-to-asset ratio significantly affect capital adequacy. Also, the factors that drive voluntary capital buffers are income diversification, size and equity-to-asset ratio, but size and economic growth are insignificant when the upper limits of Basel III requirements are applied. Generally, the results are insignificant among non-deposit-taking (i.e. Tier 3 like Financial NGOs) MFIs. The findings show that non-performing loans negatively affect capital adequacy. Income diversification increases capital adequacy, especially among deposit-taking MFIs which have the regulatory liberty to engage in additional financial intermediation activities. Size has an inverted U-shape nexus with capital adequacy and there is evidence to suggest that for non-deposit-taking MFIs, size may not matter. Profitability increases capital adequacy while equity-to-asset ratio decreases capital adequacy, especially among deposit-taking MFIs. Additionally, lending channels negatively affect capital adequacy, especially among deposit-taking MFIs. Economic growth reduces capital adequacy but results are insignificant when we control for quarter fixed-effects. These results throw light on the application of the capital buffer theory in the context of MFIs which provides useful insights for practitioners, regulators, policymakers and academia.
Public Interest Statement
The study explored the factors that determine the capital adequacy and voluntary capital buffer of microfinance institutions (MFIs). We found that capital adequacy is determined by credit risk exposure, income diversification, firm size, profitability, equity contributions, lending channels and to some extent economic growth. Only income diversification, size, and profitability increase capital adequacy, the others lead to its reduction. We found that all these factors determine whether or not an MFI keeps capital adequacy levels above the Bank of Ghana level or the rates fixed by Basel II and III. We also found that firms keeping voluntary capital above 13% (which is the maximum cut-off under Basel III) are doing so not because of their size or the economic conditions. We find some differences in the determinants for deposit-taking and non-deposit-taking MFI like the Financial Non-Governmental Organizations. Financial NGOs have more tendency to support social causes and increase capital even in the event of poor financial performance.
1. Introduction
Microfinance institutions (MFIs) are formal financial intermediaries that provide financial services to the unbanked population (Ali et al., Citation2022; Beisland et al., Citation2021; Ribeiro et al., Citation2022). By their nature and form, MFIs have gained a non-negligible presence in the financial system of low-income countries and emerging economies (Banna et al., Citation2022; Duho, Citation2022). They are different from banks as MFIs tend to provide financial services such as micro-loans with unconventional collateral using common micro-lending technology, micro-insurance, electronic banking and remittances among others (Ali et al., Citation2023; Hagawe et al., Citation2023; Soumaré et al., Citation2020; Tchuigoua, Citation2016). Impact studies show that MFIs can drive financial inclusion, reduce poverty and improve the welfare of customers (Ali et al., Citation2022; Bel Hadj Miled, Citation2022; Garmaise & Natividad, Citation2013; Rai & Ravi, Citation2011; Ribeiro et al., Citation2022). Thus, pro-poor policies, which are targeted to alleviate poverty, tend to consider using the microfinance industry as a conduit. There are some MFIs that collect deposits as a source of funds and a growth conduit, while others do not. Although the total national deposits of MFIs are lower than the value for banks, MFIs tend to serve a larger number of customers, especially in a developing country context.
Similar to banks, MFIs are subject to specific prudential regulations including capital adequacy requirements, which assesses institutional resilience to both expected and unexpected losses. Such stringent requirements may not apply in credit-only MFIs like non-governmental organisations (NGOs) and nonbank financial institutions (NBFIs) which do not fund themselves with deposits. Such non-deposit-taking MFIs tend to rely on funding from equity holdings for loan management and execution of their projects (Galema et al., Citation2011). This has implications on their capital adequacy, as well as, the risk exposures of the customers and the firms. This is because high capital adequacy suggests low risk. Generally, the incentive to maintain a high capital ratio can be driven by regulatory pressure (so-called regulatory hypothesis) (Brewer et al., Citation2008; Lindquist, Citation2004), market discipline or MFI-specific features (Gropp & Heider, Citation2010; Soumaré et al., Citation2020), or from the macroeconomic context (Bernanke & Gertler, Citation1989; Shleifer & Vishny, Citation2010).
The banking literature has explored capital adequacy extensively but there is the paucity of knowledge about the capital adequacy and voluntary capital buffer of MFIs. In many cases, the studies use the World Bank’s MIX Market data which has limited country-level observation. Our study uses more granular data per quarter encompassing all the MFIs that operated in the economy. Two notable studies in this area are Soumaré et al. (Citation2020) and Tchuigoua (Citation2016) but with a scan through the literature, we found that studies that directly investigate the determinants of the level of capital in microfinance institutions are scarce or coupled with mixed results and there is even no publicly known study that explores the drivers of the voluntary buffers of MFIs. This study aims to fill this gap in the literature by exploring the determinants of capital adequacy and voluntary capital buffers of MFIs in the context of an emerging market. The study focuses on Ghana as it has a developed microfinance industry which has features similar to low-income countries and emerging economies. The study uses novel data from 439 MFIs over 15 quarters covering the second quarter of 2015 to 2018. In general, the study applies the two-stage least squares (2SLS) with the instrumental variables to address the problem of endogeneity to explore the determinants of capital adequacy and voluntary capital buffer of MFIs.
The results show that non-performing loans, income diversification, firm size, return on asset, loans-to-asset ratio, equity-to-asset ratio and gross domestic product significantly affect capital adequacy. Generally, there are some disparities as to whether an MFI is deposit-taking or non-deposit-taking (i.e. Tier 3 like Financial Non-Governmental Organisations). The findings show that effective credit risk management enhances capital adequacy, but for non-deposit-taking MFIs, because of their social impact mandate, capital adequacy increases even in spite of poor loan management. Also, income diversification increases capital adequacy, especially among deposit-taking MFIs which have the regulatory liberty to engage in additional financial intermediation activities. Firm size has an inverted U-shape nexus with capital adequacy and there is evidence to suggest that for non-deposit-taking MFIs, size may not matter but rather the goals and resource capacity of their promoters or owners in increasing capital adequacy.
We found that profitability increases capital adequacy, especially among the deposit-taking MFIs at levels that do not reflect among the Tier 3 MFIs. The equity base and lending channels decrease capital adequacy. We also find evidence to suggest that economic growth reduces capital adequacy since asset values may be higher in those periods, but when we control for the quarter-fixed effect, the results are insignificant. We found that using the Bank of Ghana’s regulatory threshold of 10% and the various Basel II and Basel III thresholds to estimate voluntary capital buffer, firm size and GDP loss their significance for buffers beyond the upper limit of the maximum threshold under Basel III (i.e. 13%). The results throw light on the application of the capital buffer theory in the MFI context and are relevant for practitioners, policymakers and the regulators such as the Bank of Ghana, the Ghana Microfinance Institutions Network (GHAMFIN) and the Financial Stability Council in their deliberations regarding a post-COVID-19 economic revitalisation, as well as academics for teaching or future research.
This study is organised under six sections. The next section provides some stylized facts about the microfinance sector of Ghana. Section 3 discusses the extant literature on the capital buffer theory, capital regulation and the determinants of capital adequacy. Section 4 discusses the methodology and rationalises the choice of the regression technique. Section 5 presents the results of the analysis and discusses it in line with the extant literature. Section 6 concludes the study, as well as, provides implications for policy, practice and future research.
2. History and Stylized Facts on the Microfinance Sector of Ghana
The concept of microfinance in its conceptual or practical form is not new. Since the earlier creation of money, there has been some form of microfinancing or microcredit. However, the form, scope and nature of microfinance or microcredit have changed over time, and this increases the inability to accurately trace its genesis. At best, historians and anthropologists draw linkages to specific events or institutional developments to provide some sort of indicative history of an aspect of the past (Ashta & Mor, Citation2022; Zainuddin & Yasin, Citation2020). The modern form of microfinance we see today could be traced back to the 1800s, linking to the work of the theorist Lysander Spooner who trumpeted the benefit of small loans for small businesses. This chronicle of microfinance in the modern era can be linked to the works of the Grameen Bank of Bangladesh in the 1970s which have shaped the modern view of microfinance (Mia et al., Citation2019) or the Shore Bank of Chicago which was founded in 1974 to provide microcredits (Bhayana & Sharma, Citation2022). In these periods, there were various experimentation of the idea of microfinance under the Grameen Bank in Bangladesh, ACCION International in Latin America, and the Self-Employed Women’s Association Bank in India.
In Ghana, the history of microfinance in its antiquity form is not so new, there were microfinancing structures but the formal modern form we witness today has its genesis in the 1950s (Duho, Citation2022; Duho et al., Citation2023). The Canadian Catholic missionaries established the first credit union in Africa in the Northern Region of Ghana. In these periods, the focus is usually on the supply of subsidized credits. The focus on adding the pro-poor financing option to support poor fisherfolks and agriculture sector actors under the Agricultural Development Bank is one of the efforts to expand microfinance. Though the need to focus on financing the rural and pro-poor actors was always there, it was in 1976 after the establishment of rural banks for supporting credit to small-scale farmers, and businesses and supporting broader development projects that the pro-poor financing idea gained more prominence. Within these periods, commercial banks were required to reserve 20% of their total portfolio to lend to agricultural and small-scale industries. In 1986, when the Bretton Woods institutions were implementing the structural adjustment program, the sector was broadly liberalised. The unique microcredit and microfinance model, susu, later emerged from Nigeria and infiltrated Ghana in the early 1990s. In 1991, the PNDC Law 328 was promulgated which allows for the establishment and licensing of different categories of non-bank financial intermediaries, encompassing savings and loans, and credit unions. A graphical depiction of the evolution of MFIs in Ghana is presented in Figure .
Figure 1. Evolution of microfinance in Ghana.
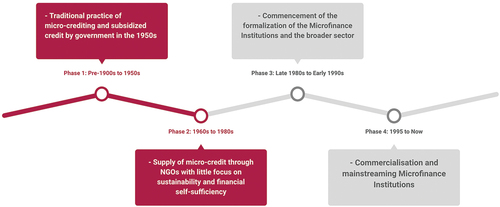
In the early 2000s, there were some institutions registered with the Registrar General’s Department but not with the Bank of Ghana that engaged with microfinance-style financial intermediation but these were plagued with a lack of capital, poor management, non-performing loans, limited technical acumen, and fraud in some cases. There were thus efforts to drive advocacy and support the sector, leading to the establishment of the Ghana Microfinance Institutions Network (GHAMFIN). In 2011, there was the establishment of a tiered structure for licensing MFIs based on the capital requirement, business form, branch network, prudential reporting and permissible activities based on the Bank of Ghana’s Guidelines for Microfinance Institutions (World Bank Group, Citation2016). Microfinance institutions could be classed as deposit-taking or non-deposit-taking, while others could be registered as non-profits or profit-making ventures. The complex nature of the varied activities of MFI has led to concerns by actors about the multiplicity of apex bodies. For example, currently, there is the Ghana Co-Operative Credit Unions Association (GCCUA), Ghana Co-Operative Susu Collectors’ Association (GCSCA), Association of Financial NGOs, Ghana Cooperative Council (GCC), Ghana Microfinance Institution Network (GHAMFIN), ARB Apex Bank and the Money Lenders Association of Ghana. Compared with rural banks that have location limitations, microfinance institutions do not have location limitations but focus on poor and low-income clients. Currently, there is no comprehensive policy document on MFIs and it is very recent that the industry with support from international partners and the government is developing the National Microfinance Policy for Ghana to replace the Ghana Microfinance Policy developed in 2006.
As per the Bank of Ghana, there are four tiers for microfinance firms, Tier 1 including savings and loans and finance houses, Tier 2 including Deposit-taking Microfinance Companies, Tier 3 including Micro-credit Companies and Tier 4 including Micro-credit Institutions. The MFI sector witnessed mission drifts as the institutions have ignored the poor, low-income earners and the unbanked, but rather focusing on the already rich and affluent in the society. The operators of MFIs were diverting investments to big-ticket, high risk and mostly unrelated businesses like hotels, small-scale mining and real estate. These activities tend to limit the cash flow potentials of the MFIs and lock up funds for a long period, denying the pro-poor population the needed support. The problems in the sector were widespread covering weak supervision, poor institutional linkages, lack of coordination, disregard for ethical standards, lack of human capital, fraudulent and non-submission of prudential returns, poor corporate governance, low-risk management system, and resultant market confidence. In response, the Bank of Ghana initiated the Ghana Deposit Protection Scheme (GDPS) in 2019 by first revoking the licenses of 347 microfinance companies, 39 microcredit companies and 23 savings and loans companies and finance houses, representing 72% of all MFIs at the time (Bank of Ghana, Citation2022; Duho, Citation2022).
Currently, the MFI sector has a total of 180 institutions registered to represent 0.5% of the total share of financial sector assets and GH¢1086 million (equivalent to 5.4% of gross domestic product from the financial and insurance activities in 2022) (MoFEP, Citation2022). The comparative figures are presented in Table . The COVID-19 pandemic affected the economic activities in Ghana and the MFIs are not excepted from the negative impact. Moreover, the recent government policy to tax electronic transactions as part of the e-levy has been tipped to be a retrogressive step in achieving financial inclusion. Currently, the government has also initiated a domestic debt exchange in view of meeting the International Monetary Fund’s (IMF) requirement for obtaining a bailout (MoFEP, Citation2022). The MFIs invest some of their deposits and assets in government bonds and the execution of the haircut on government bonds in a high-inflation economy has dire consequences for the MFIs. The implications for the pro-poor population which benefit from the activities of the MFIs are dire. There are emerging developments in the operations of microfinance institutions including the integration of emerging technologies like artificial intelligence or big data and collaborations with FinTech institutions to enhance data analytics and improve operational efficiency.
Table 1. Financial sector statistics, Share and asset value
3. Empirical Review
This section provides a brief review of the theoretical and empirical literature on capital regulation and the studies on the determinants of capital adequacy.
3.1 Theoretical Review–Capital Buffer Theory
The capital buffer theory falls within the broader charter value literature, and it has been receiving increasing attention in recent times (Jokipii & Milne, Citation2011). The capital buffer theory has gained relevance and has been discussed across the banking and finance literature. The capital buffer theory postulates that financial institutions keep a level of capital above the required minimum, as a buffer. This is because the financial institutions within a regulatory environment are exposed to regulatory costs and benefits of keeping capital which they must balance (Hessou & Lai, Citation2017). The financial literature has recorded that historically, there have been discussions of the concept of counter-cyclical buffers (Jiménez et al., Citation2017). This concept has regained international prominence after the global financial crisis of 2007–8 where there were concerns that financial institutions (specifically banks) should hold a capital buffer. The counter-cyclical buffer requires banks to adjust their capital holdings based on the economic situation—higher buffers during expansionary periods and lower values during recessionary periods (Beatty & Liao, Citation2014).
As posited by Dewatripont and Tirole (Citation1994), the capital buffer theory notes that financial institutions balance the explicit and implicit benefits and costs of keeping capital across the entire balance sheet. In this vein, they consider three key factors, i) supervisory pressure and penalties for breach, ii) cost of capital surpluses (regulatory and voluntary buffer), and iii) the time and cost constraints of adjusting capital levels (Pereira & Saito, Citation2015). In effect, the institutions use the buffer as a safety cushion in events of financial default or crisis since they may not instantaneously adjust capital levels in crisis moments either because of illiquid markets or adjustment costs. In line with the “more skin in the game” logic high capital buffers are found to be enhancing shareholders’ prudence and addressing the agency problems in investment decision-making (Demirguc‐Kunt et al., Citation2013). It is worth noting that the capital buffer theory opposed the moral hazard theory regarding compliance with capital requirements. While the moral hazard theory argues that capital regulation is ineffective in reducing the risk exposures of banks, the capital buffer theory regards the restrictions through capital requirements as vital for enhancing stability or soundness of the banks and the broader global financial system.
3.2 Empirical Review
In this section, we provide a critical discussion of the literature on capital regulation and some previous empirical studies on capital adequacy in the financial services sector.
3.2.1 Capital Regulation
Capital regulation has been one of the effective tools used in the banking industry to prevent excessive risk-taking and enhance the stability of the financial system in various economies. Despite the role it plays, capital regulation has cost implications for financial institutions as it can have implications on efficiency, risk level, profitability and pricing of the institutions. There are also alternative forgone considerations as the minimum capital held by the firms could be used as a credit to customers at a profit. The banking industry has made use of the Basel Accord in achieving the capital regulation purpose across the world (Ortino, Citation2019; Ramirez, Citation2017). This led to the development of Basel I which is the Basel Capital Accord, Basel II which was a new capital framework and Basel III which responded to the 2007–2009 financial crises. Currently, national banking regulators that are signatories to the accord are taking steps to fully implement the Basel III or the earlier variants depending on the respective levels of progress. The most recent accord which is the Basel IV that was finalised in 2017 is to be implemented in January 2023. The new standard will require a significant increase in the capital of banking institutions (Neisen & Roth, Citation2018).
Unlike banks, the microfinance industry despite its relevance especially in emerging economies has received less attention when it comes to capital regulation (Soumaré et al., Citation2020). The Basel Accords tend to focus on the Universal banks and any regulatory measures in the microfinance industry tend to be a less stringent version of the variant for the banks. There are limited studies on the capital adequacy of MFIs, the determinants and a possible exploration of the drivers of voluntary capital buffers.
3.2.2 Determinants of Capital Adequacy
The extant literature on capital adequacy has focused predominantly on banks while excluding MFIs. One of the notable areas of research on this macro-prudential policy tool is regarding its determining factors.
Various studies have sought to understand the relevance of capital level in the survival of banks. Berger and Bouwman (Citation2013) found evidence to suggest that bank capital plays a relevant role in promoting the survival and value creation of banks in normal times and even under various episodes of financial crises. There is evidence that suggests that where banks keep capital above the regulatory requirements, they can respond to shocks (Flannery & Rangan, Citation2008; Gropp & Heider, Citation2010). Das and Rout (Citation2020) explored the link between capital adequacy, risk, profitability and efficiency among banks in India using data covering the period 1996–2016. They found that capital adequacy increases the risk-taking behaviour of bank and it has a positive nexus with profitability. However, the findings show that capital adequacy reduces the efficiency of the banks.
Other studies also seek to understand the determinants of capital adequacy among banks and not MFIs. Thoa et al. (Citation2020) explored the banking sector of Vietnam using data covering the period 2009–2015 and found that size and liquidity are factors driving capital adequacy. Other variables such as loans, loan loss reserve and return on equity are included in the analysis but did not yield statistically significant results. Barrios and Blanco (Citation2003) argued that market forces are a stronger determinant of capital adequacy as compared with regulatory forces. The study used two models to explain bank behaviour in choosing their capital ratio, namely the market model and the regulatory model. The market model argues that explanatory variables of capital adequacy are size, operating costs, liquidity premium, the variance of return on assets, credit risks and illiquidity risks. The regulatory model involves setting a capital ratio that is the addition of the regulatory minimum capital and a capital cushion. Duho (Citation2022) examined the risk profile of microfinance firms and found that risk factors affect the performance of microfinance institutions. The study also provided insights that suggest there are implications of political economy factors in the overall risk profile and performance of the microfinance sector. Duho etal. (Citation2021) found evidence that suggest that the diversification strategies of microfinance firms affect their risk exposures.
Many other studies explored the determinants of capital adequacy among banks. Mili et al. (Citation2017) explored the capital adequacy of foreign banks and found that factors driving capital adequacy differ among subsidiaries and branches in developed economies as compared with those in developing economies. Yu* (Citation2000) found that size, profitability and liquidity are factors that determine capital adequacy among banks in Taiwan. Bilgin and Dinc (Citation2019), explored how factoring is a factor of capital structure and found that factoring is an external financing option and is closely linked to the financial leverage exposure of large firms in Turkey. In a study on the Kingdom of Saudi Arabia, Khan et al. (Citation2021) found in line with conventional banking practice that banks are more highly leveraged than non-banking financial institutions. The results reveal that the determinants of capital structure include earnings volatility, profitability, firm size, tangibility and growth. The study noted that these factors also impact the capital structure of non-bank financial institutions but with peculiarities and varied magnitude. Another study by Saif-Alyousfi et al. (Citation2020) found evidence that supports the pecking order theory which suggests that the cost of financing increases with asymmetric information and the trade-off theory which argues that the choice of debt or equity proportion in capital structure is dependent on the balancing act between costs and benefits.
The microfinance literature on capital adequacy concept is few and little is known about its determinants. The related studies are scant and very recent (Soumaré et al., Citation2020; Tchuigoua, Citation2016). Tchuigoua (Citation2016) found that the factors that determine buffer capital are market power, portfolio at risk, size, operation self-sufficiency, cost of funding and financial sector development. The study highlights the need to further explore the structure of equity holding and its determinants among MFIs. Soumaré et al. (Citation2020) found evidence to suggest that there is a negative nexus between capital to asset and business cycle, hence, the study argues that macro-prudential regulation for MFIs should target both the regulated and profit-oriented firms. The study highlights that to date, no other study has sought to explore the determinants of capital adequacy apart from Tchuigoua (Citation2016) Tchuigoua (Citation2016). This study aims to expand the studies in the banking literature further to cover the microfinance industry in the emerging market context.
4. Methodology
In this section, the methodology used for the study has been described and the choice of the regression technique has been rationalised.
4.1 Data
This study uses a quarterly dataset of the microfinance firms that operated over the period from 2014 to 2018. This was sourced from the Bank of Ghana. After cleaning the data, there are 439 various MFIs in the dataset which were used for the analysis. We realise there are some data losses for most income statement variables for all quarters of 2014 and the first quarter of 2015. The final data utilised range from the second quarter of 2015 to the fourth quarter of 2018 (15 quarters)Footnote1
4.2 Dependent Variables—Capital Adequacy Ratio and Voluntary Capital Buffer
The capital adequacy of the MFIs has become an essential ratio for prudential monitoring. The ratio captures not only the adequacy of capital but embeds risk management by focusing on risk-adjustment of assets. The ratio has been explored in earlier studies to understand its nexus with other corporate variables (Das & Rout, Citation2020; Mili et al., Citation2017; Soumaré et al., Citation2020; Tchuigoua, Citation2016; Thoa et al., Citation2020). High ratios are preferable and are signs that MFIs have enough capital to protect the finances of depositors or creditors in general. This study follows earlier studies to compute the capital adequacy ratio (CAR) as follows:
In addition, we develop a metric to measure voluntary capital buffer, which is the capital adequacy ratio beyond the requirements of Basel II, and Basel III, as well as based on the Bank of Ghana’s 10% requirement during the study period. Under Basel II, banks are required to keep a minimum capital of 8%–11% but 10.5%–13% under Basel III (with 2.5% as a conservative buffer). Where Buffer is the voluntary capital adequacy buffer and Basel represents the minimum or maximum capital requirement according to the Basel framework:
We can therefore develop a dichotomous variable, CAB which is 1 when Buffer is positive, and 0 when it is zero or negative (Hessou & Lai, Citation2017).
4.3 Explanatory Variables
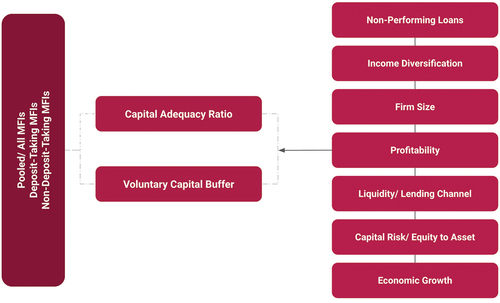
The study used the ratio of non-performing loans to total loans to measure the credit risk of MFIs (Barrios & Blanco, Citation2003; Schulte & Winkler, Citation2019). The ratio has been used in the extant literature to capture the ineffectiveness of the loan management systems of MFIs, as well as, the negative impact of the information asymmetry, moral hazard and adverse selection in loan management. Low values are preferable and are signs that loan management is effective. Figure presents the conceptual framework for the study. This depicts the three data categorizations for the analysis covering the deposit-taking MFIs, the non-deposit-taking MFIs and the pooled list of MFIs. The diagram presents the hypothesized determinants of MFIs covering non-performing loans, income diversification, MFI size, profitability, liquidity or lending channels, capital risk and economic growth.
Figure 2. Conceptual framework on the determinants of capital adequacy of MFIs.
Income diversification is measured using the Laeven and Levine (Citation2007) approach which shows the extent to which MFIs diversify their revenue streams (Acharya et al., Citation2006). Typically, interest income is the traditional income source but non-interest incomes could be earned from fees and commissions, among others. Firms that choose a focused strategy derive their income from interest-bearing loans while firms that choose a diversified strategy generate revenue from multiple sources. Assuming that net is the net interest income, non is the non-interest income (or the other operating income), while totinc is the total income, then income diversification (IDIV) index can be presented mathematically as follows:
The natural logarithm of total assets is utilised to measure the size of MFIs in line with earlier studies (Barrios & Blanco, Citation2003; Thoa et al., Citation2020; Yu*, Citation2000). Return on asset is measured using the profit before tax to total assets in line with earlier studies that used it as a profitability proxy (Das & Rout, Citation2020; Thoa et al., Citation2020; Yu*, Citation2000). The higher the ratio the better the financial profitability of the firms and vice versa. The lending channel among MFIs is measured by the loan to total assets of the firms which is a liquidity metric (Soumaré et al., Citation2020). The higher the ratio, the larger the loan portfolio and the higher the extent of lending by the MFI. Lending completes the process of financial intermediation among deposit-taking MFIs. Also, in non-deposit-taking MFIs, they could get funds from outright donor grants and government subsidies which they will have to use to provide credit to their customers.
The equity-to-asset ratio has also been utilised to control for the equity base of the firms as against their non-risk adjusted assets. This metric has been used in the literature consistently as a proxy for capital risk. There are macroeconomic factors that affect the capital adequacy ratio as is evident in the literature (Bernanke & Gertler, Citation1989; Shleifer & Vishny, Citation2010). This study controls for the quarterly gross domestic product growth, which reflects the business and economic activity in the country. The index is sourced from the Ghana Statistical Service. Table presents the variables used for the study.
Table 2. Description of variables
4.4 Econometrics Model
This study uses the following regression model in line with earlier studies such as Soumaré et al. (Citation2020) and Tchuigoua (Citation2016) to address the research question. We apply the 2SLS regression to account for endogeneity by using an appropriate instrumental variable underpinned by economic theory and tested statistically. As a means to explore the determinants of voluntary capital adequacy buffer, we also run the same models for all the equations but report results only for the linear models under the 2SLS. In EquationEquation 4(4)
(4) , we present the OLS model which we regard as insufficient since it does not account for endogeneity. Also, EquationEquations 5
(5)
(5) and Equation6
(6)
(6) are the 2SLS models for the first stage and second stage, respectively. The mathematical equations are presented as follows:
OLS Equation:
2SLS Stage 1 Equation:
2SLS Stage 2 Equation:
Where CAR is the capital adequacy ratio (we conducted additional analysis with voluntary capital buffer as a dependent variable), NPL is the ratio of non-performing loans to total loans, IDIV is the income diversification index, SIZE is the size of the firm, ROA is the return on asset, LOTA is the loan to total assets, ETA is the equity to total assets, and QGDPG represents quarterly GDP growth (a macroeconomic indicator). PAIDUP represents the paid-up capital which is used as the instrumental variable for ETA under the IVREG (2SLS instrumental variable regression). Also, is the predicted or fitted values of ETA based on the first stage regression. Moreover, we have the constant terms, regression coefficients and the error terms as ε, μ and ϵ. The data vary by time, indexed as t(2015q2, 2015q3, … , 2018q3, 2018q4), and by firm, i(1, 2, … , 439). Given that loans and advances to total asset ratio (LOTA) correlates with ROA, we did not include both in the same model. We conduct the same analysis we run for ROA for LOTA for all scenarios.Footnote2
The OLS regression specified suffers from endogeneity so the 2SLS model is the ideal choice. We provide the results of the OLS as a comparator for the main analysis. We use the 2SLS model with the voluntary capital buffer as the dependent variable to conduct additional assessments. Also, we included quadratic variables for income diversification and firm size to explore the curvilinear nature of the relationships. Additionally, because of the variabilities in the years, the quarter dummy has been inculcated into the model with quarter 2 of 2015 (2015q2) as the reference quarter to explore the effect on the dependent variable and its impact on the other explanatory variables. Besides, the analyses captured the disparities among MFIs with deposits on their balance sheet and those without deposits (mostly classed as Tier 3 – i.e. Financial Non-Governmental Organizations in most cases) to explore the disparities in the relationships as reported in the Figures. Finally, as part of the auxiliary analysis, we used a simple OLS to explore the effect of the interaction between ETA and ROA (their joint impact) on CAR.
4.5 Addressing Endogeneity Problem
In this study, the ordinary least squares regression was used as a comparator but the main results are based on the 2SLS regression with instrumental variables. Like previous studies on capital adequacy, the specified models tend to suffer from the problem of endogeneity either due to the omission of variables, errors-in-variables, or simultaneous causality (Larcker & Rusticus, Citation2010). Endogeneity happens when a regressor is correlated with an error term which could lead to wrong and biased inferences under the OLS approach. There are two main ways to address the endogeneity problem either through the use of an ad-hoc approach that uses lags or proxies as applied by Soumaré et al. (Citation2020) and Tchuigoua (Citation2016) or by the use of instrumental variables. The ad-hoc solutions are simple, appealing and require limited additional data but come with a number of limitations. The ad-hoc approaches used by the aforementioned studies lead to a loss of precision, there is no way to gauge empirically how serious the endogeneity problem is and interpretation could be difficult since the new variables are merely proxies. The best way to deal with endogeneity is through the use of instrumental variables because it is transparent, and is amenable to empirical testing. In this study, we use the 2SLS which is the most common instrumental variable estimator to address the endogeneity problem that our model suffers from.
In our model, ETA has the tendency to be endogenous. First of all, both capital adequacy and equity-to-asset ratio could be jointly determined simultaneously. For instance, the decision of an MFI to raise its equity by reducing dividend payouts or increasing retained earnings might be influenced by its capital adequacy. Second, MFIs may be involved in strategic adjustment of equity to asset ratios based on their expectations of future capital adequacy requirements which could introduce endogeneity. The omission of unobserved variables that affect both equity-to-asset ratio and capital adequacy ratio could result in the correlation between ETA and the error term. In this study, we utilized an instrumental variable to address this endogeneity problem. For us to have the right instrument, we need an instrument that correlates strongly with ETA, does not correlate with capital adequacy, and is intuitive. We used the ratio of paid-up capital to total assets to account for changes in regulation and as an instrumental variable. This is because it is strongly correlated with equity to the asset but not directly related to the capital adequacy ratio. We conducted standard endogeneity tests to confirm the endogeneity of ETA, we rejected the null hypothesis of weak instrumental variables and we found that overidentification is not a problem (Angrist & Pischke, Citation2009; Cragg & Donald, Citation1993; Stock, & Yogo, Citation2005). Specifically, we expect the test statistics for endogeneity to be statistically significant for us to reject the null hypothesis of exogeneity. Also, we expect to have first-stage F-statistics that are higher than the benchmarked values to reject the null hypothesis that the instrument used is weak.
5. Results and Discussions
In this section, the results of the analyses have been presented and discussed vis-à-vis the findings of earlier studies or practical knowledge about the financial sector.
5.1 Descriptive Statistics
The results of the descriptive statistics are presented in Table revealing the statistics for the pooled data, and also as segregated by whether an MFI is deposit-taking or not. We also conducted a t-test and reported the mean difference.
Table 3. Descriptive statistics – pooled, deposit-taking and non-deposit-taking MFIs
The results show that the capital adequacy ratio of MFIs over the period is 37.5% with a relatively high average recorded for non-deposit-taking MFIs. The non-performing loans average about 28.5% of the total loans and advances of the firms with the relatively higher average recorded by deposit-taking firms. At an industry level, these are above the regulatory minimum of 10% over the study period as required by the Bank of Ghana,Footnote3 or the requirements under Basel II or Basel III. The income diversification index is an average of 0.23 and deposit-taking firms report a relatively high average. The natural logarithm of total assets is an average of 13.912 representing an average of about GHC3,368,547.7 (representing US$698,868.81 in December 2018) and deposit-taking firms are found to be larger. It is worth noting that the social impact on the pro-poor populations that these MFIs serve goes beyond the mere value of total values that these institutions have. Overall, the return on asset of the firms is −1% where deposit-taking firms record a loss of 0.02% while non-deposit-taking firms have made a loss of 5.1%. The loan-to-total-asset ratio is 50.9% with relatively higher rates evident among non-deposit-taking firms. Also, the average equity to total assets is generally 26% with non-deposit-taking firms recording higher levels. The quarterly GDP records an average of 4.885% in the pooled data.
5.2 Correlation and Multicollinearity
The study tests for correlation and multicollinearity among the explanatory variables which are presented in Table . The results indicate that the data does suffer from multicollinearity in case we include both ROA and LOTA which are highly correlated in the same model. Wooldridge (Citation2016) argued that a variance inflation factor (VIF) below 10 is acceptable as the regression coefficients will be globally stable in that case. Thus, we proceed to estimate separate models for ROA and LOTA to avoid the problem of multicollinearity.
Table 4. Correlation and variance inflation factor
5.3 Determinants of Capital Adequacy
The results of the analysis are presented in Tables , while Figures are stratified based on the deposit-taking MFIs, and non-deposit taking MFIs. The models are generally statistically significant based on the F-statistics and Wald χ2 which reveal that the explanatory variables combine to explain the variabilities in capital adequacy of the MFI.Footnote4 We discuss the results where we excluded the LOTA and later discuss when we excluded ROA.
Figure 3. Determinants of capital adequacy ratio among deposit-taking microfinance firms.
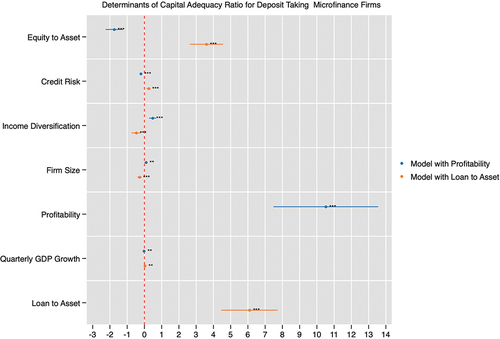
Figure 4. Determinants of capital adequacy ratio among non-deposit-taking microfinance firms.
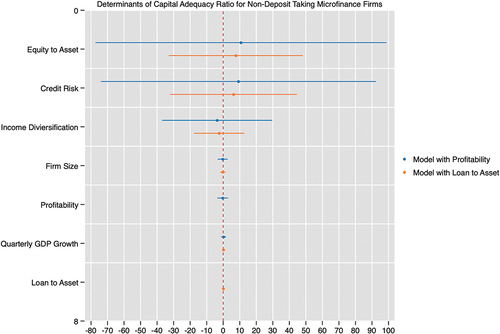
Table 5. Determinants of capital adequacy of microfinance institutions—ROA model
Table 6. Determinants of capital adequacy of microfinance institutions—LOTA model
The results show that non-performing loans, which are a measure of credit risk, have a negative and significant effect on the capital adequacy of MFIs at 1% significant level. This is evident in all two models (under the 2SLS and OLS) and even after interacting some variables and including a time-fixed effect. We observe in Figure that a more positive effect is evident among non-deposit-taking MFIs. This negative result suggests that ineffective loan management which leads to non-performance of loans can deplete the capital adequacy of MFIs. The negative effect is evident in Thoa et al. (Citation2020) but is statistically insignificant. The result is in tandem with Barrios and Blanco (Citation2003) which regard credit risk as one of the market forces that drive the capital adequacy of financial institutions. We observe that the positive impact evident among the non-deposit-taking MFIs could be driven by the fact that, these institutions which are part of the Tier 3 category of the Bank of Ghana include Financial Non-Governmental Organisations (FNGOs)Footnote5 which have been operating in the system since the 1990s, with the introduction of innovative microfinance approaches (World Bank Group, Citation2016). As such, based on their social impact objective, non-performing loans will be the basis for which the promoters either local or international aim to contribute more to shore up their capital buffer in lure of meeting their social impact mandate.
The study found a positive significant linear impact of income diversification on the capital adequacy of MFIs at a 1% significant level. Also, in the quadratic models (Models 2 and 6 in Table ) we found evidence of a positive effect of income diversification on capital adequacy. However, we observed in Figure that only the results for the deposit-taking MFIs are statistically significant at a 1% level. The results show that income diversification enhances the capital adequacy of MFIs. In the extant literature, Duho et al. (Citation2020) found that income diversification has a U-shaped impact on financial stability but we do not find any evidence of a curvilinear link. Moreover, our study is in line with previous MFI literature (Acharya et al., Citation2006; Galema et al., Citation2011), which argued that for the purpose of enhancing their financial sustainability, MFIs tend to explore various non-traditional financial activities to raise income and maintain their capital buffer. Our results are also in line with the intuition that the non-deposit-taking MFIs do not have the regulatory space to do other income-generative activities as the deposit-taking ones do, which could affect their ability to leverage diversification to shore up their capital base.
The results reveal a positive and significant impact of MFI size on capital adequacy in the linear models. We also observe a curvilinear relationship in the quadratic models, which show an inverted U-shape nexus at a 1% significant level. This suggests that while size could initially drive capital adequacy high, this reduces as the MFIs increase in size. This shows that size does matter when it comes to capital adequacy and so regulations regarding capital adequacy should pay attention to the size of MFIs. This is in tandem with earlier findings of studies like Tchuigoua (Citation2016), Thoa et al. (Citation2020) and Yu* (Citation2000) who found a statistically significant impact. In Figure , we observe that the positive impact is more driven by the deposit-taking firms as non-deposit-taking MFIs rather have a negative impact of size on capital adequacy. Similar to the arguments made earlier, these FNGOs within the Tier 3 category have significant capital adequacy driven by the promoters based on their mission, and the financial wherewithal of the supporting agencies or individuals. Thus, it is possible to find a relatively smaller MFI in this category increasing its capital adequacy even more than the larger ones.
The effect of return on asset on capital adequacy in the composite model is positive and significant at 1%. This is where the 2SLS model provides a different result from that of the OLS model. This result is replicated in the case of deposit-taking MFIs but in the case of non-deposit-taking MFIs, the results are negative and statistically insignificant. The findings suggest that in the case of deposit-taking MFIs, a high return on asset increases capital adequacy but the return on asset inhibits capital adequacy among non-deposit-taking firms. There are concerns about the state of deposit insurance among the deposit-taking institutions in Ghana. Deposit insurance is a component of a financial system safety net that promotes financial stability. Deposits are not insured by the government of Ghana but a Deposit Protection Scheme has been created under the Ghana Deposit Protection Act 2016, Act 931, to serve somewhat as insurance of deposits with a financial institution. The findings suggest that profitable deposit-taking MFIs (and not non-deposit-taking MFIs) may have an adequate amount of capital to deal with some unexpected losses. Simply put, profitability does yield some increase in the capital buffer of the MFIs. As can be observed from the direction and magnitude of impact in Figure , deposit-taking MFIs that are profitable have a strong potential to channel dividends to their shareholders in hard economic times to shore up their regulatory capital but non-deposit-taking MFIs have little potential to do so. Thoa et al. (Citation2020) and Soumaré et al. (Citation2020) found that profitability has an insignificant effect on capital adequacy, but our study shows a significant impact which intuitively aligns with how the MFIs operate in Ghana.
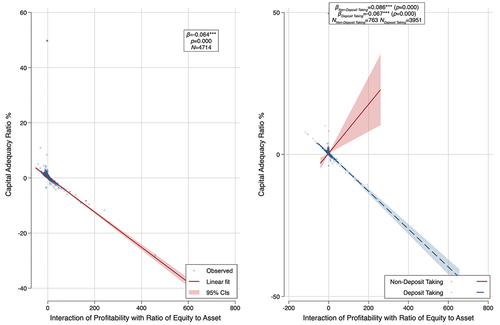
Additionally, the ratio of equity to asset of MFI negatively impacts capital adequacy suggesting that high equity values will drive down regulatory capital adequacy. This is another case where the OLS presents inconsistent results after we accounted for endogeneity under the 2SLS model. This is intuitive as the shareholder’s capital (or promotor’s contributions) is what is risk-adjusted to form part of the capital held. Operationally, high equity to asset firms could be regarded as conservative. This feature could affect the extent to which they absorb risks. This could eventually reduce the proportion of asset holdings they have that are exposed to risk. With this, the risk-weighted assets (RWA) of these firms will be higher than their counterparts leading to a lower capital adequacy ratio. We found a similar result among the deposit-taking MFIs but not among the non-deposit-taking MFIs. We further explore what happens to capital adequacy when MFIs make a profit but at the same time have high equity as reported in Figure . The deposit-taking MFIs have a lesser social impact mandate and so they will rather channel resources to owners in the case where profit and equity increase, leading to a decline in capital adequacy in that scenario. On the other hand, when profitability and capital risk (equity to asset) are interacted, non-deposit-taking MFIs tend to have a positive significant impact on their capital adequacy which is not evident for the deposit-taking MFIs.Footnote6
Figure 5. Interaction of profitability and equity to total assets on capital adequacy.
We report the models that include LOTA (a proxy for lending channel) in Table and as evident the results are similar, so we discuss only the result for the impact of loans and advances to assets on capital adequacy. The results regarding the effect of loan-to-asset on capital adequacy are negative and significantly driven by the non-deposit-taking MFIs as reported in Figure . The findings show that high loan portfolios enhance capital adequacy among deposit-taking MFIs but it reduces capital adequacy in the case of non-deposit-taking MFIs. This can be attributed to the fact that given the restriction on non-deposit-taking MFIs, their key mandate is on loaning the grants they receive but not through a full channel of financial intermediation in the form of a full vicious cycle (from deposit → loans → loan repayments → deposits) as deposit-taking MFIs. In this vein, deposit-taking MFIs tend to increase their capital adequacy as a way to protect the deposits they receive on every cedi of loan they offer, but this is not needed among non-deposit-taking MFIs. Thoa et al. (Citation2020) found a negative and insignificant effect of lending channels on capital adequacy, but our results show the relevance of lending channels in influencing capital adequacy.
The results suggest that GDP which measures economic activity has a negative significant effect on capital adequacy. This may be attributed to the possible growth in MFI capital base within these periods without necessarily increasing the regulatory risk-adjusted capital base of the institutions. We also observe that the impact was reduced when we controlled for quarterly fixed effects and in such cases, GDP does not significantly impact capital adequacy.
5.4 Determinants of Voluntary Capital Buffer in line with Basel II, Basel III and Bank of Ghana Requirement
The Basel II and III frameworks provide a range of capital adequacy levels that banks need to hold as a conservative measure. We utilised these and the capital buffer requirements of the Bank of Ghana for MFIs to explore the factors that drive the institutions to keep capital beyond this buffer, which we refer to as a voluntary capital buffer. This is presented in Tables , revealing the estimations under i) the Bank of Ghana’s 10% regulatory capital requirement during the study period, ii) Basel II—a range of 8% to 11%, and iii) Basel III—a range of 10.5% to 13% (2.5% being the conservative buffer). We also presented the split of these results for Deposit-Taking MFIs and the Non-Deposit-Taking MFIs in Tables .
Table 7. Determinants of voluntary capital buffer (ROA model)
Table 8. Determinants of voluntary capital buffer (LOTA model)
Table 9. Voluntary capital buffer by deposit-taking and non-deposit-taking MFIs (ROA model)
Table 10. Voluntary capital buffer by deposit-taking and non-deposit-taking MFIs (LOTA model)
Using the 2SLS regression model, we find evidence to suggest that the determinants of the voluntary capital buffer are credit risk, income diversification, firm size, profitability and equity-to-asset ratio. Credit risk and equity-to-asset ratio have a negative impact while income diversification, firm size, and profitability have a positive impact on capital adequacy ratio. We found that controlling for quarter fixed effect, firm size and GDP does not drive voluntary capital buffer at the maximum capital holdings as per Basel III (13%). Overall, we find that size does not matter as a factor for holding capital above 13%. In effect, there could also be some other non-financial factors which are not observable within the financial information that may be driving the voluntary buffers kept by the MFIs. We further split the results into two groups of MFIs and found that the results are strongly driven by Deposit-Taking MFIs. We found that results are generally stronger in the models with ROA than in the models with LOTA.
6. Conclusions and Implications for Practice, Policy and Future Research
This study explored the determinants of the capital adequacy and voluntary capital buffer of MFIs in an emerging country context using recent data from Ghana. The literature has predominantly focused on the capital adequacy of banks while exempting microfinance institutions which usually focus on the poor, low-income earners and the unbanked population. The study used data on 439 MFIs from the second quarter of 2015 to 2018, to explore the determinants of both capital adequacy and voluntary capital buffer of the institutions by creating scenarios for buffers under Basel II, Basel III and the prevailing minimum capital requirement during the study period. As a means to appropriately design and model our analysis, we used ratios for the variables and also created a dichotomous variable based on the required rates of the global best practice framework and the Bank of Ghana to proxy for voluntary capital buffer. We used the 2SLS instrumental variable model to account for endogeneity in conducting our investigation.
Overall, we found that non-performing loans, income diversification, firm size, return on asset, loans-to-asset ratio, equity-to-asset ratio and gross domestic product significantly affect capital adequacy. Although economic growth appears to inhibit capital adequacy, this is not significant when we control for time-fixed effects. Generally, there are some disparities as to whether it is an MFI that is deposit-taking or non-deposit-taking (i.e. Tier 3 like Financial Non-Governmental Organisations). We found that using the Bank of Ghana’s regulatory threshold of 10% and the various Basel II and Basel III thresholds to estimate voluntary capital buffer, all the explanatory variables affect voluntary capital buffer except buffer above the upper limit of Basel III where size and GDP do not have significant impact.
Specifically, the findings show that effective credit risk management enhances capital adequacy, but for non-deposit-taking MFIs, because of their social impact mandate, capital adequacy increases even in spite of poor loan management. Also, income diversification increases capital adequacy, especially among deposit-taking MFIs which have the regulatory liberty to engage in additional financial intermediation activities. Firm size has an inverted U-shape nexus with capital adequacy and there is evidence to suggest that for non-deposit-taking MFIs, size may not matter but rather the goals and resource capacity of their promoters or owners in increasing capital adequacy. We found that profitability enhances growth in capital adequacy which could suggest that profitable deposit-taking MFIs (and not non-deposit-taking MFIs) may have an adequate amount of capital to deal with some unexpected losses. The equity base and the lending channels decrease capital adequacy, but the effect is stronger for deposit-taking MFIs as compared with the Tier 3 MFIs. We also find evidence to suggest that economic growth reduces capital adequacy since asset values may be higher in those periods, but when we control for the quarter-fixed effect, the results are insignificant. The results throw light on the application of the capital buffer theory in the MFI context and are relevant for practitioners, policymakers and regulators such as the Bank of Ghana and Financial Stability Council in their deliberations regarding a post-COVID-19 economic revitalisation, as well as academics.
The results have implications in three ways for practitioners, policymakers or regulators and the academic community. For practitioners, the study reveals the different factors that drive capital adequacy and voluntary capital buffer based on a tiered system of deposit-taking. We observe that the social impact focus of Financial NGOs reduces the agency problem and enables them to align with the capital buffer theory, even more than the deposit-taking MFIs. These results point to managers of MFIs to consider the firm-specific factors examined—credit risk strategy, income diversification strategy, size, profitability, lending channel, and capital risk in their quest to maintain their capital adequacy which is a metric that is monitored by the regulator, and even voluntary capital buffer levels. It also points to the relevance of effective loan management and the need for different strategies in firms that engage fully in intermediation as they take deposits and give loans. Policy-wise, the findings have implications for the role of the Bank of Ghana, GHAMFIN and the Financial Stability Council, pointing out the firm-specific factors which should be considered in enhancing capital adequacy which is a macro-prudential policy tool.
Future researchers could explore the state of capital adequacy disclosures and the link with governance indicators. Others could also explore how the COVID-19 pandemic has influenced the risk management and capital adequacy of financial institutions. Researchers can explore the role of MFIs in funding the seed stage of new businesses and projects. Other studies can explore whether microfinance is a type of entrepreneurial finance that can replace other forms of financing like angel investment and venture capital, or even whether it will be useful for emerging areas like green and carbon financing. The question as to whether or not microfinance is an instrument for allocating credit to start-ups and new ventures is also worth considering. Studies on the application of technologies to various operations of MFIs are limited and there are no clear empirical conclusions on how MFIs could drive development agenda like the African Continental Free Trade Area. Other studies could also explore how the MFIs are responding to the introduction of FinTech tools and the electronic levy. Future researchers can also consider an experimental design in examining the various issues in MFIs, an area which is still grey.
Public Interest Statement.docx
Download MS Word (14.3 KB)Author Biographies.docx
Download MS Word (13.3 KB)Disclosure statement.docx
Download MS Word (12.6 KB)Acknowledgments
The author acknowledges the constructive feedback of three anonymous reviewers in improving the article. The author also thanks Rhoda Ladjer Akuaku for proofreading the manuscript. This article benefited from comments from the members of the Dataking Research Lab and the AuthorAID Ghana Hub.
Disclosure statement
No potential conflict of interest was reported by the author.
Data availability statement
Data is available upon reasonable request.
Supplemental material
Supplemental data for this article can be accessed online at https://doi.org/10.1080/23322039.2023.2285142
Additional information
Funding
Notes on contributors
King Carl Tornam Duho
King Carl Tornam Duho (ACMA CGMA CA) is an IMF Youth Fellow with 10+ years of experience in the private sector, academia and public policy. He is now a Research Professional with the University of Chicago Booth School of Business. He is the Founder of the Dataking Research Lab, Dataking Consulting (https://datakingconsulting.com/). King holds a Master of Philosophy in Accounting. He has presented at over 30 conferences in Europe, North America, Asia and Africa. King has spoken at the 2022 spring and annual meetings of the IMF/WBG and led various national-level projects as a policy expert. He was the VP of R&D of Ghana’s Fintech and Payments Association. His research focus is on the modern view of accounting with a strong link with economics and public policy. His over 25 peer-reviewed articles appeared in the Journal of Economic Studies, and the International Journal of Managerial Finance, among others.
Notes
1. We observe that although the quarterly data was tagged with pseudo-names, a critical look at the equity trajectories show that organising it in a full panel format may be problematic, as different MFIs could possibly be linked to others. We inculcated this in our regression analysis to ensure our results present the reality.
2. Additional analysis where we included both ROA and LOTA in the same model yielded results of the same power except for change in the direction of impact of LOTA from negative to positive.
3. Bank of Ghana adjusted its capital adequacy requirements from 10 percent to 13 percent, effective April 1, 2022.
4. In some situations, for the 2SLS, we found negative R squared so we did not report them. Negative R squared does not undermine the results in any way. At any rate, the R squared does not have any statistical meaning in the context of 2SLS or instrumental variable.
5. As per classification, Tier 3 institutions also include Money Lending Companies (similar to Finance Houses) but because they also are allowed to often mobilize funds with the aim to pay interests on investments, the Bank of Ghana has been making efforts to raise its minimum capital requirements. It is also worth noting that, Bank of Ghana tend to have a tighter regulatory attention on the FNGOs even more than the other mainstream MFIs (like the Microfinance Companies in Tier 2).
6. These results are consistent whether we use the OLS model or the 2SLS in a simple model where we regress capital adequacy on the interaction of profitability and equity to asset while the latter is additionally treated as endogenous.
References
- Acharya, V. V., Hasan, I., & Saunders, A. (2006). Should banks be diversified? Evidence from individual bank loan portfolios. The Journal of Business, 79(3), 1355–33. https://doi.org/10.1086/500679
- Ali, I., Mia, M. A., Azman, A., & Masron, T. A. (2023). Factors affecting multiple borrowing among microfinance clients: Evidences from Bangladesh. Asia-Pacific Journal of Business Administration, 15(1), 72–95. https://doi.org/10.1108/APJBA-06-2021-0250
- Ali, A., Ramakrishnan, S., Faisal, F., & Ullah, Z. (2022). Bibliometric analysis of global research trends on microfinance institutions and microfinance: Suggesting new research agendas. International Journal of Finance & Economics, 28(4), 3552–3573. https://doi.org/10.1002/ijfe.2607
- Angrist, J. D., & Pischke, J. S. (2009). Mostly harmless econometrics: An empiricist’s companion. Princeton University Press.
- Ashta, A., & Mor, S. (2022). Is microcredit a reverse innovation? FIIB Business Review, 11(2), 225–234. https://doi.org/10.1177/2319714520962924
- Bank of Ghana. (2022). Annual report and financial statements 2021. Bank of Ghana. https://www.bog.gov.gh/wp-content/uploads/2022/06/AnnRep-2021.pdf
- Banna, H., Mia, M. A., Nourani, M., & Yarovaya, L. (2022). Fintech-based financial inclusion and risk-taking of microfinance institutions (MFIs): Evidence from Sub-Saharan Africa. Finance Research Letters, 45, 102149. https://doi.org/10.1016/j.frl.2021.102149
- Barrios, V. E., & Blanco, J. M. (2003). The effectiveness of bank capital adequacy regulation: A theoretical and empirical approach. Journal of Banking & Finance, 27(10), 1935–1958. https://doi.org/10.1016/S0378-4266(02)00311-4
- Beatty, A., & Liao, S. (2014). Financial accounting in the banking industry: A review of the empirical literature. Journal of Accounting and Economics, 58(2–3), 339–383. https://doi.org/10.1016/j.jacceco.2014.08.009
- Beisland, L. A., Djan, K. O., Mersland, R., & Randøy, T. (2021). Measuring social performance in social enterprises: a global study of microfinance institutions. Journal of Business Ethics, 171(1), 51–71. https://doi.org/10.1007/s10551-019-04417-z
- Bel Hadj Miled, K. (2022). Microfinance and women entrepreneurship development: Evidence from Tunisia. SN Business & Economics, 3(1), 12. https://doi.org/10.1007/s43546-022-00381-5
- Berger, A. N., & Bouwman, C. H. S. (2013). How does capital affect bank performance during financial crises? Journal of Financial Economics, 109(1), 146–176. https://doi.org/10.1016/j.jfineco.2013.02.008
- Bernanke, B., & Gertler, M. (1989). Agency costs, net worth, and business fluctuations. American Economic Review, 79(1), 14–31.
- Bhayana, K., & Sharma, N. (2022). Sustainability of Indian microfinance institutions: Analysis of financial and social super efficiency. FIIB Business Review. https://doi.org/10.1177/23197145221125338
- Bilgin, R., & Dinc, Y. (2019). Factoring as a determinant of capital structure for large firms: Theoretical and empirical analysis. Borsa Istanbul Review, 19(3), 273–281. https://doi.org/10.1016/j.bir.2019.05.001
- Brewer, E., III, Kaufman, G. G., & Wall, L. D. (2008). Bank capital ratios across countries: Why do they vary? Journal of Financial Services Research, 34(2–3), 177–201. https://doi.org/10.1007/s10693-008-0040-9
- Cragg, J. G., & Donald, S. G. (1993). Testing identifiability and specification in instrumental variable models. Econometric Theory, 9(2), 222–240. https://doi.org/10.1017/S0266466600007519
- Das, N. M., & Rout, B. S. (2020). Banks’ capital adequacy ratio: a panacea or placebo. Decision, 47(3), 303–318. https://doi.org/10.1007/s40622-020-00255-5
- Demirguc‐Kunt, A., Detragiache, E., & Merrouche, O. (2013). Bank capital: Lessons from the financial crisis. Journal of Money, Credit and Banking, 45(6), 1147–1164. https://doi.org/10.1111/jmcb.12047
- Dewatripont, M., & Tirole, J. (1994). The prudential regulation of banks (Vol. 6). MIT Press.
- Duho, K. C. T. (2022). Risks and profitability of microfinance institutions during crisis: Empirical insights from an emerging market. International Journal of Services, Economics and Management, 13(4), 378–409. https://doi.org/10.1504/IJSEM.2022.127004
- Duho, K. C. T., Duho, D. M., & Forson, J. A. (2023). Impact of income diversification strategy on credit risk and market risk among microfinance institutions. Journal of Economic and Administrative Sciences, 39(2), 523–546. https://doi.org/10.1108/JEAS-09-2020-0166
- Duho, K. C. T., Onumah, J. M., & Owodo, R. A. (2020). Bank diversification and performance in an emerging market. International Journal of Managerial Finance, 16(1), 120–138. https://doi.org/10.1108/IJMF-04-2019-0137
- Flannery, M. J., & Rangan, K. P. (2008). What caused the bank capital build-up of the 1990s? Review of Finance, 12(2), 391–429. https://doi.org/10.1093/rof/rfm007
- Galema, R., Lensink, R., & Spierdijk, L. (2011). International diversification and microfinance. Journal of International Money and Finance, 30(3), 507–515. https://doi.org/10.1016/j.jimonfin.2011.01.009
- Garmaise, M. J., & Natividad, G. (2013). Cheap credit, lending operations, and International politics: The case of global microfinance. The Journal of Finance, 68(4), 1551–1576. https://doi.org/10.1111/jofi.12045
- Gropp, R., & Heider, F. (2010). The determinants of bank capital structure. Review of Finance, 14(4), 587–622. https://doi.org/10.1093/rof/rfp030
- Hagawe, H. M., Mobarek, A., Hanuk, A., & Jamal, A. (2023). A unique business model for microfinance institution: the case of Assadaqaat Community Finance (ACF). Cogent Business & Management, 10(1), 2135202. https://doi.org/10.1080/23311975.2022.2135202
- Hessou, H., & Lai, V. S. (2017). Basel III capital buffer requirements and credit union prudential regulation: Canadian evidence. Journal of Financial Stability, 30, 92–110. https://doi.org/10.1016/j.jfs.2017.05.002
- Jiménez, G., Ongena, S., Peydró, J.-L., & Saurina, J. (2017). Macroprudential policy, countercyclical bank capital buffers, and credit supply: Evidence from the Spanish dynamic provisioning experiments. Journal of Political Economy, 125(6), 2126–2177. https://doi.org/10.1086/694289
- Jokipii, T., & Milne, A. (2011). Bank capital buffer and risk adjustment decisions. Journal of Financial Stability, 7(3), 165–178. https://doi.org/10.1016/j.jfs.2010.02.002
- Khan, S., Bashir, U., & Islam Md, S. (2021). Determinants of capital structure of banks: Evidence from the Kingdom of Saudi Arabia. International Journal of Islamic & Middle Eastern Finance & Management, 14(2), 268–285. https://doi.org/10.1108/IMEFM-04-2019-0135
- Laeven, L., & Levine, R. (2007). Is there a diversification discount in financial conglomerates? Journal of Financial Economics, 85(2), 331–367. https://doi.org/10.1016/j.jfineco.2005.06.001
- Larcker, D. F., & Rusticus, T. O. (2010). On the use of instrumental variables in accounting research. Journal of Accounting and Economics, 49(3), 186–205. https://doi.org/10.1016/j.jacceco.2009.11.004
- Lindquist, K.-G. (2004). Banks’ buffer capital: How important is risk. Journal of International Money and Finance, 23(3), 493–513. https://doi.org/10.1016/j.jimonfin.2004.01.006
- Mia, M. A., Lee, H.-A., Chandran, V. G. R., Rasiah, R., & Rahman, M. (2019). History of microfinance in Bangladesh: A life cycle theory approach. Business History, 61(4), 703–733. https://doi.org/10.1080/00076791.2017.1413096
- Mili, M., Sahut, J.-M., Trimeche, H., & Teulon, F. (2017). Determinants of the capital adequacy ratio of foreign banks’ subsidiaries: The role of interbank market and regulation. Research in International Business and Finance, 42, 442–453. https://doi.org/10.1016/j.ribaf.2016.02.002
- MoFEP. (2022). The budget statement and economic policy of the government of Ghana for the 2023 financial year. Ministry of Finance and Economic Planning, Republic of Ghana. https://mofep.gov.gh/sites/default/files/budget-statements/2023-Budget-Statement-V5.pdf
- Neisen, M., & Roth, S. (2018). Basel IV: The next generation of risk weighted assets. John Wiley & Sons.
- Ortino, M. (2019). Thirty years after the Basel accord and ten after the financial crisis: The Basel committee on banking supervision and its place in international economic law. Journal of International Economic Law, 22(2), 159–161. https://doi.org/10.1093/jiel/jgz019
- Pereira, J. A. C. M., & Saito, R. (2015). How banks respond to Central Bank supervision: Evidence from Brazil. Journal of Financial Stability, 19, 22–30. https://doi.org/10.1016/j.jfs.2015.05.001
- Rai, A., & Ravi, S. (2011). Do spouses make claims? Empowerment and microfinance in India. World Development, 39(6), 913–921. https://doi.org/10.1016/j.worlddev.2009.10.019
- Ramirez, J. (2017). Handbook of Basel III Capital: Enhancing bank capital in practice. John Wiley & Sons.
- Ribeiro, J. P. C., Duarte, F., & Gama, A. P. M. (2022). Does microfinance foster the development of its clients? A bibliometric analysis and systematic literature review. Financial Innovation, 8(1), 34. https://doi.org/10.1186/s40854-022-00340-x
- Saif-Alyousfi, A. Y. H., Md-Rus, R., Taufil-Mohd, K. N., Mohd Taib, H., & Shahar, H. K. (2020). Determinants of capital structure: Evidence from Malaysian firms. Asia-Pacific Journal of Business Administration, 12(3/4), 283–326. https://doi.org/10.1108/APJBA-09-2019-0202
- Schulte, M., & Winkler, A. (2019). Drivers of solvency risk–are microfinance institutions different? Journal of Banking & Finance, 106, 403–426. https://doi.org/10.1016/j.jbankfin.2019.07.009
- Shleifer, A., & Vishny, R. W. (2010). Unstable banking. Journal of Financial Economics, 97(3), 306–318. https://doi.org/10.1016/j.jfineco.2009.10.007
- Soumaré, I., Tchakoute Tchuigoua, H., & Hessou, H. T. S. (2020). Are microfinance institutions resilient to economic slowdown? Evidence from their capital ratio adjustment over the business cycle. Economic Modelling, 92(C), 1–22. https://doi.org/10.1016/j.econmod.2020.07.006
- Stock, J. H., & Yogo, M. (2005). Testing for weak instruments in linear IV regression. In D. W. K. Andrews & J. J. Stock (Eds.), Identification and Inference for Econometric Models: Essays in honor of Thomas J. Rothenberg (pp. 80–108). Cambridge University Press.
- Tchuigoua, H. T. (2016). Buffer capital in microfinance institutions. Journal of Business Research, 69(9), 3523–3537. https://doi.org/10.1016/j.jbusres.2016.01.034
- Thoa, P. T. X., Anh, N. N., & Minh, N. K. (2020). The determinant of capital adequacy ratio: Empirical evidence from Vietnamese banks (a panel data analysis). Afro-Asian Journal of Finance and Accounting, 10(1), 60–70. https://doi.org/10.1504/AAJFA.2020.104406
- Wooldridge, J. M. (2016). Introductory econometrics: A modern approach (6th ed.). Cengage learning.
- World Bank Group. (2016) . Ghana’s microfinance sector: Challenges, risks and recommendations.
- Yu*, H. (2000). Banks’ capital structure and the liquid asset–policy implication of Taiwan. Pacific Economic Review, 5(1), 109–114. https://doi.org/10.1111/1468-0106.00093
- Zainuddin, M., & Yasin, I. M. (2020). Resurgence of an ancient idea? A study on the history of microfinance. FIIB Business Review, 9(2), 78–84. https://doi.org/10.1177/2319714520925933