
 ?Mathematical formulae have been encoded as MathML and are displayed in this HTML version using MathJax in order to improve their display. Uncheck the box to turn MathJax off. This feature requires Javascript. Click on a formula to zoom.
Abstract
This study aims to assess the efficiency of housing finance companies operating in India by applying Data Envelopment Analysis (DEA). We analyse 26 housing finance companies’ efficiency using various key financial indicators. In addition to DEA, we utilised Tobit regression to investigate the determinants of efficiency in housing finance companies. The findings indicate that large firms need internal restructuring of their coefficients to achieve efficiency, while small firms maintain efficiency within their capacity in the given scenarios. The total factor productivity change for housing finance companies was the highest in 2020–21, followed by a comparative decline in the subsequent year. By considering censored or truncated data, Tobit regression allows us to identify the specific factors influencing efficiency scores derived through DEA. The independent variables used in the Tobit regression model include financial indicators and other relevant factors impacting housing finance companies’ efficiency. Overall, this study sheds light on the performance of housing finance companies and highlights the financial parameters necessary for maintaining a robust non-banking financial system in the Indian economy. The combination of DEA and Tobit regression provides a comprehensive understanding of efficiency and aids in identifying areas for improvement in the housing finance sector while benefiting policymakers and industry stakeholders alike.
1. Introduction
The efficient functioning of financial institutions in the economy indicates an optimistic signal for growth and development in the market. In a developing economy like India, non-banking financial companies (NBFCs) predominantly play a vital role vis-à-vis commercial banks towards financial intermediation by catering financial services to the last mile. NBFCs have had a somewhat unpredictable presence, survival, and growth in the Indian financial landscape since the 1960s, which are invariably named “shadow banks” or “non-banking financial intermediaries”. These institutions are not banks but bank-like financial companies. They are financial intermediaries accepting deposits, delivering credit, and channelling scarce financial resources to industries or retail customers (Zhang et al., Citation2023). They substitute banks in meeting the financial needs of corporates, delivering credit to the unorganised sector and local borrowers (Acharya et al., Citation2013). The nature of the business of shadow banks differs from country to country—they are hard to define uniformly from a global perspective. To overcome this ambiguity, the Financial Stability Board (FSB, Citation2011) defines shadow banking as “A credit intermediation system involving entities and activities outside the banking system.” The FSB definition seems to have become most acceptable in academic research. In global finance, shadow banks first gained the limelight at par with commercial banks during the global financial crisis of 2007–08. The financial crisis resulted from market misconduct and inadequate regulation (Adrian & Ashcraft, Citation2012). Shadow banks significantly created US housing bubbles by participating in banking activities such as credit intermediation, liquidity, maturity transformation, and subprime lending, as they usually did not have direct access to central bank lending and eventually experienced runs. The systemic risk of the NBFCs could not be underrated as the risk propagates among the formal financial system due to the interlinkages among the commercial banks; hence, early identification and quick policy intervention could stop the spillover in the early stage (Ghosh & Mazumder, Citation2023). As a reminder of that crisis, the shadow banking system in India has come across a perfect storm in recent times in the housing market.
With the significant growth of the shadow banks in the economy after the GFC in 2007–08, the Reserve Bank of India (RBI) in 2011, under the leadership of Ms. Usha Thorat, submitted a report by segregating the NBFCs into several categories based on their nature of operations and business model. They were classified as; Deposit and non-deposit taking, Asset finance companies, Investment companies, Loan companies, Microfinance institutions, Infrastructure finance companies, Asset reconstruction companies, Housing finance companies, and peer-to-peer lending companies. Housing finance companies (HFCs) stand out as peculiar among the various categories of NBFCs due to their innovative business models, concentration in the niche market, and substitute service providers to commercial banks. Including the fact that it is the second-largest borrower of funds from the financial system, with a gross payable of around ₹7.40 lakh crore, compared to ₹12.46 lakh crore for the NBFC sector as a whole as of March 2022 (RBI, Citation2021). The recent collapse of leading housing finance companies such as; Dewan Housing Finance Ltd. (DHFL) and Reliance Capital in 2018 posed a systemic risk to the allied sectors of the economy (Chandrasekhar, Citation2020). Initially, the crisis started in the housing market and slowly aggravated real estate and infrastructure financing, as the sectors are closely interconnected. The collapse of Infrastructure and Leasing Financial Services Ltd (IL&FS) and Srei Infrastructure Ltd is a testament to the crisis. That could be related to governance failure, asset liability mismatch or liquidity mismanagement. When the housing market started reviving after the liquidity crisis, the COVID-19 pandemic hit the market badly, followed by the regulators’ over-imposition of the prudential norms. In 2019, the regulatory shifting of HFCs happened from the National Housing Bank (NHB) to RBI, which put the housing companies in trouble, as the regulator is trying to manage the HFCs like the commercial banks. Among the emerging economies, shadow banks in India have registered exaggerated growth as these entities operate outside the regulatory purview; thus, their activities lead to the system’s fragility of the overall financial system (Bhattacharjee & Pati, Citation2022). Therefore, their efficiency evaluation under a regulated environment is equally important as banks in India, as the HFCs have to prudentially adhere to the regulatory norms imposed by the RBI from time to time.
The literature on the efficiency measurement of NBFCs, particularly HFCs, is scarce (Dutta et al., Citation2020; Sufian, Citation2007). Much of the shadow banking literature also highlighted the paucity of research in developing countries due to the unavailability of the data, which created enthusiasm and eagerness among the researchers to examine this sector from different angles. The interconnectedness of the shadow banks with the commercial banks could be traced in the early stage with the help of network-based measures as crises are becoming frequent as well as the contagion of risk is becoming prominent due to the dense linkages among the financial institutions (Chaturvedi & Singh, Citation2022).HFCs, especially among the NBFCs categories, are gaining market attention for various reasons; as the sector is financed through capital market instruments and also highly interconnected by way of borrowings from commercial banks, their failures will amplify the systemic risk to the formal financial system of the country (“Ahmad et al., Citation2019”; “FSB, Citation2011”; “Pozsar, Citation2008”; “Sinha, Citation2013”). It is popularly called “Money market funding of capital market lending” (Mehrling et al., Citation2013). Hence this study has considered various determinants to examine the efficiency of the HFCs in India, as all the HFCs are regulated by the RBI irrespective of their asset size.Footnote1
This study is showcased through the following sections in this manuscript. The initial section begins by explaining the Indian housing finance sector in the current landscape, followed by an organised literature review that provides an in-detailed observation of the efficiency analysis. The fourth section highlights the rationale for considering DEA on HFCs, followed by the detailed methodology in the fifth section. This is followed by an empirical analysis and findings in the sixth section, and the seventh section presents the conclusion along with implications, limitations and future directions for this study.
2. Housing finance companies in the current landscape
With credit growth outpacing commercial banks, NBFCs have emerged as key players in the financial sector. Customers were pulled to HFCs due to their well-developed collection system, quick decision-making process, and quick service response. HFCs were willing to take on additional risks and lend to small and medium-sized enterprises and other businesses that banks could not lend to due to creditworthiness issues in exchange for a marginally higher return. Commercial banks have been making home loans to their customers since the early 2000s. The market became more competitive when they intensively forayed into this industry by creating separate housing finance verticals to provide services in India. However, the entry of private players in the housing space enhanced the competition within the industry. As of 31 March 2021, we have 100 + active companies on the land to provide services in the market (NHB, Citation2021). As mentioned in Table , several leading commercial banks sponsor 06, and few are backed by strong parental holding, which creates a distinction among the players when confronting a sectoral crisis. In addition, the HFCs are also classified as deposit-taking and non-deposit-taking. Depending on the intensity of the interconnectedness with the formal financial system, efficiency measurement is the need of the hour for providing a holistic solution to the market.
Table 1. No. Of HFCs registered under NHB
In 2018, the HFCs faced several storms due to the chronological failure of several leading housing companies in India. The immediate collapse of one after another put numerous questions upon their efficiency, as other players in the market also faced the hit because of the crisis. The collapse of the leading infrastructure finance company Infrastructure and Leasing Financial Services Ltd. (IL&FS) posed a systemic risk to the market as it dealt with many leading infra projects in the country with the help of 350+ subsidiaries. In continuation, two leading housing finance companies, DHFL and Reliance Capital, failed because of liquidity issues and mismanagement in the company’s corporate governance. Followed by the chaos in the market, in 2021, a Kolkata-based age-old equipment finance company, Srei Infrastructure Ltd., went to a company law tribunal for liquidation. Moreover, the housing finance sector in India is characterized by a dynamic environment where companies frequently undergo mergers or acquisitions. This industry-wide phenomenon results from strategic decisions, regulatory changes, and economic factors (Bhanot et al., Citation2020). The housing industry has come under scrutiny in the wake of recent crises and the failures of prominent housing companies. This has prompted regulators and academics to focus on assessing the sector’s efficiency. The current study seeks to contribute to this discourse by providing empirical evidence, with a specific emphasis on Housing Finance Companies (HFCs) due to their pivotal role in shaping the housing market and its implications for effective regulatory strategies.
3. Literature review
3.1. Efficiency measurement approaches across the globe
Efficiency measurement in the context of global financial institutions has been a subject of study for many years. Researchers have employed various techniques to assess the efficiency of these institutions, each with its own evolution and limitations. Originally, ratio analysis was the go-to method for evaluating short-term operating performance. However, as time went on, the flaws in ratio analysis became evident, leading to misleading and incomplete results (Chen & Ray, Citation2010; Quaranta et al., Citation2018). In response to the limitations of ratio analysis, two prominent techniques gained prominence in academia: the stochastic frontier approach (SFA) and data envelopment analysis (DEA). SFA, while powerful, is less prevalent in the literature due to its complexity, involving parametric methods and linear programming techniques to address efficiency issues. Conversely, DEA became popular due to its versatility in incorporating multiple inputs and outputs into the model, making it the most frequently used technique in efficiency studies across various disciplines.
One of the foundational models in DEA, known as the CCR model, was initially developed by Charnes et al. in 1978 and subsequently refined by Banker et al. in (Banker et al., Citation1984). This model introduced the concept of “decision-making units” (DMUs) and found significant application in studies related to the banking sector (Liu et al., Citation2013). Over time, researchers have introduced a plethora of advanced techniques, including Bootstrap DEA, DEA-TOPSIS, modified Bootstrap DEA, super-efficiency DEA, Malmquist Productivity Index, Double Bootstrap Truncated, Dynamic Network DEA, Meta Frontier DEA, Integrated DEA-TOPSIS, Two-stage network DEA, and Dynamic Slack-based DEA, among others. These techniques have been employed to assess the efficiencies of financial entities on a global scale. However, these methods come with several issues, and one of the most significant limitations that researchers are increasingly recognizing is the problem of endogeneity (Orme & Smith, Citation1996). It’s essential to highlight that, despite researchers being aware of the potential endogeneity issue in DEA studies; they have not yet reached a consensus on a definitive solution. Despite various efforts to address endogeneity concerns in the banking industry (Antunes et al., Citation2022; Subhash & Chen, Citation2010; Tan et al., Citation2021; Xiaogang et al., Citation2005), particularly in the context of second-stage regression analysis, a comprehensive resolution remains elusive. Mayston (Citation2017) attempted to develop a DEA model to address this issue, but as of now, no study has undertaken an in-depth examination of endogeneity within the production process.
Consequently, researchers often continue to rely on traditional DEA approaches, recognizing the potential problem of endogeneity but lacking a universally accepted solution. This highlights the ongoing challenge of addressing endogeneity in efficiency analysis within the financial sector.
3.2. Efficiency studies on finance across the globe
Several researchers have studied the DEA application in various sectors across the globe. As our study is limited to the NBFCs, we have listed the seminal studies in banking and finance, as NBFCs are similar to the banking model in terms of operations and other service-provided criteria. When it comes to banking sector studies with the help of DEA, it is primarily researched due to the availability of the data and the feasible fitness of the input-output model. There are seminal studies conducted (Das & Ghosh, Citation2006; Jagwani, Citation2012; Raina & Kumar Sharma, Citation2013; Saha & Ravisankar, Citation2000; Sanjeev, Citation2006, Citation2009; Singh et al., Citation2020; Tandon et al., Citation2014) on the efficiency measurement of the group of banks in India (public sector, private sector, foreign banks) by considering the ownership allocation, non-performing assets, firm size, branch allocations and the staff management with the help of DEA. Kumar and Gulati (Citation2008) conducted a study on the application of the DEA on 27 public sector banks of India from the year 2004–05 by way of using a two-stage DEA technique; they divided the efficiency scores into overall technical, pure technical, and scale efficiency. After obtaining the OTE scores in the first stage, they regressed with the environmental variables in the second stage. Kaur and Gupta (Citation2015) used DEA methodology to examine the performance of the Indian banking sector and concluded that the state bank group appears to be the most efficient, followed by private and nationalised banks. The productive efficiency of Indian banks increased during the study period, but the increase was not consistent in the subsequent years. They have concluded that bank efficiency did not project any benefits to the economies of scale and independent of the bank’s size.
Gulati and Kumar (Citation2017) used two-stage DEA techniques followed by a bootstrapped truncated regression algorithm to control the exogenous variables to measure the intermediate and operating efficiencies of public and private sector banks. They found that public sector banks struggled to generate income, entailing an overhaul of their traditional and non-traditional activities to generate more income. Their regression results project that the bank size and liquidity position affect intermediation efficiency, profitability, and income diversification. Another group of studies was conducted on the efficiency based on the purely technical, overall technical, and scale efficiency of the group of banks in India. Mainly, managerial efficiency and bank income measures have been studied through the DEA application (Goyal et al., Citation2018; Kumar et al., Citation2016; Mehta et al., Citation2019; Sathye, Citation2003) and are also quite popular in the banking space. As time moved on, some studies became visible (Hafsal et al., Citation2020; Kumar & Kar, Citation2022; Patra et al., Citation2023; Puri & Yadav, Citation2013) considering the interest and non-interest income, profit factor and risk capacities of the banks into account became wide popular as the other techniques of the DEA such as two-stage data envelopment analysis, dynamic slack-based DEA, DEA-TOPSIS etc.Footnote2
There are studies available in the global banking arena with the application of the DEA. The research started primarily after the global financial crisis era to measure the efficiency of global banks. The regulatory environment changes and optimising cost efficiency (Avkiran, Citation2006; Dar et al., Citation2021; Defung et al., Citation2016; Dong et al., Citation2014; Drake & Hall, Citation2003; Fernandes et al., Citation2018; Holod & Lewis, Citation2011; Jaffry et al., Citation2013; Li, Citation2020; Liu et al., Citation2013; Pasiouras, Citation2008; Stewart et al., Citation2016; Sufian, Citation2006; Sufian, Citation2008, Citation2011; Sufian & Habibullah, Citation2009; Sufian & Majid, Citation2007; Yu et al., Citation2019) experimented the application of the DEA on their respective countries. This implies the wide acceptability of efficiency studies in the banking domain in the respective countries.Footnote3
Following the banking studies with the application of DEA in domestic and global, there are studies available in insurance and stock markets. According to Ilyas and Rajasekaran (Citation2019), the Indian non-lifeFootnote4 insurance sector is moderately technical, with room for further development. As a result, all insurers, regardless of size or ownership type, are experiencing increasing returns to scale. Efficiency has a statistically significant negative relationship with size and reinsurance. Sinha (Citation2015) has examined insurance companies’ efficiency with bootstrap DEA’s help and suggested that they are highly efficient in performing in the market. In their study, Mandal and Dastidar (Citation2014) showed that the global slowdown has severely affected the private sector companies, whereas the public sector companies are impacted relatively less in performance levels. Ghosh and Dey (Citation2018) and Jothimani et al. (Citation2017), with the help of a super-efficiency model, have measured the performance of the general insurance companies. Hence, this justifies the vast presence of DEA applications in India’s banking and allied areas and globally.Footnote5
3.3. Efficiency studies on NBFCs in India
Few seminal studies have been conducted on the DEA application of NBFCs in India. Several researchers have conducted a handful of studies on various categories of NBFCs, such as; microfinance institutions (NBFC-MFI), on various dimensions to capture the performances and efficiencies in India. Whereas, studies on deposit-taking NBFCs, housing finance companies, asset reconstruction companies, and infrastructure companies’ efficiency measurement have never been examined empirically in the Indian context, as evident from the past studies vis-à-vis commercial banks in India.
Dutta et al. (Citation2020) used a two-stage data envelopment analysis to examine the performance of non-banking finance companies using the efficiency model. According to the findings from the research, managers should not solely rely on ROE as an indicator of efficiency but should also consider ROA and income diversity. Bhattacharjee and Pati (Citation2021) examined the non-deposit-taking NBFCs and concluded that inefficient firms required to improve their economies of scale by way of achieving managerial efficiency, as well as the small shadow banks should scale up their business operations by way of improving the asset quality to achieve the efficient frontier.
There are pretty reasonable studies on the several applications of DEA on the efficiency measurements of the microfinance institutions evidenced in the Indian context, as MFIs are regulated under the umbrella of the NBFCs in India. Many researchers have tried to examine several nuances of performance measurement and their better improvement for the financial landscape. DEA application on microfinance has comprehensive visibility, followed by commercial banks. Studies conducted by Chanu and Das (Citation2014); Haq et al. (Citation2010); Khan et al. (Citation2021); Khan and Gulati (Citation2019); Sinha and Pandey (Citation2019); Kar and Deb (Citation2017); Kaur and Puri (Citation2023); Kumar and Sensarma (Citation2017); Babu-Muneer and Kulshreshtha (Citation2017); Deb and Sinha (Citation2021); Pal, (Citation2010) are considered to be the seminal work in the area of microfinance with the application of the DEA. They have identified the various levels of efficiency measures such as; technical, pure, and scale efficiency. Apart from the above studies, no studies have been conducted on the efficiency evaluation of the other categories of NBFCs in India.
3.4. Objectives of the study
The objectives of this study are two-fold. Firstly, we aim to investigate the efficiency of Non-Banking Finance Companies (NBFCs) in the Indian context, specifically focusing on Housing Finance Companies (HFCs). The growing importance of NBFCs in the economy, combined with the existing gaps in the literature, necessitates conducting this research study. The first stage of this study aims to use the Data Envelopment Analysis (DEA) Model to calculate the efficiency scores for Housing Finance Companies in the NBFC Sector in India. However, it would not explicitly consider the impact of various factors on the efficiency of these NBFCs. Hence, to gain a broader understanding, we aim to uncover the factors that explain the efficiency of the HFCs in the NBFC sector using Tobit Regression Analysis in Stage II.
4. Rationale for considering DEA on HFC
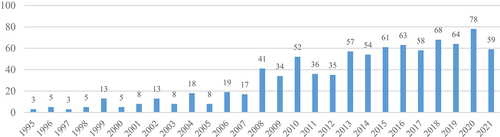
It has been experienced the past literature, Data Envelopment Analysis (DEA) had a broad presence in the operation research kinds of literature in the ’90s, especially to measure the performance of the service sectors such as; hotels, airlines, oil and gas, software, manufacturing, and automobiles etc. As time passed, many finance and economic scholars have started integrating the application of DEA in financial sectors to gauge several efficiency measures to project future business models and provide standalone business solutions to managers. Coming to the studies on management and finance, it has been apparent that the application of DEA has having wide presence in banking, microfinance, insurance, stock market, mutual funds etc. It has been observed that, from 2008 onwards, the DEA-applied research has grown significantly across the globe, especially in finance and management-related areas (Figure ), whereas the application of DEA on NBFCs is scarce in the past literature. We have tried to scientifically scan the published papers from the Scopus database from 1995–2021 to figure out the trend of publications by filtering the banking and allied areas to identify the prominence of DEA-applied research across the years. Figure clearly shows the comprehensive visibility of the published work since 1995, which indicates the wide acceptance of the DEA in banking.
Figure 1. No. Of papers published on DEA from 1995 to 2021.
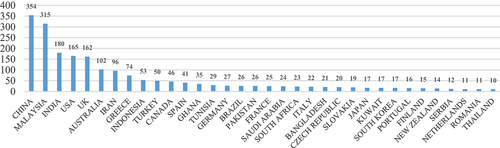
To further narrow down this DEA applicability on the country-specific research, Figure indicates that India is dominating in publications to many leading countries. Whereas all the studies related to the banking sector applications, none in non-banking finance companies in other economies. Figure indicates that India’s position on DEA-applied research stood third, followed by China and Malaysia, whereas the developed economies such as the USA, UK and Australia still target the number of DEA-adopted research. Considering the vast presence of phenomenal publication growth across years and the country-specific outcome, the present study tempted us to examine the efficiency measurement of the HFCs in India by adopting DEA methodologies.
Figure 2. Country-wise publication of research papers on DEA.
The study’s outcome indicates that the application of DEA still has many unserved areas, such as NBFCs. Hence, this study is unique and tries to provide a new arena in the research field by examining the efficiency measurement of housing finance companies in India.
5. Methodology used in the study
5.1. Data source
The empirical study delves into the efficiency assessment of Indian housing finance companies over nine years, spanning from 2013 to 2021, on an annual basis. Among the pool of 60 registered housing finance companies in India, 26 were ultimately chosen for analysis. The selection of this subset was influenced by several factors. Notably, a substantial portion of these companies had either undergone mergers with other entities or exhibited significant gaps in their financial data, rendering them unsuitable for inclusion (see Table ). It is important to highlight that the current study is set out within the dynamic landscape of the Indian housing finance sector, where corporate mergers and acquisitions are commonplace. These industry-wide occurrences are typically shaped by strategic decisions, regulatory adjustments, and broader economic influences. Importantly, researchers do not wield influence over these corporate actions, which can directly impact a company’s continuity or existence. Consequently, the exclusion of firms involved in mergers or acquisitions reflects the genuine dynamics of the sector rather than a selective process that favours specific entities.
Furthermore, this study relies on a dataset derived from disclosed financial information, and the absence of complete financial data is beyond the control of the researchers. Such gaps in financial data pose a common challenge in empirical research, especially within sectors marked by limited transparency. Therefore, the decision to exclude companies with incomplete financial data was guided by practical considerations and empirical necessity, rather than any influence from survivorship bias.
Even after applying these exclusion criteria based on mergers and incomplete data, the resulting sample of 26 housing finance companies remains sufficiently diverse and representative of the industry. This sample encompasses a broad spectrum of companies, varying in size and operational characteristics. The diversity within the sample reinforces the argument that the limited number of exclusions does not significantly skew the findings of the study. Importantly, this study maintains consistency in its approach to including or excluding companies.
In essence, the objective of this research is to offer a comprehensive understanding of the housing finance sector’s efficiency, while taking into account the sector’s real-world complexities. This methodological approach aligns with best practices in empirical research and underscores the study’s transparency and credibility. In addition to that, for better classification and ease of evaluation, the companies have been bifurcated as large and small sizes classified by the RBI (Se Table ). The study is entirely based on the secondary data by way of incorporating input and output variables from the Prowess database provided by the Centre for Monitoring Indian Economy (CMIE), an Indian database having a repository of the public as well as private companies. For technically measuring the efficiency of the HFCs, DEAP 2.1 software developed by Coelli (Citation1996) is employed as it is widely popular among the academia for efficiency measurement compared to other publicly available software.
Table 2. List of Housing Finance companies considered for the study
5.2. Empirical framework
Efficiency can be measured in a variety of ways. It is assessed using both parametric and non-parametric methods. On the other hand, parametric approaches are complex, and the outcome depends on the functional set created. The non-parametric technique, i.e., the DEA method, is less restricted and easier to implement, and it allows for multiple diagnostics for efficiency reasons. As a result, in our work, we use the DEA model to assess the efficiency scores of Decision-Making Units (DMU) using a linear programming approach. The best-practicing firm has a DMU on the frontier and an efficiency score of 1. The returns to scale in DEA models are either constant or variable. Charnes et al. (Citation1978) initially developed the concept based on a constant return to scale when all DMUs function optimally.
In some cases, the Charnes, Cooper, and Rhodes (CCR) model will not be appropriate for financial institutions, as is evident. This is alternatively known as the input-oriented model as it predominately uses the input for the decision-making process, which creates biases in the analysis as the output variables are entirely outside the decision-makers’ purview. To overcome the issue, Banker et al. (Citation1984) extended the CCR model to include the Variable Return to Scale (VRS) “Banker, Charnes and Cooper [BCC] model.” This approach divides technical efficiency further into pure technical efficiency (PTE) and scale efficiency (SE) (Goyal et al., Citation2019). The CCR and BCC models can be used to estimate the input- or output-oriented model. DEA investigates the minimisation of inputs while keeping the output constant in the input-oriented paradigm. The output-oriented DEA, on the other hand, considers DMU with output maximisation to be efficient DMU (Holod & Lewis, Citation2011). To calculate efficiency using the intermediation approach, we used an output-oriented VRS model with the accurate input level used by DMUs to generate the required output. The following VRS model could be written as follows;
In the derivation mentioned above:
Where refers to the jth DMU
refers to the value of the input variable of the jth DMU
N refers to the no. of DMU
refers to the efficiency of the nth DMU
Hence the above study follows the intermediation approach, as the HFCs are involved as a catalyst for the financial development of the economy. The study has considered capital, interest expenses, total assets, and operating expenses as input variables and interest income, loans and advances, and operating profit as an output variable to capture the efficiency of the HFCs at the given capacity and to comply with the above requirements (Table ).
Table 3. Input and output variables considered for the study
An addition to the efficiency measurement of the HFCs with the help of input and output variables, the study also attempts to measure the change in the productivity of the Indian housing finance companies with the help of the Malmquist Index (MI) over the two-time periods. Malmquist Index has gained popularity over decades in academia because of several prime reasons. To begin, the MI does not require profit maximisation or cost minimisation assumptions to calculate the efficiency of the concerned entity. Second, it does not require input and output price information, and finally, if the researcher has panel data, the Malmquist Index calculates total factor productivity change and further decomposes productivity change into technical change (TECHCH) and technical efficiency change (TEFFCH). The technical change is also known as a frontier shift because it captures the shift in the frontier from time t to time t + 1., whereas the efficiency change captures the changes for each observation between t to t + 1. Fare and Grosskopf (Citation1996) define the output-oriented Malmquist index used in this study. This model’s popularity stems from its emphasis on the equal-proportionate increase of outputs within the context of a given input level. The output-base Malmquist index may be formulated as follows;
In the above equation where M refers to the productivity of the most recent production unit, i.e., ( +1,
+1) relative to the earlier production (
) and D refers to the distance function—the productivity between two periods measured through unity. The equivalent way of writing this index is as follows.
The technological change is presented as follows:
indicates the progress in the total factor productivity of the DMU from the period t to t + 1 and the change in efficiency in the same period.
Further, we have examined the efficiency between the bank-specific variables with the help of DEA. We have used the Tobit regression for further analysis to examine the same.
6. Empirical analysis and results
6.1. Stage-I: traditional DEA approach
Traditional DEA models help review housing finance companies in India because they can be used to assess the relative efficiency of these companies. DEA models are non-parametric, meaning they do not make any assumptions about the underlying distribution of the data. This makes them well-suited for use with data from housing finance companies, which can be heterogeneous and often have outliers.
DEA models can be used to assess the efficiency of housing finance companies in several ways. For example, DEA models can be used to compare the efficiency of different housing finance companies or to track the efficiency of any specific housing finance company over time. DEA models can also identify areas where a housing finance company can improve efficiency.
Traditional DEA models such as BCC and CCR have been used to investigate the efficiencies of HFCs. We used an output-oriented model to examine the DMUs’ efficiency scores and returns to scale. Overall technical efficiencies (OTE), pure technical efficiencies (PTE), and scale efficiencies, as well as the feature of Returns to Scale, were used for detailed examination of the DMUs (Abdulahi et al., Citation2023; Ashiagbor et al., Citation2023; Chowdhury et al., Citation2023; Patra et al., Citation2023; Shieh et al., Citation2022). Tables show the overall relative efficiency scores of large and small firms with the above-mentioned characteristics.
Table 4. Overall relative efficiency scores of the HFCs (large size firms)
Table shows that 4 out of 18 DMUs are efficient with a score of 1 and lie on the efficient frontier. These DMUs are IIFL Home Finance Ltd, Edelweiss Housing Finance Ltd, Poonawalla Housing Finance Ltd and Cent Bank Home Finance Ltd. These DMUs have a mean efficiency score of 0.448, which indicates that the HFCs in India have 55.2% efficiency overall. 14 DMUs are comparatively less efficient than the counterpart HFCs in India, as most of their OTE scores are not either close to the efficiency frontier or moving towards achieving the efficiency frontier. Whereas in the case of Pure Technical Efficiency, all 18 DMUs have an efficiency score of 1, which indicates that these DMUs have effectively managed to optimise their resources to achieve the efficiency frontier. In addition to that, the Scale Efficiency, which is the ratio of OTE and PTE, resulted in 14 DMUs not performing on the correct scale of operation, so we can conclude that the majority of the HFCs are inefficient when it comes to the large size firm in India.
In contrast, the scenario changed when it demonstrated the results of the small-size firms (Table ). Six of eight small-size firms have efficiency scores of 1, except L&T Housing Finance Ltd and Aptus Value Housing Finance India Ltd. The remaining small-size HFCs include Shriram Housing Finance Ltd, Vastu Housing Finance Corp. Ltd, India Shelter Finance Corp. Ltd, Shubham Housing Development Finance Co. Ltd, Muthoot Housing Finance Co. Ltd and Svatantra Micro Housing Finance Corporation Limited, have all performed well overall to achieve efficiency. Thus, small-size HFCs are performing comparatively better in OTE than large firms. In the case of scale efficiency, the mean score of the small-size firms is 0.873, which indicates the optimum utilisation of the DMUs to perform the optimal scale of operation.
Table 5. Overall relative efficiency scores of the HFCs (small size firm)
The summarised statistics of efficiency scores are presented in Table . In the case of large-size firms, 4 DMUs are highly efficient in the OTE model, whereas, in the PTE model, 18 DMUs are efficient. That signifies the large-size firm in the PTE model properly utilised the resources to achieve efficiency. In the case of small-size firms, both OTE and PTE models performed efficiently as 6 and 8 firms achieved the optimum efficiency to reach the frontier.
Table 6. Summarised statistics of efficiency scores
Because the change in efficiency and any significant deviation in the performances of housing finance companies may not be easily observed individually, the Malmquist Productivity Index (MI) is used to identify the overall productivity change and further decomposition to various efficiency change measurements. Table shows that all large-size firms have been analysed separately for a better understanding and visibility of the performances of the HFCs. Similarly, Table presents the overall MI summary of the small-size HFCs for further examination.
Table 7. Malmquist index summary of HFCs (large size firm)
Table 8. Malmquist index summary of HFCs (small size firm)
In Table , productivity change is denoted as (tfpch)displays results such that only 2 out of the 18 firms have a productivity score greater than 1, whereas the remaining 16 firms operate with a productivity score less than 1. Similarly, in the case of technological change (techch), only 1 out of 18 firms are above the productivity score of 1. However, we have witnessed an upsurge in the case of efficiency change (effch), where eight firms perform above the productivity score of 1, while the remaining ten firms are under the score of 1.
Further, we have analysed the decomposition of the effch into pure efficiency change (pech) and scale efficiency change (sech) to analyse their aggregate performance in detail. When it comes to pech, it is observed that all 18 firms are performing strictly at the efficiency level, that is, 1. The results of the sech changed completely and observed that only eight firms have a productivity level of either one or more than 1.
Table provides a detailed analysis of the changes in productivity over time, followed by Table for the large and small-size HFCs, respectively. The analysis revealed that the total factor productivity (tfpch) has increased by 12.3%. The annual change of tfpch was highest in 2020–21, whereas it was comparatively lesser in the remaining years except in 2021. When it comes to the effch of the large-size HFCs, the mean was 0.990, which indicates that all the firms are functioning at a high-efficiency level. When we analysed the effch of the small-size firms, the situation changed, showing a mean of 0.949, which is comparatively less than that of large firms. Thus, it concludes that, in the case of effch, the large-size HFCs perform comparatively better than the small-size firms in the given capacity. When it comes to the tfpch, the scenario got changed. The small-size HFCs productivity change over the years is 34.9 %, higher than the productivity change shown by large-size firms.
Table 9. Malmquist index summary of annual means (large size firm)
Table 10. Malmquist index summary of annual means (small size firm)
6.2. Stage II: Tobit regression approach
In the next step of our empirical analysis, we employed the Tobit regression model to investigate the relationship between “bank-specific” variables and their efficiency. This choice was informed by a critique of the traditional DEA approach, which faces challenges in drawing statistical inferences. Fare and Grosskopf (Citation1996) proposed a two-stage analytical approach to address this issue. In the first stage, DEA is used to calculate efficiency scores, while in the second stage; regression analysis is applied to explain these efficiency scores.
However, a notable concern arises from the fact that efficiency scores are censored. To accommodate this aspect, we opted for the Tobit regression model, which can handle truncated data and work with both continuous and categorical variables (Dutta et al., Citation2020; Singh et al., Citation2020; Tandon et al., Citation2014). The choice of the Tobit model is particularly relevant as it accounts for the distribution characteristics of efficiency measures and, in turn, offers valuable insights for policy formulation.
Given that inefficiency scores fall within the range of 0 to 1, a Tobit model with two-sided censoring represents a suitable theoretical specification (Das & Ghosh, Citation2006). Housing finance companies in India exhibit diverse lending practices, leading to variations in operational efficiency. Without addressing endogeneity, these disparities could introduce bias in efficiency scores, underscoring the necessity of employing Tobit regression.
Moreover, the Indian real estate market is subject to economic fluctuations and regulatory changes, which need to be considered when assessing efficiency. Ignoring these external factors could result in endogeneity issues, further justifying the use of Tobit regression to account for their impact. Additionally, data on housing finance companies may be incomplete or contain gaps due to reporting inconsistencies or lack of transparency. The incompleteness of this data can introduce endogeneity, making Tobit regression an effective tool for handling censored and incomplete data.
In the housing finance sector, risk assessment often involves complex, unobservable factors that can influence efficiency. The presence of these factors can give rise to endogeneity concerns, which Tobit regression is well-equipped to address through the incorporation of additional controls. Furthermore, given the dynamic nature of the Indian real estate market and the adaptive strategies of companies in response to changing conditions, failing to account for these evolving market conditions could lead to biased DEA results. Lastly, the absence of a universally robust methodology for addressing endogeneity in the context of DEA has led researchers to turn to Tobit regression, a well-established econometric technique, as a pragmatic solution given the complexities of the dataset.
Since efficiency scores measured by DEA are censored and constrained within the range of 0 to 1, Tobit regression becomes a necessary method to obtain unbiased results (Eyceyurt et al., Citation2017; Sufian & Habibullah, Citation2009). This study employed the Tobit regression method to address this challenge effectively. The fundamental model is as follows.
Where = 0 otherwise,
which presents the set of parameters to be estimated,
and
depicts the observed DEA efficiency scores and
and
are the set of explanatory variables and their coefficients.
In the current study, we have considered the DEA-obtained efficiency scores as dependent variables and several peculiar bank-specific variables as independent variables. As most of the existing studies have considered commercial banks factors in their empirical model, hence, by keeping on view as a base with the earlier studies, we have constructed the basic regression model as follows:
In the above regression model coefficients of the independent variables presented by (Table ) and
are the error terms mentioned in the model to capture the disturbance in the model. A detailed description of the variables and their notations used in the study are mentioned in Table .
Table 11. Definitions, measurements and notations of the variables
The descriptive statistics of the small and large firms have been depicted in Tables . In the current study, to describe the firm’s characteristics regression model is used. The study has undertaken the efficiency scores obtained from the DEA analysis with the help of the BCC model and then correlated with the firm-specific variables to define the status of the concerned firms. (Tables ).
Table 14. Descriptive statistics of variables (large size firm)
Table 15. Tobit regression model (large size firm)
Table 12. Descriptive statistics of variables (small size firm)
Our study initially aligned with previous literature, suggesting a positive relationship between firm size and efficiency observed in larger and smaller firms. To investigate this further, we conducted regression analysis on small-size firms, utilising several firm-specific variables considered in the study (as shown in Table ). Surprisingly, our results contradicted the earlier findings, revealing that while size positively influences efficiency for larger firms, it exhibits a damaging relationship for small firms. The unexpected negative relationship between firm size and efficiency for small firms could be attributed to various factors. Smaller firms may face challenges with economies of scale, limited resources, and adaptability to market changes. Their specialisation in niche markets may limit growth opportunities, and they might be more exposed to risks than larger, diversified firms. Moreover, smaller firms may lack bargaining power, and managerial capabilities could influence their efficiency. Compliance costs may also impact their performance.
Table 13. Tobit regression model (small size firm)
The CRISK, considered a peculiar factor for the performance of the firms, resulted as significant but negatively related to firm efficiency. This signifies that increased credit risk reduced the firm efficiency and vice-versa. The findings highlight the increased costs and challenges associated with the firm’s higher credit risk, such as provisions for potential loan defaults, additional risk management measures, and intensified monitoring efforts. As credit risk rises, the firm may allocate more resources to tackle these risks, potentially diverting attention and funds away from core business operations, thus impacting overall efficiency.
Another key indicator, Operating Expenses (OPEX), is also found to have a significant and negative relationship with efficiency. This suggests that as operating expenses increase, firm efficiency tends to decrease. The rationale behind this is that higher operating expenses could signal inefficiencies in the firm’s cost structure, resource allocation, or operational processes. It may indicate suboptimal utilisation of resources, inefficient production methods, or increased overhead costs. As a result, the firm’s overall performance and profitability might suffer, making it essential for management to manage and streamline operating expenses to enhance overall efficiency carefully.
NIM and ROA, considered an indicator of measuring managerial efficiency, are negatively related to the efficiency of the firms. The results contradict the previous studies (Sufian, Citation2008; Sufian & Habibullah Citation2009), where as the results supported the studies conducted (Bhattacharjee & Pati, Citation2021). Usually, a significant and positive relationship between ROA and NIM in this model better suggests an efficiency mechanism for small firms. A higher ratio predicts better performance, which is in evidence in the current study. CUR and LIR measure liquidity and determine the firm’s ability to meet short-term obligations, negatively influencing the efficiency of small-size firms. It can be concluded that liquidity mismanagement affects the firm efficiency on a large scale. CRAR, the indicator of the firm’s stability to mitigate the shock, negatively impacted the efficiency, which is expected to be positive for better financial strengthening.
The scenario changed when it came to large-size firms. Size positively influences efficiency, which was reversed in the case of small firms. It indicates that large-size firms will perform efficiently with the increase in total asset size. CRISK, the indicator of risk efficiency, negatively influences the firm efficiency, which means more credit disbursed drives the firm efficiency downward. Hence, HFCs should avoid prudent credit sanctioning. OPEX indicates that the firms’ operating efficiency is negatively influenced by their overall efficiency, but it is becoming significant.
The negative relationship between ROA and efficiency scores suggests that firms with higher profitability, as measured by ROA, may not necessarily exhibit superior overall efficiency. This finding contradicts the conventional belief that higher profitability always indicates better efficiency. It may indicate that firms prioritising short-term profits through various means, such as cost-cutting measures or taking on riskier assets, might compromise their long-term operational efficiency and sustainability.
Similarly, the negative relationship between NIM and efficiency implies that firms with higher net interest margins, potentially generated from charging higher interest rates on loans, may face reduced overall efficiency. This result could be attributed to the possibility that focusing primarily on maximising interest income might lead to neglecting operational efficiency and risk management, ultimately affecting the firm’s overall performance.
These counterintuitive findings warrant further investigation into the underlying factors contributing to the observed negative relationships. Potential reasons could include the firm’s risk appetite, resource allocation strategies, managerial decisions, or market conditions. Understanding these dynamics can help firms balance profitability and efficiency better, optimising their performance in both aspects.
Additionally, CUR and LIR considered an indicator of liquidity management are negatively related to firm efficiency. In a nutshell, it can be summarised that, among the small and large size firms, size significantly influences the overall firm efficiency, followed by OPEX and CUR in the case of small-size firms, whereas, in the case of large-size firms, OPEX is highly influenced by the firm efficiency (See Table ).
6.3. Some caveats to the DEA approach used in this study
While we track the efficiencies of the Housing Finance sector using Data Envelopment Analysis, it is critical to understand the overall economic conditions prevalent at the time, which would help us, understand the situation better. These macroeconomic events need a special mention in our study, as the nature of these occurrences is rare, non-cyclical, and all-impacting, combined with the global domino-effect impact they generated. It thus becomes imperative to understand their presence so that the implications of our study can be better grasped, comprehended and implemented. Some notable macroeconomic events that coincided with the period of our study (2013–2021) include:
(i) An increase in the severity of the Non-Performing Assets (NPAs) crisis in India directly affects the efficacy and lending capacities of Indian banks, thereby negatively impacting their credit positions in all other lending sectors.
(ii) The aftermath of the Sub—prime and Eurozone-sovereign crisis.
(iii) An increase in global geopolitical uncertainty.
(iv) The onset of the COVID–19 pandemic and subsequent recovery following the immunisation campaigns.
Through several channels, these events affect the sets of input and output variables of financial institutions considered by this study. The paragraphs below add more insights and detail to the specific situations caused in the economy due to these macroeconomic events that coincided with our study period.
6.3.1. NPA crisis in Indian banks
At the beginning of this period (2013), India was still experiencing relatively high economic growth, which led to increased lending by banks to various sectors (Mohanty et al., Citation2022). However, from 2013 to 2021, the Indian banking sector experienced a significant rise in non-performing assets (NPAs), also known as bad loans, which profoundly impacted the overall health of the sector and the Indian economy. The NPA situation during this period was a cause for concern for several banks and posed several challenges to the stability and efficiency of the entire banking system and cast aspersions on the Indian Economy as a whole. However, as economic growth slowed and various industries faced headwinds, borrowers struggled to repay their loans, resulting in a deterioration of asset quality in banks’ loan portfolios (Mohanty et al., Citation2022; Silva, Citation2021).
The NPA problem was more pronounced, particularly in public sector banks (PSBs) that accounted for a significant share of the Indian banking system. PSBs faced challenges in managing NPAs due to political interference, outdated lending practices, and inefficiencies (Patra et al., Citation2023). Large infrastructure projects, especially in sectors like power, steel, and construction, faced delays and cost overruns, leading to increased NPAs for banks. The stressed assets in the corporate sector further aggravated the NPA issue (Bhagwati et al., Citation2017; Gaur & Mohapatra, Citation2021; Kandi et al., Citation2022).
In 2015, the Reserve Bank of India (RBI) conducted an Asset Quality Review, identifying significant previously unrecognised bad loans, further impacting the banking sector’s health. As the NPA problem escalated, the Indian government implemented recapitalisation measures to infuse capital into PSBs and strengthen their balance sheets. In 2016, the Indian government introduced the Insolvency and Bankruptcy Code to provide a time-bound resolution framework for distressed companies, expediting the resolution process and helping banks recover their dues faster. Banks faced challenges in recovering the NPAs, especially from more significant defaulters, due to legal and procedural bottlenecks. The RBI introduced various measures to address the NPA problem, including stricter norms for loan classification, stressed asset resolution frameworks, and revised provisioning norms. The NPA situation constrained banks’ lending ability, as they became more risk-averse than earlier, and led to a slowdown in credit growth, affecting investment and economic expansion (Dar et al., Citation2021).
Overall, the NPA situation in the Indian banking sector from 2013 to 2021 was a significant concern that required concerted efforts from not only the government and regulatory bodies; but also from Banks themselves to arrive at a time-bound and effective resolution (Mohapatra et al., Citation2023; Satya Krishna Sharma et al., Citation2022). While various steps were taken to tackle the issue, it remained a complex and persistent challenge for the banking sector, impacting credit availability, investor confidence, and economic growth.
6.3.2. Spillovers from international monetary policy
In response to the subprime and COVID–19 crises, several central banks of developed nations began engaging in a series of quantitative easing. As a result, these policies have significant spillovers to emerging markets such as India (Cortes et al., Citation2022). They distort equilibrium capital flows and exchange rates (Dedola et al., Citation2021). They also generate bubbles in emerging real estate markets. In this context, Jarrow and Silva (Citation2015)observed that traditional risk management practices are ineffective in detecting asset-price bubbles. These forces affect every balance sheet and income statement variable of Indian financial institutions.
6.3.3. Domestic monetary policy
It is important to note that the sample period also comprises the important Indian demonetisation episode in 2016 (Chodorow-Reich et al., Citation2020). This experiment affects every balance sheet and income statement variable of Indian financial institutions.
6.3.4. Fiscal policy and implicit government guarantees
In the aftermath of the global financial crisis and response to the COVID–19 pandemic, governments of several countries (including India) enacted fiscal stimulus measures (Benmelech & Tzur-Ilan, Citation2020). These policies widen government deficits, affecting financial institutions’ credit risk (Silva, Citation2021). Financial institutions’ interest income, interest expense, and loan origination are affected when credit risk changes. Higher government deficits also affect the strength of government guarantees, which in turn affect the income of financial institutions (Dantas et al., Citation2023), as well as the value of their equity (Gandhi et al., Citation2020), and other securities (Kelly et al., Citation2016).
6.3.5. Geopolitical uncertainty
The sample period is also characterised by elevated geopolitical uncertainty. In particular, the Brexit referendum is shown to have essential spillovers to firms’ investments in markets outside the UK (Campello et al., Citation2022). Given the strong ties between the UK and Indian economies, it is crucial to understand that the uncertainty caused by Brexit may have affected the value of real estate assets in India (Campello et al., Citation2022; Doyle et al., Citation2016), which in turn may affect the balance sheets of housing financing companies.
7. Conclusion
The efficiency evaluation of the large and small-size HFCs has been analysed with the help of DEA and the Malmquist index. It has been observed that, in the case of large-size firms, only 4 out of 18 firms lie in the efficient frontier, whereas the scenario changed in the small-size firms, with six out of eight firms qualifying to touch the efficient frontier. It has been summarised that most of the HFCs are inefficient for large-sized firms in India. In addition, with the help of the Malmquist Index, it has been observed that, in the case of the productivity change, out of 18, only two firms obtained a productivity score of 1, while the remaining 16 are underperforming. Overall, the total factor productivity change was highest in the year 2020–21 and comparatively decreased in the subsequent year due to the sector crisis witnessed in the Indian economy.
In large firms, the size predominately influences efficiency and is highly significant, which was insignificant in small firms. Hence, it signals to the market that small firms must maximise their efficiency by maintaining their size. Regarding risk efficiency, both firms are negatively impacting the firm efficiency, which indicates the operating expenses are to be taken care of to achieve the efficiency level. It also reveals that, in the case of liquidity management, large firms are insignificant to affect the firm efficiency, whereas in the case of small size firms, though it is negatively influencing, it is highly significant. It concludes that small firms are to be cautious in terms of liquidity management as compared to large firms. As the firm performance signifies a predominant role in the evaluation of the firm efficiency, in the current study, both the firms are incapable of achieving the same, as the coefficients are insignificant, hence large as well as small firms must be prudent enough to optimise their performance in the future to retain their market value in the economy. Therefore, it can be summarised that large firms have to internally restructure their coefficients to achieve efficiency, whereas small firms are in their given capacity to maintain efficiency in the provided scenarios.
7.1. Limitations and future scope
The study grapples with certain limitations inherent to the Indian Housing Finance Company (HFC) sector and the broader non-banking financial industry. These limitations are primarily attributed to the sector’s unique characteristics and the evolving regulatory landscape, which can result in a scarcity of comprehensive and granular data. This data scarcity extends to variables that could potentially serve as instrumental variables or effective controls to address endogeneity, further complicating the study’s ability to mitigate this issue. Additionally, due to the nascent stage of these industries, access to historical data series of the same depth and breadth as more mature financial sectors is limited. In many cases, available data primarily centres on financial performance, regulatory compliance, and broad economic indicators, leaving researchers with limited options for constructing instrumental variables or effectively controlling for endogeneity.
In the context of this evolving and data-constrained landscape, compounded by the relatively small number of companies in the NBFC and HFC sectors, the study inherently faces constraints in comprehensively addressing endogeneity issues. Recognizing and acknowledging these data limitations is pivotal for maintaining transparency and understanding the distinct challenges associated with empirical research in the Indian NBFC and HFC sectors. Therefore, these constraints underscore the need for ongoing data collection and analysis to facilitate more profound investigations into these industries.
Moreover, it’s imperative to note that this study is limited to housing finance companies based on the asset size criteria established by the Reserve Bank of India in consultation with the National Housing Bank. The potential for future research in this domain is promising, contingent upon data availability. Subsequent studies could consider extending the analysis to cover additional periods and further diversifying the HFCs by categorizing them into clusters based on ownership (public, private, government-owned) and operational characteristics (deposit-taking and non-deposit-taking). Furthermore, future studies in this area could adopt more advanced methodologies, such as a refined Data Envelopment Analysis (DEA), to enable a more intricate analysis. This, in turn, could provide a more nuanced understanding of the functioning of the often-debated and complex sector in the economy, contributing to the enhancement of the country’s financial system.
Author Bio.docx
Download MS Word (13.7 KB)Acknowledgments
The authors are grateful to the journal’s anonymous referees for their extremely useful comments to improve the article.
Disclosure statement
No potential conflict of interest was reported by the author(s).
Supplemental material
Supplemental data for this article can be accessed online at https://doi.org/10.1080/23322039.2023.2285158
Additional information
Funding
Notes on contributors
Santosh Gopalkrishnan
Santosh Gopalkrishnan is working as an Associate Professor at Symbiosis Institute of Business Management, Pune. He has completed Ph.D. in the area of Banking. He is having 15 years of rich experience in the field of academia and industry. His broad research interest lies in the field of big data analytics and financial economics.
Shiba Prasad Mohanty
Shiba Prasad Mohanty is a Research Scholar at Symbiosis Institute of Business Management, Pune. He is pursuing Ph.D. in the area of Banking and Finance. Inter alia, his interest lies in the field of financial astrology, financial economics, shadow banking and corporate governance.
Megha Jaiwani
Megha Jaiwani is a Junior Research Fellow at Symbiosis Institute of Business Management, Pune. Her current research focuses on financial stability, systemic risk, and the impact of banking regulations on financial intermediation. She is dedicated to continuing her research and is passionate about finding solutions to financial resilience challenges.
Notes
1. As per the report released by the RBI in 17th June 2020,All HFCs, regardless of asset size or ownership, must be treated equally. In other words, non-deposit taking HFCs with assets of 500 crore or more, as well as all deposit taking HFCs, regardless of asset size, will be considered systemically important HFCs. HFCs with assets less than 500 crore will be classified as non-systemically important in India.
2. The transition of HFC supervision from the NHB to the RBI was announced for FY2020; with this change, the RBI now supervises and governs all players in the housing finance sector.
3. The Piramal group acquired DHFL after it declared bankruptcy and was ranked fifth in size. The merger of Dewan Housing Finance Ltd. and Reliance Housing Finance in 2019 proved to be a watershed moment for the entire housing sector. The failure of DHFL was caused by non-payment of its short-term debt. Due to credit pressure, they were forced to sell retail loans worth ₹ 30,000 crores. Reliance Housing, a leading housing finance company, failed to pay the lender of ₹10,123 crores.
4. As of 31st March 2022, 74 HFCs are listed under NHB with an asset size of ₹100 crores and above. The HFCs’ asset size of ₹ 500 crore and all deposit-taking HFCs are considered systemically important.
5. As per the list released by the NHB, 10 HFCs are permitted to accept public deposits,5 HFCs are granted conditional permission to accept public deposits and 80 HFCs are not permitted to collect public deposits by the NHB.NHB rejected the registration certificate of 123 HFCs. There are 42 HFCs whose certificate of registration has been cancelled.
References
- Abdulahi, S. M., Yitayaw, M. K., Feyisa, H. L., & Mamo, W. B. (2023). Factor affecting technical efficiency of the banking sector: Evidence from Ethiopia. Cogent Economics & Finance, 11(1), 2186039. https://doi.org/10.1080/23322039.2023.2186039
- Acharya, V. V., Khandwala, H., & Sabri Öncü, T. (2013). The growth of a shadow banking system in emerging markets: Evidence from India. Journal of International Money & Finance, 39(December 2012), 207–27. https://doi.org/10.1016/j.jimonfin.2013.06.024
- Adrian, T., & Ashcraft, A. B. (2012). Shadow banking regulation. Annu. Rev. Financ. Econ, 4(1), 99–140.
- Ahmad, W., Pathak, B., & Bhanumurthy, N. R. (2019). Understanding systemic symptoms of non-banking financial companies. Economic and Political Weekly, 54(13), 59–67.
- Antunes, J., Hadi-Vencheh, A., Jamshidi, A., Tan, Y., & Wanke, P. (2022). Bank efficiency estimation in China: DEA-RENNA approach. Annals of Operations Research, 315(2), 1373–1398. https://doi.org/10.1007/s10479-021-04111-2
- Ashiagbor, A. A., Dziwornu, R., Gbade, A. V., Offei-Kwafo, K., & Liticia, G. (2023). Measuring efficiency and productivity changes: A non-parametric analysis of Ghanaian life insurance industry. Cogent Economics & Finance, 11(1), 2210855. https://doi.org/10.1080/23322039.2023.2210855
- Avkiran, N. K. (2006). Developing foreign bank efficiency models for DEA grounded in finance theory. Socio-Economic Planning Sciences, 40(4), 275–296. https://doi.org/10.1016/j.seps.2004.10.006
- Babu-Muneer, M., & Kulshreshtha, P. (2017). Efficiency of Indian microfinance institutions. The Indian Economic Journal, 60(4), 81–101. https://doi.org/10.1177/0019466220130405
- Banker, R. D., Charnes, A., & Cooper, W. W. (1984). Some models for estimating technical and scale inefficiencies in data envelopment analysis. Management Science, 30(9), 1078–1092. https://doi.org/10.1287/mnsc.30.9.1078
- Benmelech, E., & Tzur-Ilan, N. (2020). The determinants of Fiscal and monetary policies during the COVID-19 crisis. SSRN Electronic Journal Electronic Journal. https://doi.org/10.2139/ssrn.3634549
- Bhagwati, J., Khan, M. S., & Bogathi, R. R. (2017). Working paper 338, can asset reconstruction companies (ARCs) be part solution to the Indian debt problem? April, 52. https://www.econstor.eu/handle/10419/176365
- Bhanot, D., Khaire, M., Kalro, A., & Jha, S. K. (2020). Affordable housing finance companies in India: How do they ‘differently’ serve the underserved? Housing Studies, 35(3), 537–566. https://doi.org/10.1080/02673037.2019.1614538
- Bhattacharjee, N., & Pati, A. P. (2021). Efficiency of shadow banks in India and its drivers. Global Business Review, 09721509211056473. https://doi.org/10.1177/09721509211056473
- Bhattacharjee, N., & Pati, A. P. (2022). Exploring systemic risk measurement issues in shadow banks: A case of an emerging economy. South Asian Journal of Macroeconomics and Public Finance, 22779787221107716, 227797872211077. https://doi.org/10.1177/22779787221107716
- Campello, M., Cortes, G. S., D’almeida, F., & Kankanhalli, G. (2022). Exporting uncertainty: The impact of Brexit on corporate America. Journal of Financial and Quantitative Analysis, 57(8), 3178–3222. https://doi.org/10.1017/S0022109022000308
- Chandrasekhar, C. P. (2020). Revisiting the NBFC crisis. Economic and Political Weekly, 55(2), 10–11.
- Chanu, A. I., & Das, S. (2014). MFIs of North East India: An efficiency analysis. International Journal of Banking, Risk and Insurance, 2(2), 46.
- Charnes, A., Cooper, W. W., & Rhodes, E. (1978). Measuring the efficiency of decision-making units. European Journal of Operational Research, 2(6), 429–444. https://doi.org/10.1016/0377-2217(79)90229-7
- Chaturvedi, A., & Singh, A. (2022). Examining the interconnectedness and early warning signals of systemic risks of shadow banks: An application to the Indian shadow bank crisis. Kybernetes, 52(10), 3938–3964. https://doi.org/10.1108/K-12-2021-1280
- Chen, L., & Ray, S. C. (2010). Cost efficiency and Scale Economies in General dental practices in the US: A Non-parametric and Parametric Analysis.
- Chodorow-Reich, G., Gopinath, G., Mishra, P., & Narayanan, A. (2020). Cash and the economy: Evidence from India’s demonetization. The Quarterly Journal of Economics, 135(1), 57–103. https://doi.org/10.1093/qje/qjz027
- Chowdhury, M. A. I., Uddin, M. S., Ahmmed, M., Hassan, M. R., & Kabir, M. J. (2023). Potential risks of liquidity and credit affecting the efficiency of Islamic banks in Bangladesh. Cogent Economics & Finance, 11(1), 2209950. https://doi.org/10.1080/23322039.2023.2209950
- Coelli, T. J. (1996). Measurement and sources of technical efficiency in Australian coal-fired electricity generation. Centre for efficiency and productivity analysis (CEPA). ( WP 1/96). Department of Econometrics, University of New England.
- Cortes, G. S., Gao, G. P., Silva, F. B. G., & Song, Z. (2022). Unconventional monetary policy and disaster risk: Evidence from the subprime and COVID–19 crises. Journal of International Money and Finance, 122, 102543. https://doi.org/10.1016/j.jimonfin.2021.102543
- Dantas, M. M., Merkley, K. J., & Silva, F. B. G. (2023). Government guarantees and banks’ income smoothing. Journal of Financial Services Research, 63(2), 123–173. https://doi.org/10.1007/s10693-023-00398-3
- Dar, A. H., Mathur, S. K., & Mishra, S. (2021). The efficiency of Indian banks: A DEA, Malmquist and SFA analysis with bad output. Journal of Quantitative Economics, 19(4), 653–701. https://doi.org/10.1007/s40953-021-00247-x
- Das, A., & Ghosh, S. (2006). Financial deregulation and efficiency: An empirical analysis of Indian banks during the post-reform period. Review of Financial Economics, 15(3), 193–221. https://doi.org/10.1016/j.rfe.2005.06.002
- Deb, J., & Sinha, R. P. (2021). Impact of competition on efficiency of microfinance institutions: Cross country Comparison of India and Bangladesh. International Journal of Rural Management, 18(2), 250–270. https://doi.org/10.1177/09730052211005244
- Dedola, L., Georgiadis, G., Gräb, J., & Mehl, A. (2021). Does a big bazooka matter? Quantitative easing policies and exchange rates. Journal of Monetary Economics, 117, 489–506. https://doi.org/10.1016/j.jmoneco.2020.03.002
- Defung, F., Salim, R., & Bloch, H. (2016). Has regulatory reform had any impact on bank efficiency in Indonesia? A two-stage analysis. Applied Economics, 48(52), 5060–5074. https://doi.org/10.1080/00036846.2016.1170934
- Dong, Y., Hamilton, R., & Tippett, M. (2014). Cost efficiency of the Chinese banking sector: A comparison of stochastic frontier analysis and data envelopment analysis. Economic Modelling, 36, 298–308. https://doi.org/10.1016/j.econmod.2013.09.042
- Doyle, N., Hermans, L., Molitor, P. A. M., & Weistroffer, C. (2016). Shadow banking in the euro area: Risks and vulnerabilities in the investment fund sector. SSRN Electronic Journal, 174. https://doi.org/10.2139/ssrn.2804616
- Drake, L., & Hall, M. J. (2003). Efficiency in Japanese banking: An empirical analysis. Journal of Banking & Finance, 27(5), 891–917. https://doi.org/10.1016/S0378-4266(02)00240-6
- Dutta, P., Jain, A., & Gupta, A. (2020). Performance analysis of non-banking finance companies using two-stage data envelopment analysis. Annals of Operations Research, 295(1), 91–116. https://doi.org/10.1007/s10479-020-03705-6
- Eyceyurt, T., Volkman, D. A., & Gungor, B. (2017). Determinants of bank efficiency in Turkey: Participation banks versus conventional banks. Borsa Istanbul Review, 17(2), 86–96. https://doi.org/10.1016/j.bir.2017.02.003
- Fare, R., & Grosskopf, S. (1996). Productivity and intermediate products: A frontier approach. Economics Letters, 50(1), 65–70. https://doi.org/10.1016/0165-1765(95)00729-6
- Fernandes, F. D. S., Stasinakis, C., & Bardarova, V. (2018). Two-stage DEA-Truncated regression: Application in banking efficiency and financial development. Expert Systems with Applications, 96, 284–301. https://doi.org/10.1016/j.eswa.2017.12.010
- FSB. (2011). Shadow banking: Strengthening oversight and regulation. Financial Stability Board, 2–46 .
- Gandhi, P., Lustig, H., Plazzi, A., & Karolyi, A. (2020). Equity is cheap for large financial institutions. The Review of Financial Studies, 33(9), 4231–4271. https://doi.org/10.1093/rfs/hhaa001
- Gaur, D., & Mohapatra, D. R. (2021). Non-performing assets and profitability: Case of Indian banking sector. Vision: The Journal of Business Perspective, 25(2), 180–191. https://doi.org/10.1177/0972262920914106
- Ghosh, A., & Dey, M. (2018). Performance measure of Indian general insurance companies using DEA and super efficiency model. Journal of Economics & Business Research, 24(1), 57–68. https://web.s.ebscohost.com/ehost/pdfviewer/pdfviewer?vid=0&sid=dd193e8f-384e-48de-ac68-c84b4919b9e2%40redis
- Ghosh, S., & Mazumder, D. (2023). Do NBFCs propagate real shocks? Journal of Asian Economics, 85, 101590. https://doi.org/10.1016/j.asieco.2023.101590
- Goyal, J., Singh, R., Kaur, H., & Singh, K. (2018). Intra-industry efficiency analysis of Indian textile industry: A meta-frontier DEA approach. International Journal of Law and Management, 60(6), 1448–1469.
- Goyal, J., Singh, M., Singh, R., & Aggarwal, A. (2019). Efficiency and technology gaps in Indian banking sector: Application of meta-frontier directional distance function DEA approach. The Journal of Finance and Data Science, 5(3), 156–172. https://doi.org/10.1016/j.jfds.2018.08.002
- Gulati, R., & Kumar, S. (2017). Analysing banks’ intermediation and operating efficiencies using the two-stage network DEA model. International Journal of Productivity and Performance Management, 66(4), 500–516. https://doi.org/10.1108/IJPPM-03-2016-0055
- Hafsal, K., Suvvari, A., & Durai, S. (2020). Efficiency of Indian banks with non-performing assets: Evidence from two-stage network DEA. Future Business Journal, 6(1), 1–9. https://doi.org/10.1186/s43093-020-00030-z
- Haq, M., Skully, M., & Pathan, S. (2010). Efficiency of microfinance institutions: A data envelopment analysis. Asia-Pacific Financial Markets, 17(1), 63–97. https://doi.org/10.1007/s10690-009-9103-7
- Holod, D., & Lewis, H. F. (2011). Resolving the deposit dilemma: A new DEA bank efficiency model. Journal of Banking & Finance, 35(11), 2801–2810. https://doi.org/10.1016/j.jbankfin.2011.03.007
- Ilyas, A. M., & Rajasekaran, S. (2019). An empirical investigation of efficiency and productivity in the Indian non-life insurance market. Benchmarking: An International Journal, 26(7), 2343–2371. https://doi.org/10.1108/BIJ-01-2019-0039
- Jaffry, S., Ghulam, Y., & Cox, J. (2013). Trends in efficiency in response to regulatory reforms: The case of Indian and Pakistani commercial banks. European Journal of Operational Research, 226(1), 122–131. https://doi.org/10.1016/j.ejor.2012.11.002
- Jagwani, B. (2012). Efficiency measurement in the Indian banking industry: An application of data envelopment analysis. Vision: The Journal of Business Perspective, 16(4), 315–331. https://doi.org/10.1177/0972262912460191
- Jarrow, R. A., & Silva, F. B. G. (2015). Risk measures and the impact of asset price bubbles. Journal of Risk, 17(3), 35–56. https://doi.org/10.21314/JOR.2015.321
- Jothimani, D., Shankar, R., & Yadav, S. S. (2017). A PCA-DEA framework for stock selection in Indian stock market. Journal of Modelling in Management, 12(3), 386–403. https://doi.org/10.1108/JM2-09-2015-0073
- Kandi, P., Amrutha, J., & Muppidi, S. S. (2022). Non-performing assets: A comparative study with reference to selected public and Private banks. Academy of Marketing Studies Journal, 26(4), 1–8.
- Kar, S., & Deb, J. (2017). Efficiency determinants of microfinance institutions in India: Two stage DEA analysis. The Central European Review of Economics and Management (CEREM), 1(4), 87–116. https://doi.org/10.29015/cerem.528
- Kaur, S., & Gupta, P. K. (2015). Productive efficiency mapping of the Indian banking system using data envelopment analysis. Procedia Economics and Finance, 25, 227–238. https://doi.org/10.1016/S2212-5671(15)00733-9
- Kaur, R., & Puri, J. (2023). Cost efficiency analysis using relational dynamic network DEA: A case study in the Indian banking sector. The Journal of Analysis, 1–25.
- Kelly, B., Lustig, H., & Van Nieuwerburgh, S. (2016). Too-systemic-to-fail: What option markets imply about sector-wide government guarantees. American Economic Review, 106(6), 1278–1319. https://doi.org/10.1257/aer.20120389
- Khan, A., Ahmad, A., Shireen, S., & McMillan, D. (2021). Ownership and performance of microfinance institutions: Empirical evidences from India. Cogent Economics & Finance, 9(1), 1930653. https://doi.org/10.1080/23322039.2021.1930653
- Khan, A., & Gulati, R. (2019). Assessment of efficiency and ranking of microfinance institutions in India: A two-stage bootstrap DEA analysis. International Journal of Business Forecasting and Marketing Intelligence, 5(1), 23–55. https://doi.org/10.1504/IJBFMI.2019.099008
- Kumar, M., Charles, V., & Mishra, C. S. (2016). Evaluating the performance of Indian banking sector using DEA during post-reform and global financial crisis. Journal of Business Economics and Management, 17(1), 156–172.
- Kumar, S., & Gulati, R. (2008). An examination of technical, pure technical, and scale efficiencies in Indian public sector banks using data envelopment analysis. Eurasian Journal of Business and Economics, 1(2), 33–69.
- Kumar, V. P., & Kar, S. (2022). Measuring the efficiency of Indian public and private banks using the two-stage network DEA model. Benchmarking: An International Journal, 30(2), 382–406. https://doi.org/10.1108/BIJ-07-2021-0375
- Kumar, N., & Sensarma, R. (2017). Efficiency of microfinance institutions in India: A stochastic distance function approach. Journal of Emerging Market Finance, 16(2), 151–168. https://doi.org/10.1177/0972652717712372
- Li, Y. (2020). Analyzing efficiencies of city commercial banks in China: An application of the bootstrapped DEA approach. Pacific-Basin Finance Journal, 62, 101372. https://doi.org/10.1016/j.pacfin.2020.101372
- Liu, J. S., Lu, L. Y. Y., Lu, W., & Lin, B. J. Y. (2013). A survey of DEA applications. Omega, 41(5), 893–902. https://doi.org/10.1016/j.omega.2012.11.004
- Mandal, S., & Dastidar, S. G. (2014). A DEA-investigation of efficiency of the Indian general insurance during recession. Journal of Advances in Management Research, 11(1), 115–136. https://doi.org/10.1108/JAMR-07-2012-0030
- Mayston, D. J. (2017). Data envelopment analysis, endogeneity and the quality frontier for public services. Annals of Operations Research, 250(1), 185–203. https://doi.org/10.1007/s10479-015-2074-3
- Mehrling, P., Pozsar, Z., Sweeney, J., & Neilson, D. H. (2013). Bagehot was a shadow banker: shadow banking, central banking, and the future of global finance. Central Banking, and the Future of Global Finance (5th November 2013). https://doi.org/10.2139/ssrn.2232016
- Mehta, K., Sharma, R., & Vyas, V. (2019). Efficiency and ranking of sustainability index of India using DEA-TOPSIS. Journal of Indian Business Research, 11(2), 179–199. https://doi.org/10.1108/JIBR-02-2018-0057
- Mohanty, S. P., Mahendra, A., & Gopalkrishnan, S. (2022). “Soar” or “sore”: Examining and reflecting on bank performance during global financial crisis–an Indian scenario. International Journal of Information Technology Project Management (IJITPM), 13(3), 1–17. https://doi.org/10.4018/IJITPM.313662
- Mohapatra, S., Misra, A. K., & Rahman, M. R. (2023). Impact of banking sector competition on emerging market banks’ safety and soundness–A study on Indian banks. Cogent Economics & Finance, 11(1). https://doi.org/10.1080/23322039.2023.2216980
- NHB. (2021). Report on trend and progress of housing in India.
- Orme, C., & Smith, P. (1996). The potential for endogeneity bias in data envelopment analysis. The Journal of the Operational Research Society, 47(1), 73–83.
- Pal, D. (2010). Measuring technical efficiency of microfinance institutions in India. Indian Journal of Agricultural Economics, 65(4).
- Pasiouras, F. (2008). Estimating the technical and scale efficiency of Greek commercial banks: The impact of credit risk, off-balance sheet activities, and international operations. Research in International Business and Finance, 22(3), 301–318. https://doi.org/10.1016/j.ribaf.2007.09.002
- Patra, B., Padhan, P. C., & Padhi, P. (2023). Efficiency of Indian banks–private versus public sector banks: A two-stage analysis. Cogent Economics & Finance, 11(1). https://doi.org/10.1080/23322039.2022.2163081
- Pozsar, Z. (2008). The rise and fall of the shadow banking system. Regional Financial Review, 44(2008), 1–13.
- Puri, J., & Yadav, S. P. (2013). Performance evaluation of public and private sector banks in India using DEA approach. International Journal of Operational Research, 18(1), 91–121. https://doi.org/10.1504/IJOR.2013.055540
- Quaranta, A. G., Raffoni, A., & Visani, F. (2018). A multidimensional approach to measuring bank branch efficiency. European Journal of Operational Research, 266(2), 746–760. https://doi.org/10.1016/j.ejor.2017.10.009
- Raina, D., & Kumar Sharma, S. (2013). Determinants of cost efficiency of commercial banks in India: DEA evidence. The IUP Journal of Bank Management, 12(2), 17–30.
- RBI. (2021). Report on trend and progress of banking in India.
- Saha, A., & Ravisankar, T. S. (2000). Rating of Indian commercial banks: A DEA approach. European Journal of Operational Research, 124(1), 187–203. https://doi.org/10.1016/S0377-2217(99)00167-8
- Sanjeev, G. M. (2006). Data envelopment analysis (DEA) for measuring technical efficiency of banks. Vision: The Journal of Business Perspective, 10(1), 13–27. https://doi.org/10.1177/097226290601000102
- Sanjeev, G. M. (2009). Efficiency of Indian public sector banks: An application of DEA approach. The IUP Journal of Applied Finance, 15(11), 52–61. https://web.s.ebscohost.com/ehost/pdfviewer/pdfviewer?vid=0&sid=00461d53-e14d-451c-80bd-51094fccfe6c%40redis
- Sathye, M. (2003). Efficiency of banks in a developing economy: The case of India. European Journal of Operational Research, 148(3), 662–671. https://doi.org/10.1016/S0377-2217(02)00471-X
- Satya Krishna Sharma, R., Bijoy, K., & Sahay, A. (2022). Issues in liquidity management in banking system: An empirical evidence from Indian commercial banks. Cogent Economics & Finance, 10(1). https://doi.org/10.1080/23322039.2022.2122190
- Shieh, H. S., Li, Y., Hu, J. L., & Ang, Y. Z. (2022). A Comparison of efficiency of life insurance companies in Mainland China and Taiwan using bootstrapped truncated regression approach. Cogent Economics & Finance, 10(1), 2043571. https://doi.org/10.1080/23322039.2022.2043571
- Silva, F. B. G. (2021). Fiscal deficits, bank credit risk, and loan-loss provisions. Journal of Financial and Quantitative Analysis, 56(5), 1537–1589. https://doi.org/10.1017/S0022109020000472
- Singh, P. K., Thaker, K., & Papavassiliou, V. (2020). Profit efficiency and determinants of Indian banks; a truncated bootstrap and data envelopment analysis. Cogent Economics & Finance, 8(1), 1724242. https://doi.org/10.1080/23322039.2020.1724242
- Sinha, A. (2013). Regulation of shadow banking–issues and challenges. Reserve Bank of India Bulletin, 67(3), 23–36.
- Sinha, R. P. (2015). A dynamic DEA model for Indian life insurance companies. Global Business Review, 16(2), 258–269. https://doi.org/10.1177/0972150914564418
- Sinha, R. P., & Pandey, P. (2019). Efficiency of microfinance institutions in India: A two-stage DEA approach. International Journal of Rural Management, 15(1), 49–77. https://doi.org/10.1177/0973005219832494
- Stewart, C., Matousek, R., & Nguyen, T. N. (2016). Efficiency in the Vietnamese banking system: A DEA double bootstrap approach. Research in International Business and Finance, 36, 96–111. https://doi.org/10.1016/j.ribaf.2015.09.006
- Subhash, R. C., & Chen, L. (2010). Data envelopment analysis for performance evaluation: A child’s guide. Indian Economic Review, 45(2), 373–399.
- Sufian, F. (2006). The efficiency of non-bank financial institutions: Empirical evidence from Malaysia. International Journal of Finance and Economics, 6(1), 18–2.
- Sufian, F. (2007). What explains differences in the efficiency of non-commercial bank financial intermediaries? Empirical evidence from Malaysia. Asian Academy of Management Journal of Accounting and Finance, 3(1), 37–57.
- Sufian, F. (2008). Revenue shift and the non-bank institutions’ productivity: Empirical evidence from Malaysia. Studies in Economics and Finance, 25(2), 75–92. https://doi.org/10.1108/10867370810879410
- Sufian, F. (2011). Benchmarking the efficiency of the Korean banking sector: A DEA approach. Benchmarking: An International Journal, 18(1), 107–127. https://doi.org/10.1108/14635771111109841
- Sufian, F., & Habibullah, M. S. (2009). Asian financial crisis and the evolution of Korean banks efficiency: A DEA approach. Global Economic Review, 38(4), 335–369. https://doi.org/10.1080/12265080903391735
- Sufian, F., & Majid, M. Z. A. (2007). Banks’ efficiency and stock prices in emerging markets: Evidence from Malaysia. Journal of Asia-Pacific Business, 7(4), 35–53. https://doi.org/10.1300/J098v07n04_03
- Tandon, D., Tandon, K., & Malhotra, N. (2014). An evaluation of the technical, pure technical and scale efficiencies in the Indian banking industry using data envelope analysis. Global Business Review, 15(3), 545–563. https://doi.org/10.1177/0972150914535141
- Tan, Y., Wanke, P., Antunes, J., & Emrouznejad, A. (2021). Unveiling endogeneity between competition and efficiency in Chinese banks: A two-stage network DEA and regression analysis. Annals of Operations Research, 306(1–2), 131–171. https://doi.org/10.1007/s10479-021-04104-1
- Xiaogang, C., Skully, M., & Brown, K. (2005). Banking efficiency in China: Application of DEA to pre-and post-deregulation eras: 1993–2000. China Economic Review, 16(3), 229–245. https://doi.org/10.1016/j.chieco.2005.02.001
- Yu, H., Zhang, Y., Zhang, A., Wang, K., & Cui, Q. (2019). A comparative study of airline efficiency in China and India: A dynamic network DEA approach. Research in Transportation Economics, 76, 100746. https://doi.org/10.1016/j.retrec.2019.100746
- Zhang, J., Bi, Z., Hu, M., & Meng, Q. (2023). Shadow banking and commercial bank: Evidence from China. Applied Economics, 55(1), 72–89. https://doi.org/10.1080/00036846.2022.2055741
