?Mathematical formulae have been encoded as MathML and are displayed in this HTML version using MathJax in order to improve their display. Uncheck the box to turn MathJax off. This feature requires Javascript. Click on a formula to zoom.
Abstract
The recent twin crises of the COVID-19 pandemic and the Russia-Ukraine war have caused global economic effects, with gross variation, across countries. Evidently, higher self-sufficient economies with more effective economic performances faired relatively better with these shocks. This calls for policymakers to revisit the drivers of growth with a specific interest in sectors or tools wherein they seem to have a comparative advantage. Industrialization becomes imperative for Lesotho and inspires this study’s interest in analyzing its relationship with economic growth. Surprisingly, existing empirical literature shows heterogonous outcomes on the relationship between Industrialization and economic growth and sometimes contradicts the expected positive relationship in theories. This study employs the Auto Regressive Distributed Lag (ARDL) model, to test the dynamic effect of Industrialization on economic growth for a unique case study—Lesotho. Additionally, this study employs the nonlinear ARDL to investigate the existence of asymmetry in the model. The time span from 1981 to 2020. The findings show that industrial development has significantly impacted the economic growth of Lesotho in the short and long run. And there exists no significant asymmetry in the short and long run. This provides empirical evidence for policymakers to intensify efforts in promoting Industrialization in Lesotho.
1. Introduction
Sustainable Industrialization stands out as the 9th Sustainable Development Goals (SDGs) of the 2030 Global Agenda for Sustainable Development. As is the case with other multilateral organizations, the African Development Bank (AfDB) adopted the SDGs in 2015. More specifically, one of the 5 key areasFootnote1 of the AfDB’s focus is to industrialise Africa. Similarly, the African Union upholds trade and industrial development as one of its key programme areas. This global and regional recognition of Industrialization points to its immense relevance to the economy, for socio-economic development, especially in Africa. Despite the emphasis of policies on Industrialization, the statistics do not show commensurate commitment.
According to the World Bank Development Indicators, industry value added as a percentage of Gross Domestic Product (GDP) in Sub-Saharan Africa (SSA) dropped from 35.5% in 1981 to 27.3% in 2021–4 decades after. Likewise, manufacturing value added as a percentage of GDP for SSA dropped from 18% in 1981 to an all-time low of 10% in 2012 and then slightly improved to 12% in 2021 (World Bank, Citation2022b). The World Bank posits that the prevalence of exports of primary products and availability of mostly low-skill tasks have reduced the region’s integration into manufacturing Global Value Chains (GVCs) and ultimately explains the lack of improvement in the contribution of manufacturing value-added to GDP (World Bank, Citation2021).
Interestingly, Lesotho shows a more promising trend. Thus, industry value added as a percentage of GDP has increased from 22.4% in 1981 to 35.1% in 2021 while manufacturing value added as a percentage of GDP increased from 8% in 1981 to 15% in 2021. This is largely credited to the growing Industrialization of textiles, clothing, footwear, food processing, and mining-related products. In particular, the United States-led African Growth and Opportunity Act (AGOA) and the World Trade Organization’s Agreement on Textiles and Clothing, which propelled textile exports to reach $305.4 million in 2020, making Lesotho one of the largest exporters of garments to the United States from SSA (International Trade Administration, Citation2021). In view of this relatively encouraging performance, the question of, to what extent Industrialization in Lesotho has impacted socio-economic development becomes imperative.
The relevance of this question is based on the recent gloomy economic outlook of Lesotho. In the last decade, the Lesotho government’s Debt to GDP ratio has not gone below 35% (World Bank, Citation2022a). Its 2021 statistics rank her higher than over 50% of African countries. The African Development Bank (Citation2022) posits that the current account deficit reduced to 2.8% in 2021 from 7.9% of GDP in 2017 and the fiscal deficit increased from 3.8% in 2017 to 5.8% of GDP in 2021, though it was largely financed with capital transfers from South Africa. They also show that Lesotho still recorded about 50% of the poverty headcount in 2021 and unemployment increased from 23.6% in 2018 to 33% in 2021. GDP growth has dropped steadily from an all-time high of 26.4% in 1973 to −7.6% in 2020, while GDP per capita increased from 2,128 Maloti in 1960 to its all-time high of 10,845 Maloti in 2016 but has been dropping since then to 9,536 in 2021 (World Bank, Citation2022b).
Of all the sectors, Lesotho seems to have a comparative advantage in the industrial sector. Thanks to its huge mineral deposits, existing international trade agreements, and relatively unfavourable agricultural and service sectors. Its service sector is still developing while the agricultural sector is largely limited by the geographical composition of Lesotho. Lesotho has limited arable land; it is predominantly mountainous and records extreme weather conditions that keep it largely reliable on food imports. Lesotho recorded arable land of about 14.14% in 2018 and 28% of mechanized imports as food imports in 2020.Footnote2 This is reflected in their current contribution to GDP. However, Horticulture seems to have significant potential in Lesotho due to among other things its climate, soil texture, and elevation, which is well suited for a diversity of horticulture crops according to the National Strategic Development Plan II, 2018–19 to 2022–23. Nevertheless, Lesotho’s composition by sector shows that the agriculture, forestry, and fishing, value added (% of GDP) is 4.9 %, industry (including construction), and value-added (% of GDP) is 35.12 % while trade in services (% of GDP) is 16.9 %Footnote3 (World Bank, Citation2022b).
The link between Industrialization and economic growth cannot be overemphasized. At the core of Industrialization, is the process of transformation or adding value that leads to the creation of semi-finished and finished products, which have the potential to generate revenue via local and international sales. The idea that Industrialization leads to economic growth and development could be traced back to the 19th century (Ciarli & DiMaio, Citation2013). Rostow’s stages of economic growth highlighted this belief, the classical theories sustained it and the growth theories amplified it. This relationship has also been verified empirically by several authors (Binta & Bazza, Citation2018; Ndiaya & Lv, Citation2018; Tahir & Awan, Citation2017; Díaz-Bautista. Nevertheless, the United Nations Industrial Development Organization (Citation2020) in analyzing whether Industrialization is the driver of sustained prosperity, posit that there is a growing consensus that a one-size-fits-all development model does not exist. Moreover, this relationship even when positive is not always significant (Obioma et al., Citation2015; Bennett et al., Citation2015; Ughulu (Citation2021), and in some cases it is negative (Akpan & Eweke, Citation2017; Jelilov & Iheoma, Citation2016; Saba & Ngepah, Citation2021).
The recent twin crises of the COVID-19 pandemic and the Russia-Ukraine war-affected countries all over the world in different ways. However, countries with overdependence on others seem to have been affected the most. Policymakers have begun to introspect—re-examining the drivers of economic growth. In Lesotho, the Industrial sector remains key. The relationship between Industrialization and economic growth or development has been widely established in the literature. Most examples of rapid economic development historically, and more recent examples like China, India, and Taiwan amongst others, are credited to their industrial growth. However, this relationship has been subject to the pattern of Industrialization being done and the positioning in local and global value chains.
The dynamics of Industrialization involve several factors and actors that could ultimately increase growth/development; thereby reducing poverty and inequality as expected, or it may transfer these benefits to trading partners. Indeed, to be able to effectively engage in international trade is to be saddled or equipped with a functional and vibrant industrial economy. While this burning and sensitive subject has been widely researched in other climes, literature on Lesotho remains sparse. The objective of this study is therefore, to investigate the extent to which Industrialization affects economic growth in Lesotho.
2. Literature review
Industrialization can be broadly referred to as the process of changing from an agrarian-based production economy to the mass production of finished and semi-finished products, as well as the mass production of specialized pieces of a finished product within global value chains. According to (Kirk-Greene 1981), it is the massive use of machinery and capital assets that hugely drives economic activities within a formal employment framework. Adejugbe (Citation2004) simplifies it by saying, it is the movement from extractive to secondary and tertiary sectors/production. The bottom line is that there is a major change in economic activity that increases money in circulation, creates subsidiary industries across vertical and horizontal lines, increases employment, increases productivity, and increases exports. This defines economic growth which generally refers to the increase in economic goods and services over time and by extension economic development which translates to long-term well-being or standard of living in terms of health, education, and income. This is justified by theoretical literature that establishes the relationship between Industrialization and economic growth/development.
The famous new classical Solow growth model explains economic growth via the accumulation and utilization of capital. According to Solow (Citation1956), capital accumulation, which encompasses present capital stock, future capital stock, capital depreciation, and level of capital investment, is critical to long-run output growth, taking into consideration changes in population growth rate, savings rate, and the rate of technological progress. Interestingly, an aspect of Solow’s economic growth theory is the convergence theory, which predicts that the gap between the rich and poor countries will narrow based on the potentially higher return of capital for poor countries than for rich countries. This implies that capital accumulation in developing countries will have a higher effect on growth than in developed countries. Additionally, the first of the three laws of Kaldor states that there exists a positive relationship between industrial output and economic growth (Kaldor, Citation1967). This constitutes the major theoretical framework within which the nature of the relationship between Industrialization and economic growth is established.
Empirically, this relationship is not always positive and significant. Jelilov and Iheoma (Citation2016) employed the ordinary least square (OLS) estimation technique to investigate the effect of Industrialization on economic growth in Nigeria. The study shows that industrialization has had a negative impact on economic growth in Nigeria in the long run. Similarly, Akpan and Eweke (Citation2017) employed the Impulse Response Functions (IRFs) and Variance Decomposition (VDC) techniques within a Vector Autoregressive (VAR) framework to analyse the effect of Foreign Direct Investment (FDI) and Industrial Sector Performance on economic growth in Nigeria. They find that GDP exhibited a negative response to shocks in Industrial Sector Output throughout the period 1981–2015 in Nigeria.
This outcome contradicts the theory, and several other works, that show a positive relation. For example, Obioma et al. (Citation2015) and Bennett et al. (Citation2015) equally analyzed the effect of Industrialization on economic growth in Nigeria for the same period − 1973 to 2013 using the OLS. While Ughulu (Citation2021) employed the Error Correction Model (ECM). All three studies found a positive relationship between industrial development and economic growth in Nigeria. However, all three studies could not ascertain a significant relationship between industrial development and economic growth in Nigeria. They recommend that the government should address other control factors such as insecurity and a favourable business environment for industries to thrive. Also, Ibbih and Gaiya (Citation2013) employed the generalized least square regression method for 54 African countries to analyse the relationship between industrialization and economic growth. The findings shows a weak relationship between industrialization and economic growth.
There are, however, other empirical works that establish a significant relationship. For example, Binta and Bazza (Citation2018) analysed the effect of industrialization on economic growth in Nigeria between 1981 and 2015 using the Autoregressive Distributed Lag (ARDL) model. They show a positive and significant relationship between industrial output and gross domestic product in Nigeria. Still in Nigeria, Ibitoye et al. (Citation2022) investigated the relationship between Industrial output and economic growth using an error correction model and graner causality. The findings show that Industrial output has a significant direct effect and a unidirectional causal impact on real GDP in Nigeria.
Similarly, Ndiaya and Lv (Citation2018) also analyzed the impact of industrialization on economic growth in Senegal using the OLS technique and established a positive and significant relationship between industrial output and economic growth. Tahir and Awan (Citation2017) obtained similar results for Pakistan, using ARDL. In addition, Díaz-Bautista (Citation2004) and Kemal et al. (Citation2002) ascertained a positive correlation, or causality, between industrialization and economic growth in South Asia and Mexico respectively. Sahar (Citation2020) investigated the relationship between industrialization and economic growth in Pakistan between 1976 and 2015. They employ the ARDL to agree with the theory that there exists a significant long-run association between industrialization and economic growth in Pakistan.
From a panel perspective, we review Saba and Ngepah (Citation2021), Attiah (Citation2019), and Bokosi (Citation2022) who investigated the relationship between industrialization and economic growth. Similar to Jelilov and Iheoma (Citation2016) and Akpan and Eweke (Citation2017), Saba and Ngepah (Citation2021) examined the relationship between ICT diffusion, Industrialization and economic growth for a panel of 171 countries over the period 2000–2018. They employed the panel VAR in the generalized method of moment (GMM) to show that at the global level, Industrialization has negative impact on economic growth. Attiah (Citation2019) shows that the impact of manufacturing and the service sectors on the economic growth of 10 developed and 40 developing countries between 1950 and 2015. Converse to the findings of Saba and Ngepah (Citation2021), Attiah (Citation2019) found that the effect of the manufacturing sector on economic growth is more significant for developing countries than for developed countries. Also, Bokosi (Citation2022) investigated the effect of industrialization on economic growth for 6 Southern African countries covering 1978 to 2019. The study used the pooled mean group and mean group dynamic fixed effects to show that industrialization is positively associated with economic growth in both the short and long-run.
Li and Huang (Citation2017) employed a different approach by estimating the impact of a localized industrial structure on economic growth. Their findings suggest that the three studied industries in Baoshan had a significant positive correlation with GDP, though with different marginal contributions. Overall, there seems to be an intrinsic relationship between industrialization and economic growth, which can be explained by the fact that almost all countries that have experienced rapid growth in productivity and living standards over the last two hundred years have done so by industrializing (Murphy 1989; United Nations Industrial Development Organization, Citation2009). In Lesotho, Molapo and Damane (Citation2016) narrow the focus to the diamond subsector industry. They employ ECM and causality to show that there exists a bi-direction long-run causality between diamond mining exports and economic growth in Lesotho.
More recent studies turn to associate trade and economic growth with environmental indices. For example, in an attempt to investigate the reverse causality between global carbon emissions and economic growth, Li et al. (Citation2021) employed panel data and time series data to analyze the impact of changes in economic, energy intensity, and four structural factors on carbon emissions from the global level and income group level. They found that there exists a bidirectional granger causality relationship between global per capita carbon emissions and economic growth, and between global per capita carbon emissions and economic structure. Similarly, Wang et al. (Citation2023) investigated how trade openness, human capital, renewable energy, and natural resource rent relate to economic growth for 208 countries between 1990 and 2018. The findings validate the environmental Kuznets curve (EKC) hypothesis and show a positive correlation between the economy and carbon emissions and ecological footprint.
Wang et al. (Citation2023) analyzed the relationship between trade openness, economic growth, and carbon emissions for panel data from 124 countries around the world from 2000 to 2018. They conclude that trade openness favors carbon neutrality in rich countries, but not in poor countries. Wang and Su (Citation2019) examined the impact of Industrialization on the decoupling of economic growth from carbon emission in China with the aid of the Johansen co-integration and Granger causality techniques between 1990 and 2015. The study showed that Industrialization has a greater impact on economic growth than the effect that environmental pollution generates. Also, Adebayo and Kartal (Citation2023) opines that there is a strong negative (positive) co-movement between industrial CO2 emissions and green bonds in the short-run (long-run).
Analyzing the relationship between Industrialization and economic growth is not new. As discussed above, examples of such empirical studies Abound. Studies that specifically examine the effect of Industrialization on economic growth from a panel perspective, the include Saba and Ngepah (Citation2021), Attiah (Citation2019), and Bokosi (Citation2021) who employed a panel of selected developing countries. From a developing country perspective, majority of such works for country-specific case studies were done for Nigeria (Akpan & Eweke, Citation2017; Bennett et al., Citation2015; Binta & Bazza, Citation2018; Obioma et al., Citation2015; Ughulu, Citation2021). Ndiaya and Lv (Citation2018) analysed that of Senegal, Tahir and Awan (Citation2017) analysed that of Pakistan and Díaz-Bautista (Citation2004) and Kemal et al. (Citation2002) examined that of Mexico. Similar to these studies, this study examines the effect of Industrialization on economic growth from a country-specific study—Lesotho.
This is first and foremost because the empirical findings do not always show a positive and significant relationship as the theoretical literature suggests. While empirical evidence in most works exhibits a positive and significant relationship, some show a positive but not significant relationship, and, conversely, others show a negative relationship. This is not completely strange as economic growth theory especially that of Solow, presupposes that the rate of return on growth (or growth rate) is dependent principally on capital accumulation as well as other facilitating conditions. This invariably means that the extent to which industrial development affects the economic growth or development of a country/economy is dependent on that country/economy. Empirical works that investigate this relationship for Lesotho in the public domain are generally very scarce.
Another key factor for examining the case of Lesotho is that this country is unique and different from the countries that have been investigated and indeed many other countries. Lesotho is a landlocked country that is surrounded by only one country—South Africa. This has varying effects on its ability to exploit, process, market and/or export industrial products. Additionally it has the highest lowest altitude in the world estimated at 1,400 m (World Atlas, Citation2023) with very limited arable land − 4.5% in 2019 (World Bank, Citation2023a). This is important because it significantly influences the policy space and tend to push national programs and policies in favour of the agricultural sector relative to the industrial sector. As we argue in this study, Lesotho has a comparative advantage in Industrialization and empirical evidence that supports this will be instrumental in tilting policies in the right direction. Additionally, this study contributes to the existing empirical investigations of this relationship by employing the non-linear ARDL. No previous study on this relationship tested the asymmetric relationship as this study does to confirm that the series does not have an asymmetric relationship. This study, therefore, employs robust time series econometric tools to estimate how industrial development affects the economic growth of Lesotho.
3. Industrialization in Lesotho – context
3.1. Overview
In the last two decades, Lesotho has witnessed considerable industrial expansion, especially in textile and garment-related firms. According to the Lesotho Embassy in Rome, this could be credited to the sound economic fundamentals and several proactive steps taken by the government to support the sector as well as to diversify products and export markets (Lesotho Embassy Rome, Citation2016). The World Fact Book (Citation2022) has identified food, beverages, textiles, apparel assembly, handicrafts, construction, and tourism as the major industries in Lesotho.
3.2. Sector-Specific analysis
In terms of the manufacturing subsector, Lesotho is predominantly engaged in small-scale enterprises that produce candles, ceramics, furniture, food products, fertilizers, and televisions and jewellery (Britannica, Citation2022). The abundant mohair and wool have also engineered a rising clothing industry. Also, other economic activities, such as weaving, canning, diamond cutting, and polishing constitute some of the small-scale industries in the manufacturing sub-sector. The World Fact Book (Citation2022) posits that Lesotho’s largest private employer is the textile and garment industry—approximately 36,000 Basotho, producing garments for export to South Africa and the US.
The mining subsector, on the other hand, has experienced a tremendous boost since the Gem Diamond Mining Co. Ltd of the United Kingdom purchased 76% shares from Letšeng Diamonds Ltd in 2006 (Newman, Citation2006). The 603-carat Lesotho Promise diamond is the 15th largest rough diamond ever discovered, and the biggest diamond uncovered this century (Lesotho Embassy Rome, Citation2016). Diamond mining in Lesotho accounted for nearly 35% of total exports in 2015 (The World Fact Book, Citation2022). Besides diamonds, the Letšeng mine is a major source of uranium, base metals, and clay. Meanwhile, there exist commercial reserves of coal, bituminous shale, sandstone etc in other parts of Lesotho. The relevance of this subsector to creating jobs, reducing the dependency ratio, increasing foreign direct investment, increasing government revenue generation, and ultimately improving sustainable economic growth cannot be overemphasized. Molapo and Damane (Citation2016) were able to establish a bi-direction long-run causality between diamond mining exports and economic growth in Lesotho. Apart from well know Letšeng Mining, there exist the likes of Kao and Liqhobong as other major mining in the country. The three mines are said to sharpen the livelihoods of Basotho through artisanal mining due to individuals facing economic hardships across time and space (Makhethaa & Maliehe, Citation2020).
3.3. Challenges
A key determinant of Industrialization is electricity. Electricity Demand for electricity has been on a steady rise in Lesotho. Thamae et al. (Citation2015, Citation2015) posit that an excess electricity demand of about 41% had to be supplied by more expensive imports from Electricidade de Moçambique than would have been gotten locally (Mozambique’s publicly owned electricity company). According to the World Bank (Citation2022b), only 47.36 % of Basotho have access to electricity in 2022; 71.8 % of firms experienced electrical outages in 2016, and 2.5 % of firm sales were lost due to electrical outages (for affected firms) in 2016. This, therefore, constitutes one of the challenges faced by firms in Lesotho.
Other challenges to industrialization include low productivity, especially in the manufacturing sector, as well as the lack of adequate physical infrastructure, such as good road infrastructure (The International Trade Administration, U.S. Department of Commerce, Citation2022). In addition, major challenges faced in the textile industry include high road transportation costs and inadequate rail systems, low labour productivity, a looming pandemic of HIV/AIDS, hesitation to mechanize production by employers due to scarce availability of spare parts, the inability to deliver adequate training of staff by employees (Elizabeth Glaser Pediatric AIDS Foundation, Citation2020). Another obvious challenge is Lesotho’s dependence on its neighbours due to its landlocked nature.
3.4. Potential for industrial development
Despite Lesotho’s landlocked nature, and other challenges cited above, it has huge potential for industrial development. It has huge deposits of diamonds, gold, and other minerals, as cited above. Lesotho recorded an adult Literacy rateFootnote4 of 76.6 % (2014 estimates) which was higher than the Sub-Saharan African average of 63% at the time and 66% in 2020 (World Bank, Citation2022b). The AGOA presents a good opening for exports, relative to other non-AGOA participants in African Countries. In terms of political stability, Lesotho recorded a 34.1 percentile rank among all countriesFootnote5 (Worldwide Governance Indicators, Citation2022). Its geographical location also exposes it to the huge market of South Africa and neighbouring countries which could be an opportunity or threat depending on how well it is managed. The Minister of Trade and Industry, in 2021, opined that improving the competitiveness of the manufacturing sector; improving social compliance, strengthening value chain offerings, strengthening infrastructure provision and investment promotion could unlock the export manufacturing sector of Lesotho (Marie-Nellygracelin & Baskaran, Citation2021).
3.5. Regional affiliations and prevailing policies
Lesotho is a member of the Southern African Development Community (SADC) and the Southern African Customs Union (SACU). These arrangements allow for some level of openness—providing access to larger markets and skills. The 10th SADC Multi-Stakeholder Dialogue that was recently held between the 5th and 7th of September 2022 in Maseru, Lesotho, was captioned “Bolstering regional productive capacities for water, energy, food security and ecosystem resilience to achieve inclusive and sustainable industrial transformation”. This theme was motivated by the vision to accelerate the implementation of SADC’s Vision 2050 and the SADC Regional Indicative Strategic Development Plan 2020–2030 wherein industrial development is one of the pillars (SADC, Citation2022). SACU, on the other hand, has adopted industrial development as an overarching objective to drive the region’s development and integration agenda.
There have been several policies governing the industrial landscape of Lesotho; some of which have not been effectively implemented relative to others. For example, Tlhatlosi and Pekeur (Citation2018) opined that the Lesotho Growth Strategy Industrialization Master Plan (IMP) 2007–2010, Investment Policy 2009, SME White Paper (2002), State of Small Enterprise (2008), Industrial Policy [Draft] (2012), were all established but, due to lack of political will and determination on the side of the government, were never implemented, regardless of the amount of money and time spent on them. However, other policies such as the Vision 2020 that introduced the Poverty Reduction Strategic Paper (PRSP) policy 2002/3–2005/6, National Strategic Development Plan (2012/13–2016/17), National Strategic Development Plan II (2018-19 – 2022-23) have been perceived to have had greater implementation rates. The policies with inadequate implementation were challenged by the lack of political will; lack of coordination and cooperation; lack of implementation mechanisms and foreign influence, especially where stakeholders expect the alignment of Lesotho and South African industrial laws (Tlhatlosi & Pekeur, Citation2018).
4. Methodology and data
4.1. Methodology
The theoretical framework for this study is based on the first law of Kaldor, which infers that industrial output is a function of GDP growth. The theoretical stipulation representing the first law of Kaldor is given as:
Where refers to the growth of total output proxied with GDP growth;
is industrial development proxied by industrial output;
is the intercept and
measures the coefficient of industrial development.
The study employs the autoregressive distributed lag model (ARDL) model to test the null hypothesis that Industrialization does not significantly affect economic growth in Lesotho. The ARDL estimates the outcome variable based on its lag values as well as the current and lag variables of other exogenous variables. Similar to Irfan et al. (Citation2023), Binta and Bazza (Citation2018) and Sahar (Citation2020), the study therefore specifies an ARDL econometric model thus:
Where ,
, and
are optimal lag orders;
,
,
are coefficients;
is a vector of the error terms—unobserved zero mean white noise vector process;
is the constant;
. The control variables include domestic credit to the private sector, foreign direct investment as a percentage of GDP and real effective exchange rate. These control variables are informed by some empirical works such as Ndiaya and Lv (Citation2018), Binta and Bazza (Citation2018) and Ughulu (Citation2021) as well as theoretical determinants of the outcome variable subject to data availability.
Given that the bounds test was cointegrated, the model specified for the long run is therefore given as:
Where is the speed of adjustment and ECT is the error correction or adjustment terms which is the extracted residuals from the regression of the long-run equation.
The ARDL cointegration model as developed by Pesaran and Shin (Citation1999) and later by Pesaran et al. (Citation2001) is celebrated principally due to 3 key advantages. First it allows for the estimation of variables with different orders of integration as is the case with this dataset; the ARDL test is relatively more efficient in the case of small and finite sample sizes of data and lastly, by applying the ARDL technique we can obtain unbiased estimates of the long-run model (Pesaran et al., Citation2001; Raghuramapatruni1 & Chaitanya, Citation2020).
The study, therefore, employed the Augmented Dickey-Fuller (ADF) and Phillip Perron (PP) to investigate the stationarity levels of the variables employed. After establishing different order of integration, the study employed the ARDL cointegration bounds test which validated the need for a long-run ARDL estimation as shown in the results section.
The table below explains the relationship between the independent variables and the dependent variable.
4.2. Data description
The study employed time series data for Lesotho from 1981 to 2020, accounting for 40 years. This time scope permitted us to secure sufficient degrees of freedom. However, this time scope limited the study from incorporating institutional variables, such as political stability and government effectiveness, whose data deposits only start in 1996. Nevertheless, given that the model employed caters to lag dependent variables as well as current and lag explanatory variables, the dependent variable remained sufficiently explained. All the data for the variables employed was collected from the World Bank indicators depository and its description is detailed in the appendix.
The summary statistics of the variables shown below suggest that the mean growth rate for Lesotho between 1981 and 2020 is 3.17% with a minimum of −7.56% and a maximum of 8.6%. The standard deviation and variances are relatively high, showing a gross variation in growth rate across the sampled years. The mean of the log of industrial output, domestic credit to the private sector as a percentage of GDP, foreign direct investment inflows as a percentage of GDP and real effective exchange rate are 21.76%, 14.95%, 2.57% and 137.04% respectively.
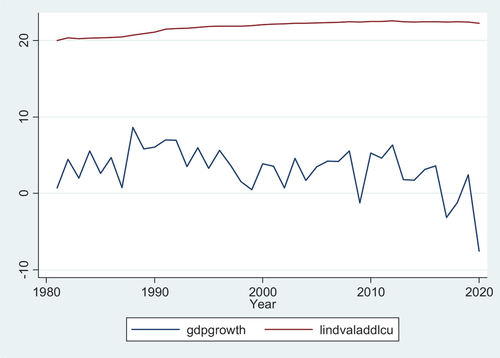
The pairwise correlation shows that the highest correlation coefficient is less than 0.42 except that of reel effective exchange rate and the log of industrial output. However, the variance inflation factor (VIF) between the variables is all less than 6.4, and the mean VIF is 3.7. Some of the descriptive statistics are presented in the appendices below. Specifically, Figure shows the scatter gram of GDP growth and the model residual, Figure shows the CUSUM graph of the Model and Figure shows the Line graph of GDP growth and industry value added. Meanwhile, shows the description of the variables and the units of measurements.
5. Empirical results
To ascertain the effect of industrial development on economic growth, this paper employed the ARDL model. To use this model, the study first checked the variables for stationarity using the ADF and the PP tests. The results for both tests were similar as shown in the Table below. The results show that GDP growth rate, log of industrial value-added and foreign direct investment (% of GDP) are stationary at level {I(0)} while domestic credit to the private sector (% of GDP) and real effective exchange rate are stationary at difference level {I(1)}.
Having established different orders of integration, the study proceeds to estimate the ARDL Bounds cointegration test. The results show that the F-statistic of 7.856 is higher than the upper bound values for all significant levels, which suggests that we reject the null hypothesis of no co-integration and therefore conclude that there exists significant long-run cointegration.
The study then estimates the long-run ARDL model. However, we first discuss its diagnostics checks as shown in Table below. The outcome of the diagnostics infers that there exists no serial correlation according to the Breusch-Godfrey LM Test, no Autoregressive conditional heteroskedasticity according to the ARCH tests and no heteroscedasticity according to the white test. Table , shows the theoretical and empirical justifications of the variables used in the model.
Table 1. Justification of explanatory Variables
Table , shows the summary statistics of the variables, while Table , Table and Table shows the unit rrot test, the ARDL bounds test and relevant diagnostics respectively. The results from Table show that we do not have enough information to reject the null hypothesis that the skewness and kurtosis of this sample are different from the normal distribution. The scattergram between GDP growth and the model residual shows a 45-degree line pattern as presented in the appendix, suggesting that the model is linear. While the CUSUM graph shows that the plotted points fluctuate randomly within the control limits.
Table 2. Summary statistics of Variables
Table 3. Unit root test results
Table 4. ARDL Bounds test cointegration results
Table 5. Diagnostic checks
The results in Table below show an R square of 0.8110 which suggests that 81.1% of the dependent variable is explained by the independent variables. Incorporating more control variables into the model was limited by the caution that the maximum number of iterations had been exceeded. Nevertheless, we infer that the lag of the dependent variable as well as the current values and lag variables of the explanatory variables employed in the model greatly explain the dependent variable.
Table 6. Short and long-run effects of industrial development on the economic growth of Lesotho
To respond to the key objective of this study, the findings show that the lag of industry value added significantly and positively affects the GDP growth rate both in the short run and long run. In the short run, both the current and first lag of industry value added is positive and significant at a 5% level of significance. In the short run, a unit increase in industrial value added significantly increases the GDP growth rate by 11.1% in the current year and 17.44% in the next year. And in the long run, industry value added is equally positive and significant at a 5% significant level. Though the relatively high magnitude of the short run diminishes in the long run. In the long run, a unit increase of industrial value added increases the GDP growth rate by 1.8%.
This result conforms to those of Binta and Bazza (Citation2018), Ndiaya and Lv (Citation2018) and Tahir and Awan (Citation2017) who found a positive and significant relationship between industrial development and economic growth in Nigeria, Senegal, and Pakistan respectively. It contradicts Jelilov and Iheoma (Citation2016), Akpan and Eweke (Citation2017) and Saba and Ngepah (Citation2021) who found a significant negative relationship. This empirical evidence for Lesotho buttresses the need to re-energize this sector to optimize its full potential to ultimately improve economic growth and development. This is especially relevant since the Kingdom of Lesotho seems to have a comparative advantage in the industrial sector.
This is significant for policy simulations as it informs policymakers that improving industrial value addition may address shocks or short-term growth objectives. The knowledge of this is important especially during shocks where policymakers are usually under pressure for a quick fix to generate the needed economic boost that the economy might need. Interestingly, even though the impact reduces in the long run, it still has a significant effect. For an economy like Lesotho that has limited resources and potential in the agricultural sector. Industrial promotion is therefore the way to go.
In the short run, the other variables that have a significant effect on GDP growth include foreign direct investment as well as its first and second lag values. This is not surprising given the nature of foreign direct investment that the country has been able to attract. This is a good signal as it suggests that foreign direct investment in Lesotho is economically productive and drives growth. This infers that more policies need to be projected to improve foreign direct investments. On the other hand, neither the current values of domestic credit to the private sector nor its lags contribute significantly to GDP growth. This is unhealthy given the role that the private sector generally plays in creating employment and wealth in the economy.
In the long run, a real effective exchange rate has a positive and significant increase in GDP growth rate. The positive relationship between REER and economic growth is not unexpected as Rapetti (Citation2019) reviewed several empirical works to conclude that empirical research largely establishes a significant positive association between REER levels and economic growth. It is however surprising that domestic credit to the private sector is significant and negatively related to growth rates. It could, however, be explained by the assertion that, increasing domestic credit to other beneficiaries other than the private sector such as the public sector may still drive growth in the long run. This only means that the potential multiplier effect of the private sector is being limited as a public sector-driven economy is insufficient in optimally boosting the economy.
The ECM term of −1.46 has the expected negative sign and is significant at a 1% significant level. It is unusually above 1 which implies that there exists only oscillatory convergence. It is still valid as the ECM term ranges between 0 and −2, i.e., ) according to Loayza and Ranciere (Citation2005) and Olczyk and Kordalska (Citation2016). Narayan and Smyth (Citation2006) posit that an ECM term that lies between −1 and −2 implies that equilibrium is attained in a decreasingly fluctuating form.
The study further investigates the non-linearity of the estimation by employing the Non-linear Auto Regressive Distributed Lag model (NARDL) cointegrating bounds proposed by Shin et al. (Citation2014). Shin et al. (Citation2014) question the general assumption asserted by most analysis of cointegrating relationships that suggests a linear combination of the underlying nonstationary variables. The NARDL is a nonlinear dynamic framework capable of simultaneously and coherently modelling asymmetries both in the underlying long-run relationship and in the patterns of dynamic adjustment.
The findings of the NARDL estimation is shown below. The model shows that there exists no heteroscedasticity nor autocorrelation and the series is normally distributed with no specification bias. Table below suggests that the probability values are all above 0.05 both for the short-run and long-run asymmetries. This implies that, all the explanatory variables employed in the study have no significant short-run nor long-run asymmetry. This validates the use of the linear assumption in the ARDL and consequently gives credibility to the results and the inferences thereof.
Table 7. Results of the NARDL estimation of industrial output on economic growth
6. Conclusion
During the presentation of the budget speech to the Lesotho Parliament on the 2nd of March 2022 for the 2022/2023 fiscal year, the Minister of Finance—the Honourable Thabo Sophonea remarked that “the current crisis has reaffirmed the need to steer the economy towards private sector-led growth and build economic resilience to deliver sustainable and inclusive development” (Sophonea, Citation2022). For Lesotho, an evident area for private sector development remains the industrial sector where it has a comparative advantage. Dr Malan Lindeque, at the SADC’s industrialization strategy and roadmap launch in Zimbabwe in April 2018, further opined that the principal drivers of industrialization efforts in Africa must be the private sector as governments are expected to be mere enablers (New Era Live, Citation2018, June 15). Revamping Lesotho’s industrialization is even more important to boost Lesotho’s competitiveness in the context of the industrialization and trade liberalisation agenda of the SADC region as well as the already approved AFTCTA agreement of the African Union.
However, the extent to which industrialization affects economic growth is not known. Theoretical literature promises a positive and significant causal effect between industrialization and economic growth. But the literature shows that this impact of Industrialization can be negative (Akpan & Eweke, Citation2017; Jelilov & Iheoma, Citation2016; Saba & Ngepah, Citation2021), positive but not significant (Bennett et al., Citation2015; Obioma et al., Citation2015; Ughulu, Citation2021) and many more that are positive and significant (Attiah, Citation2019; Binta & Bazza, Citation2018; Ibitoye et al., Citation2022; Ndiaya & Lv, Citation2018). And given the peculiar geographic structure of Lesotho that defines most of her economic indicators, ascertaining the extent to which industrialization affects economic growth in Lesotho is imperative. This constitutes the motivation for this study which empirically investigates the extent to which industrialization affects economic growth in Lesotho. This study contributes to existing literature by investigating the dynamic effect of industrialization on economic growth for a peculiar case study—Lesotho. It further investigates the nonlinearity of the series using the NARDL which is not done in previous studies that measure this relationship.
The findings show that industrial value added significantly improves economic growth in Lesotho both in the short run and long-run. In the short run, a unit increase in industrial value added significantly increases the GDP growth rate by 11.1% in the current year and 17.44% in the next year. In the long run, a unit increase of industrial value added increases the GDP growth rate by 1.8%. This is a huge outcome to ignore, especially because Lesotho recorded only 24.1% industry (including construction), and value added (% of GDP) in 2022 (World Bank, Citation2023c). This was less than the world average of 28%, less than the Sub-Saharan African average of 28% and even less than those of her peers—Botswana (37.4%), Eswatini (32.3%)
According to the World Bank (Citation2023b) industry value added is the net output of a sector after adding up all outputs and subtracting intermediate inputs. This, therefore, means that for Lesotho to optimize its industry value added, in an effort to optimize its effect on the GDP growth rate, it needs to promote innovation and processing at all levels. This can be achieved via a strengthening of the value chains of key products where Lesotho has a comparative advantage, provision of private sector credit and subsidies to reduce cost, export promotion policies of semi-finished and finished products and the promotion of involvement in regional and global value chains.
Besides the national all-inclusive NSDP policy documents, there currently exists no specific policy documents dedicated to industrialization in Lesotho despite its relevance to the economy. This is not only important in addressing some of the specific challenges faced in this sector within the framework of the NSDP, but it also indicates to investors the key subsectors and direction of interest of the government. The Lesotho Embassy in Rome (2016) posits that it is the prerogative of the Ministry of Trade and Industry, Cooperatives and Marketing to develop the requisite institutional capacity to promote industrial expansion and development of investor-friendly policies such as the industrial master plan. Also, the Lesotho National Development Corporation has a role to facilitate the investment and development of manufacturing, processing industries, mining, and commerce, for the promotion of economic growth in Lesotho. Being a macro study, this study is limited in giving specific insights into the gaps that exist and recommendations to improve them. Further studies could apply more micro methodological approaches to identify these gaps and proffer further specific recommendations to policymakers.
Acknowledgments
The authors acknowledge the Ministry of Trade and Industry of Lesotho for soliciting the research and the National University of Lesotho - World Trade Organisation Research Chair for the grant to produce the paper and the platform to present it in a seminar.
Disclosure statement
The authors hereby formerly state that there exists no known competing financial interests or personal relationships that could have appeared to influence the production or publication of this work.
Additional information
Funding
Notes
1. Popularly referred to as “The High 5”.
2. 28% of food to mechanized imports is far higher than the world average of 9% in 2020, SSA average of 14% in 2020 and low income countries’ average of 16 in 2019.
3. Statistics are based on 2021 estimates of the World Bank data base.
4. Percentage of people ages 15 and above.
5. The political stability rank ranges from 0 (lowest) to 100 (highest) rank.
References
- Adebayo, T. S., & Kartal, M. T. (2023). Effect of green bonds, oil prices, and COVID-19 on industrial CO2 emissions in the USA: Evidence from novel wavelet local multiple correlation approach. Energy & Environment. https://doi.org/10.1177/0958305X231167463
- Adejugbe, M. A. (Ed.), (2004). Industrialization, Distortions & economic development in Nigeria since1950. In Industrialization, urbanization & development in Nigeria 1950-1999. Cocept Publications Ltd.
- African Development Bank, (2022). Lesotho economic outlook. https://www.afdb.org/en/countries-southern-africa-lesotho/lesotho-economic-outlook.
- Akpan, E. S., & Eweke, G. O. (2017). Foreign direct investment and industrial sector performance: Assessing the long-run implication on economic growth in Nigeria. Journal of Mathematical Finance, 7(2), 391–19. https://doi.org/10.4236/jmf.2017.72021
- Attiah, E. (2019). The role of manufacturing and service sectors in economic growth: An empirical study of developing countries. European Research Studies, 22(1), 112–128. https://doi.org/10.35808/ersj/1411
- Babubudjnauth, A., & Seetanah, B. (2020). An empirical analysis of the impacts of real exchange rate on GDP, manufacturing output and services sector in Mauritius. International Journal of Finance and Economics, 26(2), 1657–1669. https://doi.org/10.1002/ijfe.1869
- Bennett, K. O., Anyanwu, U. N., & Kalu, A. U. (2015). The effect of industrial development on economic growth (an empirical evidence in Nigeria 1973-2013). European Journal of Business and Social Sciences, 4(2), 127–140.
- Binta, M., & Bazza, A. M. (2018). Appraisal of the impact of Industrialization on economic growth in Nigeria. IOSR Journal of Business and Management, 20(1), 01–10.
- Bokosi, F. K. (2022). Effects of Industrialization on economic growth: Panel data evidence for SADC countries. African Journal of Economic Review, 10(3), 89–110.
- Britannica, (2022). Manufacturing of Lesotho, https://www.britannica.com/place/Lesotho/Challenges-in-the-21st-century
- Ciarli, T., & DiMaio, M., (2013). Theoretical arguments for Industrialization-driven growth and economic development. Science and Technology Policy Research Working Paper Series, 06. Available at SSRN: https://ssrn.com/abstract=2736806
- Díaz-Bautista, A. (2004). Mexico’s industrial engine of growth: Cointegration and causality. http://econwpa.repec.org/eps/em/papers/0402/0402010.pdf
- Duramany-Lakkoh, E. K., Jalloh, M. S., & Jalloh, A. (2022). An empirical examination of the impact of banks on economic growth in Sierra Leone (2001-2017). Journal of Financial Risk Management, 11(2), 258–276. https://doi.org/10.4236/jfrm.2022.112013
- Elizabeth Glaser Pediatric AIDS Foundation, (2020). HIV services for factory workers in Lesotho. https://pedaids.org/2020/12/01/hiv-services-for-factory-workers-in-lesotho/
- Ibbih, J. M., & Gaiya, B. A. (2013). A cross-sectional analysis of industrialization and growth in Africa. International Research Journal of Arts and Social Sciences, 2(6), 150–167.
- Ibitoye, O. J., Ogunoye, A. A., & Kleynhans, E. P. J. (2022). Impact of Industrialization on economic growth in Nigeria. Journal of Economic and Financial Sciences, 15(1), 1–9. https://doi.org/10.4102/jef.v15i1.796
- International Trade Administration. (2021). Lesotho - country commercial Guide. https://www.trade.gov/country-commercial-guides/lesotho-manufacturing
- The International Trade Administration, U.S. Department of Commerce, (2022). Lesotho - country commercial Guide, https://www.trade.gov/country-commercial-guides/lesotho-market-challenges#
- Irfan, M., Ullah, S., Razzaq, A., Cai, J., & Adebayo, T. S. (2023). Unleashing the dynamic impact of tourism industry on energy consumption, economic output, and environmental quality in China: A way forward towards environmental sustainability. Journal of Cleaner Production, 387, 135778. https://doi.org/10.1016/j.jclepro.2022.135778
- Jelilov, G., & Iheoma, E. (2016). Impact of Industrialization on economic growth: Experience of Ten countries in ECOWAS (2000-2013). Being a PPT presentation at the Wagner College, May 26 /2016, New York.
- Kaldor, N. (1967). Strategic factors in economic development. Cornell University Press.
- Kemal, A. R., Din, M., Qadir, U., Fernando, L., & Colombage, S. (2002). Exports and economic growth in South Asia. In A study prepared for the South Asia Network of economic research institutes. SANEI.
- Lesotho Embassy Rome. (2016). Industry. https://www.lesothoembassyrome.it/home/lesotho/explore-lesotho/industry
- Li, M., & Huang, Q. (2017). The impact of industrial structure on economic growth in Baoshan, Yunnan Province. Advances in Social Science, Education and Humanities Research, 106, 180–186. https://doi.org/10.2991/icesem-17.2017.41
- Li, R., Wang, Q., Jiang, Y. L., & Jiang, R. (2021). Per-capita carbon emissions in 147 countries: The effect of economic, energy, social, and trade structural changes. Sustainable Production and Consumption, 27(2021), 1149–1164. https://doi.org/10.1016/j.spc.2021.02.031
- Loayza, N., & Ranciere, R. (2005). Financial development, Financial fragility, and growth. IMF Working Paper, 05(170), 170. https://doi.org/10.5089/9781451861891.001
- Makhethaa, E., & Maliehe, S. (2020). ‘A concealed economy’: Artisanal diamond mining in Butha-Buthe district, Lesotho. The Extractive Industries and Society, 7(3), 975–981. https://doi.org/10.1016/j.exis.2020.06.010
- Marie-Nellygracelin, M. F., & Baskaran, G. (2021. Revitalizing the competitiveness of Lesotho’s export manufacturing sector. https://blogs.worldbank.org/africacan/revitalizing-competitiveness-lesothos-export-manufacturing-sector
- Mehar, M. A. K. (2021). COVID-19, Digital transactions, and economic activities: Puzzling nexus of wealth enhancement, trade, and Financial technology. ADBI Working Paper. Asian Development Bank Institute.
- Molapo, S., & Damane, M. (2016). The export led growth hypothesis in Lesotho: A case of the mining industry. Conference paper presented at the TIPS forum, in Johannesburg, South Africa. https://www.researchgate.net/publication/319005727_The_Export_Led_Growth_Hypothesis_in_Lesotho_A_Case_of_the_Mining_Industry
- Narayan, P., & Smyth, R. (2006). WHAT DETERMINES MIGRATION FLOWS from LOW-INCOME to HIGH-INCOME COUNTRIES? AN EMPIRICAL INVESTIGATION of FIJI–U.S. MIGRATION 1972–2001. Contemporary Economic Policy, 24(2), 332–342. https://doi.org/10.1093/cep/byj019
- Ndiaya, C., & Lv, K. J. (2018). Role of Industrialization on economic growth: The experience of Senegal (1960-2017). American Journal of Industrial and Business Management, 8(10), 2072–2085. https://doi.org/10.4236/ajibm.2018.81013
- New Era Live. (2018, June 15), The private sector should drive Industrialization, https://neweralive.na/posts/private-sector-drive-Industrialization
- Newman, R. H. (2006). The mineral industries of Lesotho and Swaziland. US Geological Survey, Minerals Information.
- Nguyen, C., Su, T., & Nguyen, T. (2018). Institutional quality and economic growth: The case of Emerging economies. Theoretical Economics Letters, 8(11), 1943–1956. https://doi.org/10.4236/tel.2018.811127
- Obioma, B. K., Uchenna, A. N., & Alexanda, K. O. U. (2015). The effect of industrial development on economic growth (an empirical evidence in Nigeria 1973-2013). European Journal of Business and Management, 7(13), 160–170.
- Olczyk, M., & Kordalska, A. (2016). International competitiveness of Czech manufacturing: A sectoral approach with error correction model. Prague Economic Papers, 26, 10.18267/j.pep.605. https://doi.org/10.2139/ssrn.2983168
- Pesaran, M. H., & Shin, Y. (1999). An Autoregressive Distributed Lag Modeling Approach to Cointegration Analysis. In S. Strom (Ed.), Econometrics and Economic Theory in the 20th Century, Chapter 11, The Ragnar Frisch Centennial Symposium. Cambridge University Press.
- Pesaran, H., Shin, Y., & Smith, R. J. (2001). Bounds testing approaches to the analysis of level relationships. Journal of Applied Econometrics, 16(3), 289–326. https://doi.org/10.1002/jae.616
- Raghuramapatruni1, R., & Chaitanya, R. V. S. (2020). An appraisal of the impact of International trade on economic growth of India- through the ARDL approach. International Journal of Economics & Business Administration, VIII(2), 376–387. https://doi.org/10.35808/ijeba/468
- Rapetti, M. (2019). Why does the real exchange rate matter for economic development, Working paper commissioned by the group of 24 and Friedrich-Ebert-Stiftung New York. https://www.g24.org/wp-content/uploads/2019/01/Why_does_RER_matter_for_economic_development.pdf#:~:text=Recent%20research%20has%20shown%20persuasive%20evidence%20indicating%20that,%28SCRER%29%20as%20a%20part%20of%20their%20growth%20strategy.
- Saba, C. S., & Ngepah, N. (2021). ICT diffusion, Industrialization and economic growth nexus: An International cross‑country analysis. Journal of the Knowledge Economy, 13(3), 2030–2069. https://doi.org/10.1007/s13132-021-00795-w
- Sahar, Q. (2020). Relationship between industrialization and economic growth: An empirical study of Pakistan. International Journal of Management, Accounting and Economics, 7(12), 32–46.
- Shin, Y., Yu, B., & Greenwood-Nimmo, M. (2014). Modelling asymmetric cointegration and dynamic multipliers in a nonlinear ARDL framework. In R. Sickles & W. Horrace (Eds.), Festschrift in honor of Peter Schmidt. Springer. https://doi.org/10.1007/978-1-4899-8008-3_9
- Solow, R. M. (1956). A contribution to the theory of economic growth. Quarterly Journal of Economics, 70(1), 65–94. https://doi.org/10.2307/1884513
- Sophonea, T. (2022). Parliament of the Kingdom of Lesotho budget speech to the Parliament of the Kingdom of Lesotho for the 2022/2023 fiscal year “building a resilient. Sustainable and Innovative Economy: Fiscal Consolidation Amid COVID. https://www.gov.ls/wp-content/uploads/2022/03/2022-2023-Budget-Speech-Wednesday-02-03-2022.pdf
- Southern African Development Community. (2022). 10th SADC multi-Stakeholder dialogue opens with clarion call for integrated investments in water, energy and food security. https://www.sadc.int/pt-pt/node/4509
- Tahir, M. U., & Awan, A. G. (2017). Analysis of the impact of agro-industrial sectors on Pakistan’s economic growth. Global Journal of Management, Social Sciences and Humanities, 3(3), 534–552.
- Thamae, L. Z., Thamae, R. I., & Thamae, T. M. (2015). Assessing a decade of regulatory performance for the Lesotho electricity industry. Utilities Policy, 35, 91–101. https://doi.org/10.1016/j.jup.2015.07.006
- Thamae, R. I., Thamae, T. M., & Thamae, L. Z. (2015). Dynamics of electricity demand in Lesotho: A kalman filter approach. Studies in Business and Economics, 10(1), 130–139. https://doi.org/10.1515/sbe-2015-0012
- Tlhatlosi, L., & Pekeur, S. W. (2018). The effectiveness of Lesotho’s industrial policy in poverty reduction. International Journal of Economics, Commerce and Management, 6(2), 417–444.
- Ughulu, S. E. (2021). Industrial Output and Economic Growth in Emerging Economies: Evidence from Nigeria. Applied Finance and Accounting, 7(1), 32–43. https://doi.org/10.11114/afa.v7i1.5175
- United Nations Industrial Development Organization, (2009). Industrial development report 2009: Breaking in and moving up: New industrial challenges for the bottom billion and the middle-income countries.
- United Nations Industrial Development Organization, (2020). Industrialization as the driver of sustained prosperity. Vienna. Available at: https://www.unido.org/sites/default/files/files/2020-04/UNIDO_Industrialization_Book_web4.pdf
- Wang, Q., & Su, M. (2019). The effects of urbanization and industrialization on decoupling economic growth from carbon emission – a case study of China. Sustainable Cities and Society, 51, 101758. https://doi.org/10.1016/j.scs.2019.101758
- Wang, Q., Wang, L., & Li, R. (2023). Trade protectionism jeopardizes carbon neutrality – Decoupling and breakpoints roles of trade openness. Sustainable Production and Consumption, 35, 201–215. https://doi.org/10.1016/j.spc.2022.08.034
- Wang, Q., Zhang, F., & Li, R. (2023). Revisiting the environmental kuznets curve hypothesis in 208 counties: The roles of trade openness, human capital, renewable energy and natural resource rent. Environmental Research, 216(3), 114637. https://doi.org/10.1016/j.envres.2022.114637
- World Atlas, (2023). Maps of Lesotho. https://www.worldatlas.com/maps/lesotho
- World Bank. (2021). Industrialization in Sub-Saharan Africa: Seizing Opportunities in Global Value Chains. https://www.worldbank.org/
- World Bank. (2022a). Lesotho. https://data.worldbank.org/country/lesotho?most_recent_value_desc=true
- World Bank. (2022b). Sub-Saharan Africa. https://data.worldbank.org/region/sub-saharan-africa
- World Bank. (2023a). Arable land (% of land area) – Lesotho. https://data.worldbank.org/indicator/AG.LND.ARBL.ZS?locations=LS
- World Bank. (2023b). Data Bank. https://databank.worldbank.org/metadataglossary/world-development-indicators/series/NV.IND.TOTL.ZS
- World Bank. (2023c). Industry (including construction), value added (% of GDP). https://data.worldbank.org/indicator/NV.IND.TOTL.ZS
- The World Fact Book. (2022). Lesotho. https://www.cia.gov/the-world-factbook/countries/lesotho/.
- Worldwide Governance Indicators, (2022). The Worldwide governance indicators (WGI) project. http://info.worldbank.org/governance/wgi/.
- Yu, J.-S., Hassan, M. K., Mamun, A., & Hassan, A. (2014). Financial sectors reform and economic growth in Morocco: An empirical analysis. Journal of Emerging Market Finance, 13(1), 69–102. https://doi.org/10.1177/0972652714534025
Appendices
Figure A1. Scatter gram of GDP growth and the model residual.
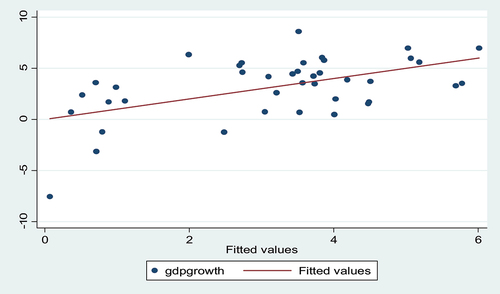
Figure A2. CUSUM graph of the Model.
Figure A3. Line graph of GDP growth and industry value added.