
Abstract
This study examined how social drivers such as culture, tax education, attitude, and equity affect tax compliance behaviour among SMEs in Ghana. Quantitative research approach was adopted for this study. The survey research design was employed for this study, and the data collection instrument was a questionnaire. The sample size of this study comprises of 350 SMEs. The hypotheses were tested with the help of Smart-PLS structural equation modelling version_3. The results revealed that social drivers significantly affect tax compliance behaviour. This study contributes to the body of knowledge, adds to practice and policy by demonstrating that tax compliance has taken on a social dimension in Ghana. While the study has become necessary to improve tax compliance among SMEs, the researcher also seeks to contribute globally to the UN’S sustainable development goals (SDG 10), which aim to reduce inequalities.
1. Introduction
Stimulating economic growth is critical for the development of many nations all over the world. One crucial objective of both developed and developing nations is to raise tax revenue externally and internally to fund their national budgets and undertake massive infrastructural development. This will aid in poverty reduction, unemployment reduction, and improved living standards for their citizens. However, generating the needed revenue has become a major problem for many nations especially developing countries such as Ghana. Tax revenue still remains one of the revenue streams in both developed and developing economies (Saez & Zucman, Citation2019). Tax revenue deficits are now a major problem in the majority of developing countries worldwide (Jun & Yoon, Citation2018). Ghana is not an exempt from this universal trend. The majority of tax administrators struggle to maintain a high level of tax compliance, especially among SMEs. Ghana’s tax revenue is largely underperforming as compared to other countries across the globe. For instance, Ghana’s tax revenue to GDP was 11.34% in 2020 as compared to Denmark and Namibia which have a tax revenue to GDP of 34.06 and 31.16, respectively (World Bank, Citation2020). It might be connected to taxpayers’ culture, fairness of the tax system, attitudes of taxpayers, and compliance behaviour. The planned behaviour theory stressed the significance of sociological and psychological elements, including fairness, culture, and social norms. The planned behaviour theory explains that attitude influences a person’s behaviour. The theory argued that whether or not SMEs will pay their taxes is affected by the projected benefit they are expected to receive from doing so (tax fairness). The planned behaviour theory proposes that a person’s behaviour is affected by several variables, arises for a specific reason, and is planned and coordinated (Akar & Dalgic, Citation2018). Based on the intended outcome, a person would engage in a particular behaviour (Sharif & Naghavi, Citation2021). It is the modified form of the reasoned action theory suggested by Ajzen (Citation1991) to explain why people and corporations behave in a certain way. The planned behaviour theory explains that SME’s behaviours are influenced by various factors, based on certain reasons (KARAMAN & Girgin, Citation2021). The theory supports this current work with its assertion that various factors influence behaviour.
Therefore, it is crucial to have a better knowledge of how SMEs attitudes, fairness perception, culture, and conventions affect tax compliance (Taing & Chang, Citation2021). In Ghana, taxes form the highest source of revenue (Fiscal Strategy Document of Ghana, Citation2020). For instance, the 2021 budget statement of Ghana reported that taxes accounted for over 40% of total revenue accrued (Fiscal Strategy Document of Ghana, Citation2021). Due to the critical role of taxes in economic transformation, government policy recommendations and empirical research emphasize the responsibility of the government in ensuring tax revenue collection. Taxation is the inherent authority of the state to impose and demand payment for public objectives (Yin et al., Citation2016). It is the main mechanism through which governments seek to redistribute nation’s resources to achieve social balance among individuals (Lewis et al., Citation2017). Tax is also defined by James and Alley (Citation2017) as a mandatory payment from the citizens of a country to the government for which no direct benefit is obtained. These benefits of tax revenue motivate governments, particularly in developing countries, to design specific policies to increase tax compliance (Andersen et al., Citation2018).
Tax compliance has several different definitions and measurements as revealed in the extant academic literature. Generally, tax compliance refers to how closely taxpayers (commercial organizations) abide by a jurisdiction’s tax laws. This study used three distinct categories of tax compliance (payment compliance, filing compliance, and reporting compliance) as identified by Okpeyo et al. (Citation2019), and these forms are a good way to measure tax compliance.
The three metrics provide distinct perspectives on the compliance problem, and when placed on top of one another; they provide a full view of total compliance. Scholars from a variety of fields, including management, economics, and commerce, as well as academics, professionals, and government organizations, have substantially explained tax compliance. In administrative terms, tax compliance entails registering or notifying tax authorities of one’s status as a taxpayer, filing an annual tax return (if required), and adhering to the required payment deadlines (James & Alley, Citation2017).
In recent times, tax compliance has received an increasing attention, and researchers both international and local began to look at what make people or taxpayers comply with their tax obligations. Evidence among these researchers are Kuug (Citation2016), Farrar et al. (Citation2020), James and Alley (Citation2017). While several studies such as Naporow (Citation2016), Oppong et al. (Citation2014), Yin et al. (Citation2016) investigated these motivating factors individually, other prior studies looked at these determinants or factors by grouping them into phycological factors, economic factors, institutional factors, social factors, and individual factors (Kuug (Citation2016). Previous research works have found a significant effect of factors of tax compliance and tax compliance behaviour (Ameyaw et al., Citation2016; Kuug, Citation2016; Yin et al., Citation2016) among SMEs in Ghana. Other empirical research, including Oppong (Citation2015) on the Kumasi Metropolis, Naporow (Citation2015) on the Tamale Metropolis, and Otabil (Citation2015) on the Komenda-Edina-Eguafo-Abrem Municipality, established empirical evidence between tax compliance, factors, and tax compliance behaviour. Ameyaw et al. (Citation2016), for example, looked at the factors that influence informal sector compliance. They discovered that attitudes, subjective norm, and perceived behavioural control were the primary drivers of informal sector compliance difficulties, based on 600 respondents from all 10 regions of Ghana. Similarly, Abd Hamida et al. (Citation2020) looked at the factors that impact GrabCar drivers’ tax compliance. A quantitative research technique was used to gather pertinent data for this study, which focused on Grab drivers who have provided the service at least once in Malaysia. According to the conclusions of this study, tax knowledge and attitudes have an influence on driver compliance with tax rules. The findings might indicate that the Malaysian tax authorities should undertake a tax education campaign to improve knowledge of Grab drivers.
Hassan et al. (Citation2016) looked at the impact of tax education programs on taxpayer compliance. From a total of 60 participants, samples were chosen at random. It was discovered that taxpayers make good use of tax education information. Even if there is always space for improvement, encouraging more people to understand and learn about taxes is still a good idea. This also indicates that tax education initiatives are well liked by taxpayers. This study indicates that in order for taxpayers to be more exposed to tax education programs in the future, their positive opinions of programmed tax education must be improved.
The Inasius research (Citation2019) investigated the factors that influence small- and medium-sized enterprises’ compliance with Indonesia’s income tax reporting requirements. Six tax compliance variables were explored using multiple regression. Small company taxes were obtained from 328 respondents in a Jakarta survey. The advisory group, audit probability, tax expertise, and perceptions of justice and fairness all had a significant influence on tax compliance, according to the research. The target group, in particular, has the greatest impact on the behaviour of SMEs who do not follow tax rules.
SMEs constitute a significant portion of businesses worldwide and are noted to play a crucial role in every nation’s economic transformation and development. SMEs generate nearly 80% of all new jobs worldwide (Kengne, Citation2016). In both developed and emerging nations, small- to medium-sized businesses are viewed as a major contributor to economic progress. These SMEs support not just the expansion of a country’s GDP but also the decline in unemployment (Andika & Setyowati, Citation2019). In industrialized economies like the United Kingdom and Germany, small- and medium-sized businesses account for a large portion of all registered businesses (Okwara, Citation2020). Although there is little information on the growth and development trends of SMEs in developing nations, approximately 92% of registered firms in Ghana are small- and medium-sized businesses as per data from the registrar general’s department (Amoah & Amoah, Citation2018). Therefore, this has made the sector a key component of any nation’s development strategy, especially that of emerging nations.
Similarly, the Institute for Statistical Social and Economic Research (ISSER, Citation2020) reported that in Ghana, just 5.45%, 6.12%, and 6.08% of SMEs’ owners pay income taxes to the government in each of the tax years 2015, 2016, and 2017, respectively. Drawing from this, SMEs’ level of compliance could be directly linked to their attitude, culture, fairness perception of the existing tax system in the economy, and their level of education about the tax system which would affect their intention to be tax compliant. Finally, studies on social drivers of tax compliance amzong SMEs remain unclear, mixed, and unexplored. While this study is necessary to improve tax compliance among SMEs, these discoveries might be beneficial to policymakers to establish future tax strategies that enhance compliance. It is from this angle that the study problematizes this research by assessing the influence of social drivers (attitude, culture of taxpayers, tax equity, and taxpayer education) on tax compliance behaviour among SMEs in Ghana.
2. Materials and methods
This study is quantitative and the researchers collected the data using descriptive survey design.
The population consist of all SMEs in the informal sector in five regions located in the northern part of Ghana such as Northern Region, Upper East Region, Upper West, North East, and Savana Region. According to the Ghana Revenue Authority (GRA), small enterprises are those with annual revenues of GHC90,000 or less. The use of turnover and workforce in defining businesses was necessary because this group of businesses (SMEs) contributes largely to the GDP and helps alleviate poverty by offering employment to many citizens.
The rationale for the selection of these regions emanates from the study of Stephen et al. (Citation2015), pointing that micro-entrepreneurs in the northern part of Ghana generally do not want to pay their taxes, which can partly be attributed to equity perception and illiteracy. The northern part of Ghana continues to experience an average domestic shortfall of 5 to 10% annually (2020 Fiscal Strategy Document of Ghana). The Ministry of Finance and Ghana Revenue Authority have revealed the poor performance of the five regions in the north in terms of tax revenue generation. The total population of informal businesses in these regions were 66,835 according to the Integrated Business Establishment Survey-IBES (IBES, Citation2016). Using multi-stage sample technique, the population was divided into three clusters such as Upper East, Upper West, and Northern Region. Simple random sampling technique was further adopted to administer questionnaires. Data of SME owners in the informal sector detailing their locations and addresses were obtained from the National Board for Small-Scale Industry (NBSSI) and Ghana Statistical Service (GSS) to facilitate administration of questionnaires. A sampling size of 500 respondents was used in administering questionnaires. 350 questionnaires were recovered representing 70% recovery rate. According to Krejcie & Morgan (Citation1960), a sample of 382 respondents is adequate for a population of 75,000. Also, Hair et al. (Citation2019) state that sample size of 350 to 500 is appropriate for research works with constructs of at least 5 to 7. This study’s recovery of 350 is appropriate for the population of 66,835
Data retrieved from the questionnaire were analyzed using descriptive and the inferential statistics. Descriptive statistics were used to analyze the demographic characteristics of respondents while the inferential statistics such as structural equation modelling (SEM) using Smart-PLS software was used to analyze the research objective. The researchers ensured that the data were clean and outliers were removed to achieve internal consistency in the findings. Diagnostic tests such as multicollinearity, normality, discriminant validity, and construct reliability and validity were tested and passed in the SEM analysis. The analysis of data using SEM requires some protocols such as ensuring that the factor loadings in each construct are greater than 0.5 (Byrne, Citation2016). Henseler et al. (Citation2009) are of the opinion that the issue of consistency in PLS requires that the deletion of indicators should be done when it can only improve indicators’ reliability. This application will also improve the average variance extracted (AVE) and construct reliability (CR) (Henseler et al., Citation2009). PLS-bootstrapping was conducted to test result’s r-square to determine how the independent variables predict the dependent variables. Falk and Miller (Citation1992) purport that r-square of 15% is moderate and 35% is substantial. To further test for the predictability of the endogenous variable, the Stone-Geisser (Q2) was adopted using blindfolding method in Smart-PLS. For an endogenous variable to have predictive relevance, its Construct Cross-Validated Commonality (CCC) and Construct Cross-Validated Redundancy should be greater than 0 (Hair et al., Citation2021)
2.1. Measurement of variables
The study on the impact of social factors on government tax revenue is conducted using six constructs: Tax payers’ Attitude, Culture of tax payers, Tax Education, Tax Equity, Tax compliance, and Government Tax Revenue.
3. Results and discussion of findings
The data were analysed using descriptive and inferential statistics. Data cleaning was conducted using SPSS software before converted into CSV format for PLS-SEM analysis using Smart-PLS software. Smart-PLS software was used in conducting the structural equation model to analyse the impact of social factors on tax compliance in Ghana. The presentation begins with the demographic characteristics of the respondents of the study.
3.1. Demography of respondents
The demographic characteristics of the respondents reveal that respondents’ gender characteristics such as age, educational qualifications, and the number of years respondents have been into business. Below is the presentation of the demographic characteristics.
Table highlights the demographic characteristics of respondents in the impacts of social factors on tax compliance in Ghana. The table that the study consisted of 220 males (62.9%) and 130 females (37.1%). The number of males outnumbers that of females; however, the percentage of female respondents in the study is able represent the entire population of the study. The age of respondents indicated that 42 respondents (12.0%) were in the age range of 18–29 and 137 respondents (39.1%) were in the range of 30–39 years. Respondents between 40 and 49 age were 90 (25.7%). 58 (16.6%) respondents were between 50 and 59 years; the oldest of respondents (60 and above) were 23 representing 6.6% of the entire respondents in the study. The age distribution hints that majority of the respondents falls within the working force, therefore, have major contribution to make in terms of tax compliance in the country. The educational qualification of respondent shows a seemingly even distribution across the various levels of education. Majority of the respondents with Junior High School/Senior High School and Diploma qualification were 86(24.6%) and 88(25.1%), respectively. At least, all the respondents can read and write since all the respondents have minimum level of literacy. Table also shows number of years respondents have operated their businesses. 61 respondents representing 17.4% have operated for less than 1 year; 78 (22.3%) and 98 (28.0%) have operated their business for 1 to 3 years and 3 to 7 years, respectively. The results revealed that most of the respondents have been in business for 3 to 7 years. This group of respondents should have extent knowledge regarding the area of businesses and should have gain enough experience in dealing with tax issues; hence, their views will improve the reliability of the study.
Table 1. Analysis of respondents
3.2. Measurement result
The result in this section are the measurement results of the questionnaires analysed. The results are statistical results of the latent variables using the various assumption models under Structural Equation Modelling analysis. Below are the presentations of the assumption models and structural models of the study.
Table shows the correlation result of latent variables on the impact of social factors on tax compliance in Ghana. The result reveals that all the latent variables show correlation coefficient values less than 0.998 which is an indication of the absence of perfect correlation among the latent variables. According to Hair et al. (Citation2017) showing correlation coefficient less than 0.998 show no perfect correlation. Therefore, the researcher can emphatically pose that the latent variables of the study do not suffer from multicollinearity.
Table 2. Latent variables correlation
Table shows the result of data normality distribution of the individual indicators used in the study. Skewness reveals how the data of variables are directed (either to the left or right). From the table, the skewness values mostly show negative values within a range. Consequently, according to Tabachnick, Fidell and Ullman who opined that data skewness in the range of −2 to + 2. The various skewness values of the individual indicators in table 4.6 are within the threshold of −2 to + 2. The table also includes the kurtosis value of the individual indicators of the study. Graphically, kurtosis reveals how steep or tall presentation of a particular data is. Data are leptokurtic when it is vertically high while it is mesokurtic when the data are flattened. The result shows that the data are having kurtosis. Byrne and Van de Vijver (Citation2010) stated that data have kurtosis when it falls within −7 to + 7. In sum, the researcher concludes that the data used in the SEM are normally distributed.
Table 3. Normality
3.3. Discriminant validity
Table shows the discriminant validity of the construct used in the study. Discriminant validity reveals how the individual constructs relate against one another. From the result in the table, individual correlation result for all the variables is less than 0.85; hence, the constructs do not lack discriminant validity. According to Kline (Citation2011) who asserts that constructs showing values less than 0.85 pass the discriminant validity test.
Table 4. Fornell Larcker
Table 5. Htmt
Table indicates the results of the factor loading of each indicator, their Cronbach’s Alpha, composite reliability value and the average variance extracted (AVE) values. The Cronbach’s Alpha and the composite values measure the internal consistency of the data while the AVE measures the convergent validity. The result of the Cronbach’s Alpha and the CR shows values greater than 0.70 which means that the constructs in the study have passed the internal consistency test (Sekaran & Bougie, Citation2003). In terms of convergent validity, all the factor loading of the constructs presented are able to explain at least 50% of the indicators’ AVE values. Bagozzi and Yi (Citation1988) and Fornell and Larker (Citation1981) are of the view that an effective convergent validity should have AVE exceeding at least 0.50. With this, we conclude the constructs have convergent validity
Table 6. Construct reliability and validity
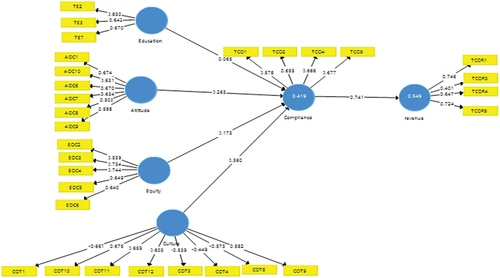
Figure represents the diagrammatic presentation of the constructs on the impact of social factors on tax compliance in Ghana. The figure shows the interconnection between the exogenous variables (Attitude, Equity, and Culture) and the endogenous variable (revenue). Tax compliance mediates the exogenous variable and the endogenous variable. Each factor loading is presented against its latent constructs. All the indicators coded have been hidden to aid proper viewing of results (factor loading shown in the table). From the figure presented, all the indicators under each construct were ensured to have factor loadings greater than 0.5, which is a good indication for the performance of SEM analysis. All the low factor loadings have been deleted.
Figure 1. Structural equation model.
The result of the structural model in Figure and Table shows the relationship between social factors and tax revenue. The Tax payers’ attitude and Tax Revenue show a positive and statistically significant relationship with a coefficient value of 0.194 and p-value of 0.00 which is less than 5%. This direct relationship hints that when tax payers cultivate good attitude towards payment of taxes, government tax revenue is expected to be improved ceteri paribus. The result is significant at 1% since its p-value is less than 0.001. This result is consistent with the work of Jayawardane and Low (Citation2016) who assessed the relationship between tax payer’s attitude and tax compliance. In his work, the researcher advanced that complying with tax leads to increasing the tax revenue of the government. Also, culture of tax payers shows a positive coefficient value of 0.267 and a t-statistic of 4.25 which is greater than 2.58 according to Hair et al. (Citation2017) opine that the value of a construct is statistically significant if it has a value greater than 2.58 at 1% significance level. Culture representing the way of life of a people in a society will positively affect government tax revenue if their believes and values syncs with government revenue policies. It is revealed by Aluko (Citation2003) that the way of life of people can determine government tax revenue. This result is also in line with the work of (Hamid et al., Citation2022; Richardson, Citation2008). This study further contradicts previous findings as evidence in the works of Westerman et al. (Citation2007).
Figure 2. Structural equation model (coefficient & T-Statistics).
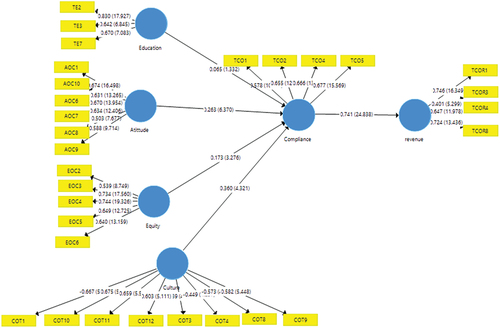
Table 7. Total effect
Tax education also shows a positive relationship with government tax revenue in Ghana. However, the relationship is insignificant since the t-statistic is less than the t-statistics of 1.96 at 5% significance level. The level of Tax education of citizen in a country should aid at increasing tax revenue since citizens are aware of the operations of the tax systems. Other researchers’ findings oppose this view that tax education serves as a tool to avoid tax hence reduce tax revenue (Eriksen & Fallan, Citation1996; Harris, Citation1989; Singh, Citation2003). They argue that once the public has good tax education, they tend to take advantage of the loopholes in the tax laws of the country hence avoiding payment of tax in turn reduces government tax revenue.
The relationship between tax equity and tax revenue is positive and statistically significant with a t-value of 3.43 greater than the benchmark of 2.58 at 1% (Hair et al., Citation2017). This indicates that when tax payers perceive the tax system of the country as equitable and fair, government’s tax net is widened; therefore, tax revenue is increased. This result is also in line with the work of (Jackson & Milliron, Citation1986; Mbilla et al., Citation2018; Wartick, Citation1994).
The researcher assessed the mediating role of tax compliance between the social factors and government tax revenue in Ghana. The result of the total effect (Table ) and the specific indirect effect (Table ) show statistically significant p-values for Tax Payers’ Attitude, Culture of Tax Payers, and Tax equity. This signifies the presence of a partial mediation of tax compliance between tax payers’ attitude and government tax revenue; culture of tax payers and government tax revenue; tax equity and government tax revenue. However, the total effect and the specific indirect results on tax education show statistically insignificant p-values indicating the absence of a mediation role. This means that tax compliance does not mediate the relationship between tax education and government tax revenue. Conclusively, there is a partial mediation of tax compliance between social factors and government tax revenue with the exception of tax education which revealed no mediation role.
Table 8. Specific indirect effect
The absence of the mediation role of tax education on tax compliance and Government tax revenue is as a result of tax literacy among informal sector tax payers. Previous studies have supported that tax payers who have education about tax laws are more likely to file and compute their own tax obligations hence would want to pay as much as possible lower taxes. Harris (Citation1989) also claimed that once the public has good tax education, they tend to take advantage of the loopholes in the tax laws of the country, hence avoiding payment of tax which in turns reduces government tax revenue. Once government is educating tax payers about laws, cautions would have to be taken in order for tax payers not to take advantage of these tax laws.
The result of the r-square presented in Table shows a value of 0.549 for government tax revenue. The coefficient of determination shows that 54.9% of the variations in the dependent variable (Government tax revenue) is determined by the variation in the independent variables (social factors). The r-square in this study shows an acceptable predictive power since Falk and Miller (Citation1992) advance that r-square of 105 is acceptable. Chin (Citation1998) also considers r-square value of 0.33 as moderate.
Table 9 R. Square (endogenous variable)
Table shows the predictive relevance results of the impact of social factors on government tax revenue in Ghana. The Stone-Geisser (Q2) predictive relevance shows the predictability of the endogenous variable through the exogenous variable. The threshold should be greater or larger than 0 (Geisser, Citation1974; Hair et al., Citation2017; Stone,Citation1974). With CCC and CCR values of 0.360 and 0.151, respectively, this shows that the exogenous constructs have predictive relevance over the endogenous construct. These findings show that the social factors adopted in this study have predictive relevance over tax revenue. In other words, if government of Ghana seeks to increase tax revenue, significant attention must be given to the social factors such as tax equity, culture of tax payers, and tax payers’ attitude.
Table 10. Predictive relevance
4. Conclusion
Research on social factors in enhancing tax compliance in Ghana remains unsaturated since social factors are determinants relating to rationale human being. The result of the study revealed that tax compliance played a partial mediation between the independent variables (Tax Payers’ Attitude, Culture of Taxpayers, and Tax equity) as against government tax revenue (dependent variable). The partial mediation of tax compliance on the nexus between tax payers’ attitude and tax revenue indicates that tax compliance mechanisms put in place by government partially induces tax payers’ attitude towards tax payment and, therefore, increases government tax revenue. Mechanisms such as tax filing, penalty on late tax filling, and tax registration partially induce tax payers’ attitude. The culture of tax payers is also partially mediated by tax compliance since tax compliance indicators shape the behaviour and way taxes as a compulsory levy are perceived by tax payers. No mediation has been found on the nexus between tax education and tax revenue. Previous studies have supported that taxpayers who have education about tax laws are more likely to file and compute their own tax obligations hence would want to as much as possible pay lower taxes. Once government is educating taxpayers about tax laws, cautions would have to be taken in order for taxpayers not to take advantage of these tax laws. With partial mediation of tax compliance between tax equity and total revenue, government should be expecting a rise in revenue. This is because when taxpayers perceive fairness in the tax system, compliance mechanisms are easily adhered to and hence increased revenue. This study advanced that taxpayers will be willing to comply and pay their taxes if the benefits from the government commiserate with taxes paid. The result of the study also shows an r-square of 54% and the blindfolding result (CCC and CCR) demonstrates that the findings of the study have predictive relevance. Stakeholders interested in SMEs compliance issues should pay more attention to social drivers of tax compliance such as attitudes, culture of taxpayers, and SMEs equity perceptions.
Disclosure statement
No potential conflict of interest was reported by the author(s).
References
- Abd Hamida, N., Rasitb, Z. A., Ishakc, A. I. B., Abd Hamidd, R. B., Abdullahe, F. A. B., & Sanusif, S. (2020). Determinants of tax compliance among Grabcar in Malaysia. Journal of Advanced Research in Dynamical & Control Systems, 12(3), 316–16. https://doi.org/10.5373/JARDCS/V12I3/20201196
- Ajzen, I. (1991). The theory of planned behavior. Organizational Behavior and Human Decision Processes, 50(2), 179–211. https://doi.org/10.1016/0749-5978(91)90020-T
- Akar, E., & Dalgic, T. (2018). Understanding online consumers’ purchase intentions: A contribution from social network theory. Behaviour & Information Technology, 37(5), 473–487. https://doi.org/10.1080/0144929X.2018.1456563
- Aluko, M. A. O. (2003). The impact of culture on organizational performance in selected textile firms in Nigeria. Nordic Journal of African Studies, 12(2), 16–16.
- Ameyaw, B., Oppong, A., Abruquah, L. A., & Ashalley, E. (2016). Informal sector tax compliance issues and the causality nexus between taxation and economic growth: Empirical evidence from Ghana. Modern Economy, 7(12), 1478–1497. Retrieved from https://doi.org/10.4236/me.2016.712134
- Amoah, S. K. & Amoah, A. K. (2018). The role of small and medium enterprises (SMEs) to employment in Ghana. International Journal of Business and Economics Research, 7(5), 151–157. https://doi.org/10.11648/j.ijber.20180705.14
- Andersen, M. R., Kett, B. R., & von Uexkull, E. (2018). Corporate tax incentives and FDI in developing countries. 2017/2018 Global Investment Competitiveness Report: Foreign Investor Perspectives and Policy Implications, 73–100.
- Andika, D., & Setyowati, M. (2019, September). Tax Administration reform: Impact of taxpayers’ trust and Power of tax authority on taxpayer compliance. Proceedings of the 1st International Symposium on Indonesian Politics, SIP 2019, EAI, Indonesia (pp. 26–27).
- Bagozzi, R. P., & Yi, Y. (1988). On the evaluation of structural equation models. Journal of the Academy of Marketing Science, 16(1), 74–94. https://doi.org/10.1007/BF02723327
- Byrne, B. M. (2016). Adaptation of assessment scales in cross-national research: Issues, guidelines, and caveats. International Perspectives in Psychology, 5(1), 51–65.
- Byrne, B. M., & Van de Vijver, F. J. (2010). Testing for measurement and structural equivalence in large-scale cross-cultural studies: Addressing the issue of non-equivalence. International Journal of Testing, 10(2), 107–132. https://doi.org/10.1080/15305051003637306
- Chin, W. W. (1998). The partial least squares approach to structural equation modeling. Modern Methods for Business Research, (2), 295–336.
- Document, & Fiscal Strategy. (2020). Fiscal Strategy Report Issue.www.ghanabudget.gov.gh
- Document & Fiscal Strategy. (2021). Fiscal strategy report. www.ghanasbudget.gov.gh
- Eriksen, K., & Fallan, L. (1996). Tax knowledge and attitudes towards taxation: A report on a quasi experiment. Journal of Economic Psychology, 17(3), 387–402. https://doi.org/10.1016/0167-4870(96)00015-3
- Falk, R. F., & Miller, N. B. (1992). A primer for soft modeling. University of Akron Press.
- Farrar, J., Massey, D. W., Osecki, E., & Thorne, L. (2020). The Association between Vertical equity and presidential voting behavior and taxpayers’ compliance. Journal of Business Ethics, 172(1), 1–14. https://doi.org/10.1007/s10551-020-04453-0
- Fornell, C., & Larker, D. (1981). Structural equation modeling and regression: Guidelines for research practice. Journal of Marketing Research, 18(1), 39–50. https://doi.org/10.1177/002224378101800104
- Geisser, S. (1974). A predictive approach to the random effect model. Biometrika, 61(1), 101–107.
- Hair, J., Hair, J. F., Hult, G. T. M., Ringle, C. M., & Sarstedt, M. (2021). A primer on partial least squares structural equation modeling (PLS-SEM). Sage publications.
- Hair, J. F., Risher, J. J., Sarstedt, M., & Ringle, C. M. (2019). When to use and how to report the results of PLS-SEM. European Business Review.
- Hair, J. F., Jr., Sarstedt, M., Ringle, C. M., & Gudergan, S. P. (2017). Advanced issues in partial least squares structural equation modeling. Sage publications.
- Hamid, N. A., Ismail, I. S., Yunus, N., Jali, M. N., & Rosly, A. S. (2022). Taxpayer perceptions of tax awareness, tax education, and tax complexity among small and medium enterprises in Malaysia: A quadrant analysis approach. Universal Journal of Accounting and Finance, 10(1), 231–242. https://doi.org/10.13189/ujaf.2022.100124
- Harris, T. D. (1989). The effect of type of tax knowledge on individuals' perceptions of fairness and compliance with the federal income tax system: An empirical study. University of South Carolina.
- Hassan, N., Nawawi, A., & Puteh Salin, A. S. A. (2016). Improving tax compliance via tax education-Malaysian experience. Management and Accounting Review, 15(2), 1–20.
- Henseler, J., Ringle, C. M., & Sinkovics, R. R. (2009). The use of partial least squares path modeling in international marketing. In New challenges to international marketing (Vol. 20, pp. 277–319). Emerald Group Publishing Limited.
- Inasius, F. (2019). Factors influencing SME tax compliance: Evidence from Indonesia. International Journal of Public Administration, 42(5), 367–379. https://doi.org/10.1080/01900692.2018.1464578
- Integrated Business Establishment Survey, 2016. Regional spatial business report. Table A3.5
- ISSER. (2020). Institute of Statistical and Social Research Report.
- Jackson, B., & Milliron, V. C. (1986). Tax compliance research: Findings, problems, and prospects. Journal of Accounting Literature, 5(1), 125–165.
- James, S., & Alley, C. (2017). Tax compliance, self-Assessment and tax Administration. Journal of Finance & Management in Public Services, 2(2), 27–42.
- Jayawardane, D., & Low, K. (2016). Taxpayer attitude and tax compliance decision in Sri Lanka. International Journal of Arts & Commerce, 5(2), 124.
- Jun, B. W., & Yoon, S. M. (2018). Taxpayer’s religiosity, religion, and the perceptions of tax equity: Case of South Korea. Religions, 9(11), 333. https://doi.org/10.3390/rel9110333
- KARAMAN, N., & Girgin, G. K. (2021). An examination of the factors influencing local gastronomic product preference based on the theory of planned behaviour. Balıkesir Üniversitesi Sosyal Bilimler Enstitüsü Dergisi, 24(45), 623–664. https://doi.org/10.31795/baunsobed.857867
- Kengne, B. D. S. (2016). Mixed-gender ownership and financial performance of SMEs in South Africa: A multidisciplinary analysis. International Journal of Gender and Entrepreneurship.
- Kline, R. B. (2011). Principles and practice of structural equation modeling (3. Baskı). Guilford.
- Krejcie, R. V., & Morgan, D. W. (1960). The NEA research bulletin. British Journal of Educational Studies, 38, 99.
- Kuug, S. N. (2016). Factors influencing tax compliance of small and medium enterprises in Ghana. Unpublished master’s thesis, Department of Accounting and Finance, University of Ghana.
- Lewis, A., Carrera, S., Cullis, J., & Jones, P. (2017). Individual, cognitive and cultural differences in tax compliance: UK and Italy compared. Journal of Economic Psychology, 30(3), 431–445. https://doi.org/10.1016/j.joep.2008.11.002
- Mbilla, S. A. E., Gatsi, J. G., Arhin, E. Y., & Ayimpoya, R. N. (2018, August). Drivers of tax compliance among self-employed in Ghana. International Journal of Business, Economics and Law, 16(1), 1–11.
- Naporow, I. Y. (2015). Promoting income compliance among the self-employed in the Tamale Metropolis of Ghana. Unpublished master’s thesis, Department of Accounting and Finance, School of Business, Kwame Nkrumah University of Science and Technology.
- Naporow, I. Y. (2016). Promoting income tax compliance among the self-employed in the tamale metropolis of Ghana ( Doctoral dissertation).
- Okpeyo, E. T., Musah, A., & Gakpetor, E. D. (2019). Determinants of tax compliance in Ghana. Journal of Applied Accounting and Taxation, 4(1), 1–14. https://doi.org/10.30871/jaat.v4i1.935
- Okwara, C. (2020). The relationship between tax transparency, trust, and taxpayers’ voluntary tax compliance in northeast Region. Wilmington University (Delaware).
- Oppong, M., Owiredu, A., & Churchill, R. Q. (2014). Micro and small-Scale enterprises development in Ghana. European Journal of Accounting Auditing & Finance Research, 2(6), 84–97.
- Otabil, E. A. (2015). Taxation of the informal sector in Ghana: A case study of Komenda-Edina-Eguafo-Abrem Municipality. Unpublished bachelor’s thesis, Department of Accounting and Finance, School of Business, College of Arts and Social Science, Kwame Nkrumah University of Science and Technology.
- Richardson, G. (2008). The relationship between culture and tax evasion across countries: Additional evidence and extensions. Journal of International Accounting, Auditing & Taxation, 17(2), 67–78. https://doi.org/10.1016/j.intaccaudtax.2008.07.002
- Saez, E., & Zucman, G. (2019). The triumph of injustice: How the rich dodge taxes and how to make them pay. WW Norton & Company.
- Sekaran, U., & Bougie, R. (2003). Research methods for Business, a skill building approach. John Willey & Sons. Inc.
- Sharif, S. P., & Naghavi, N. (2021). Online financial trading among young adults: Integrating the theory of planned behavior, technology acceptance model, and theory of flow. International Journal of Human–Computer Interaction, 37(10), 949–962. https://doi.org/10.1080/10447318.2020.1861761
- Singh, V. (2003). Malaysian tax administration (6th ed.). Longman.
- Stephen, K. A., Abdallah, M. I., & Hamza, K. (2015). The effect of demographic characteristics of small and medium entrepreneurs on tax compliance in Tamale metropolis, Ghana. International Journal of Economics, Commerce and Management, 1(1), 1–60.
- Stone, M.(1974). Cross‐validatory choice and assessment of statistical predictions. Journal of the Royal Statistical Society: Series B (Methodological), 36(2), 111–133.
- Taing, H. B., & Chang, Y. (2021). Determinants of tax compliance intention: Focus on the theory of planned behavior. International Journal of Public Administration, 44(1), 62–73. https://doi.org/10.1080/01900692.2020.1728313
- Wartick, M. (1994). Legislative justification and the perceived fairness of tax law changes: A reference cognitions theory approach. The Journal of the American Taxation Association, 16(2), 106–123.
- Westerman, J. W. Beekun, R. I. Stedham, Y. & Yamamura, J.(2007). Peers versus national culture: An analysis of antecedents to ethical decision-making. Journal of Business Ethics, 75, 239–252.
- World Bank. (2020). Ghana 4 International Monetary Fund.
- Yin, L., Wemah, S., & Abugre, A. S. (2016). Assessment of tax stamp strategies and income tax compliance among private entrepreneurs in Ghana. International Journal of Innovative Research & Development, 5(13), 78–92.