
 ?Mathematical formulae have been encoded as MathML and are displayed in this HTML version using MathJax in order to improve their display. Uncheck the box to turn MathJax off. This feature requires Javascript. Click on a formula to zoom.
Abstract
Watershed development is part of a poverty reduction and environmental conservation initiative in Ethiopia. The study evaluates the impact of project-supported and community-based watershed development (WSD) interventions on households’ food security status and identifies the factors that affect WSD participants. A propensity score matching (PSM), a household food balance model (HFBM), a geographic information system (GIS), and a Digital Elevation Model (DEM) were employed to analyze data. The PSM model result revealed that participation in a project-supported WSD had a more significant effect on household food security than the community-based WSD. The average treatment effect for the treated (ATT) was 3845.02 Kcal, while the average treatment effect for the control group (ATE) was 3037.85 Kcal, depicting a significant difference between them. Changes in land use and land cover in the study watersheds imply that agricultural and degraded land patterns decreased, whereas grazing land, bushland, wetland, and plantation land patterns have increased in project-supported watersheds over the study period. On one hand, the main socio-economic drivers that positively impacted the food security status of the WSD participation were land size, credit access, livestock ownership, and training. On the other hand, market distance and distance from farmers’ training centers have a significant and negative impact on the status of the households’ food security. The study concludes that project-initiated WSD intervention has a crucial impact on achieving household food security. Priority should be also given to increasing the productivity of land, increasing access to credit services, improving livestock ownership, and providing veterinary services.
PUBLIC INTEREST STATEMENT
Watershed Development (WSD) has been viewed as a starting point for boosting agricultural productivity, achieving food security, and providing sustainable livelihoods. WSD is often considered part of poverty reduction and environmental conservation initiatives in Ethiopia. WSD intervention protects the land against deterioration to reduce eroded and depleted soil fertility, stabilize critical run-off, and sediment-producing areas, improve grassland, woodland, and wildlife, conserve water, and reduce flood. WSD practices have been carried out in Ethiopia as a strategic plan with different approaches. Community-based WSD approach was started in Ethiopia during the implementation of the Growth and Transformation Plan (GTP I) period, and embarked at a national level through the Ministry of Agriculture. Community-based WSD approach has been implemented in the study area along with the project-supported WSD. This study, therefore, investigates the impact of community-based and project-supported WSD on the food security status of farm households.
1. Introduction
Food insecurity and poverty are caused by high levels of land degradation, biodiversity loss, and water scarcity. Land degradation exacerbated by deforestation, enormous loss of topsoil, landslides, siltation of water bodies, and a fall in agricultural land productivity are all regular occurrences in East African countries. All of these have had a significant impact on the environment’s well-being and maintenance of resources in both highlands and lowlands, resulting in food and livelihood insecurity (IWSDE, 2018). In the developing world, smallholders produce most of the food consumed. However, productivity has been slowing down and is generally lagging making a larger gap between the potential yields and the actual smallholder farmers’ yields (Rapsomanikis, Citation2015). Sub-Saharan Africa remains one of the most food-insecure regions of the world where 123 million people at a minimum (around 12 percent of the region’s population) are acutely food insecure, and suffering from high malnutrition (Baptista et al., Citation2022). According to the Global Hunger Index (Citation2023), the rank of Ethiopia out of 125 countries is 101st with a GHI score of 26.2 (i.e. “serious” hunger level). About 24% of the population of the country still live below the national poverty line and about 37% of children under five remain stunted (World Bank, Citation2023). According to empirical research conducted in Ethiopia, significant population pressure on land leads to increased demand for agricultural land, notably the outlying fragmented and steep slopes. Soil erosion, animal feed shortages, firewood scarcity, soil fertility depletion, and land degradation are all consequences of this sort of farming. Similar to this, a review study by Cheber Bezu (Citation2018) on the state of food security in Ethiopia noted that subsistence farming, land degradation, drought, population pressure, insufficient infrastructure, and a lack of off-farm/non-farm activity were the main contributors to food insecurity.
Food security is determined by four interlinked dimensions (Pillars): availability, access, utilization, and stability (FAO, Citation2008; FAO, WFP, and IFAD, Citation2013). 1) Food availability refers to the actual presence of food, which might originate through home production, purchases from the internal market, or imports from elsewhere. 2) Food access refers to the capacity to receive enough food of guaranteed quality and quantity to meet the nutritional needs of all members of a household. 3) Food utilization, on the other hand, refers to the intake and digestion of sufficient and high-quality food for the preservation of good health. This entails optimal biological food utilization, which necessitates a diet rich in energy and necessary nutrients and lastly, 4) Food stability refers to the year-round availability of sufficient food without shortages (Jrad et al., Citation2010). Food insecurity in the Ethiopian highlands is interrelated with reliance on poor agricultural systems, land fragmentation, lack of land tenure security, and vulnerability to natural disasters. Soil and water conservation methods have been encouraged at farm and watershed levels and scaled out across a vast region to reduce soil erosion and its effects. Watershed development is also a method of addressing the complex system dynamics that exist within a given watershed. It allows for comprehensive ecological reimbursements as well as all-encompassing social, economic, and ecological development (Merkineh et al., Citation2018). Assessment of food security and rural livelihood analysis in the Amhara region indicated that 48 of the 105 woredas of the region are drought-prone and suffer from frequent food shortages. Berihun and Ejigu (Citation2018) indicated that the South Gondar zone is one of the most degraded regions in the Amhara regional state where almost 70.7% of households in the Farta woreda (where the study was conducted) are food insecure. Numerous NGOs are still actively working through various intervention programs. The two most prevalent interventions in the research districts were both community-based and project-support Watershed Developments (WSD). The community-based participatory WSD approach was started in the 2009, GTP IFootnote1 period and embarked at the national level through the Ministry of Agriculture (IWDSE, 2018). Project-based watershed development, on the other hand, has also been actively implemented in the study area (South Gondar zone of Farta Woreda) with the support of numerous NGOs and bilateral organizations, such as the Integrated Food Security Program (IFSP), World Food Program (WFP), Sustainable Water Harvesting and Institutional Strengthening in Amhara (SWHISA), German International Cooperation (GIZ) and Tana-Beles watershed development project. Although watershed development intervention is important, there have been problems with implementing the WSD practices as a whole. For instance, there is insufficient community participation, a lack of professional standards, poor links between concerned institutions, poor information sharing between different departments, policy implementation constraints, inappropriate technological preference, and a lack of site-specific conservation plans (Worku Meshesha & Kumar Tripathi, Citation2015).
The study area is situated in the Farta woreda of the south Gondar zone in Ethiopia, which has been actively implementing watershed development practices at micro-watershed levels. Farmers in the study area are primarily focusing on gully rehabilitation using bio-physical structures, waterway construction, area closures, soil and water conservation, fodder production, water harvesting, supporting road construction and maintenance, and watering point development activities. However, the effectiveness of these WSD activities on food security particularly in the adoption of improved crops and forage varieties has not been well addressed. The main objective of the paper is to evaluate whether the project-supported watershed development intervention has a better impact in terms of crop production, biophysical change, land use, and land cover change compared to community-based WSD which determines the household food security of the local community. The study also aims to identify the socioeconomic factors that affect the impact of watershed development interventions. Additionally, it highlights the WSD plan for policy interventions in food security initiatives and offers light on the expanding subject of watershed development interventions in regions with food insecurity.
2. Review of related literature
A watershed is a geographical area that drains to a common point or “sheds” water into a specific waterbody and makes a technological effort to maximize surface and subsurface water for plant growth and crop production while conserving soil. A watershed is also an area with administrative and property boundary land that falls under different property regimes, as well as farmers whose actions may have an impact on one another’s interests (WFP, Citation2021). According to the IWDSE (2018) and Adams et al. (2000), a watershed is made up of both biophysical and socio-economic units, including all natural resources, people, and their socio-economic activities within the boundaries of the drainage divide. The drainage divide can range in size from thousands of square kilometers to a small area that is drained by a freshet.
The history of watershed development interventions in Ethiopia dates back to 1970 (Gebregziabher et al., Citation2016). From that time until the late 1990s, the majority of soil water conservation (SWC) efforts were directed at reducing soil erosion rather than increasing agricultural production. For their involvement in the program, farmers were rewarded with food. A lack of farmer participation in the program, however, caused it to collapse (Habtamu, Citation2011). In the 1980s and 1990s, the government introduced participatory planning as a method for developing watersheds, and in 2005, it implemented watershed development and management as a method for rehabilitating natural resources (Desta et al., Citation2005). Then came the implementation of the watershed development plan, which places a strong emphasis on environmental and poverty-reduction initiatives. The efficient and sustainable use of natural resources can be done by using a community-based watershed (integrated watershed development) (César & Ekbom, Citation2013). In the early 2000s, community-based integrated watershed development was established to support watershed management as a way to achieve more comprehensive integrated natural resource management and livelihood improvement with goals within the then-current agro-ecological and socioeconomic environments (Gebregziabher et al.,). With the use of the watershed approach, planners can coordinate the use of soil, water, and plants in a way that both protects and maximizes the production of these distinct resources.
Shukla (Citation2015) has identified two watershed management approaches: these are an integrated strategy and a consortium approach. A sustainable integrated approach involves integrating technologies within a drainage area’s natural bounds to maximize the growth of its land, water, and plant resources. This is done to meet the fundamental requirements of both people and animals (Singh, Citation2000). The consortium model, on the other hand, is connected to group work and community involvement, encompassing key stakeholders, governmental and non-governmental organizations, and other institutions.
According to Alem-Meta and Singh (Citation2018), watershed management has changed over time and has gone through many stages of development. These include a) forestry and forestry-related hydrology, where community participation was not a concern, and b) resource management, which includes actions aimed at generating economic benefits and beneficiaries. These activities are referred to as “participatory and integrated” watershed management with the local community.
The key challenges to the achievement of watershed management in terms of food security were identified by Gebregziabher et al. (Citation2016). Uncoordinated initiatives, institutions, and players within a watershed; an uneven distribution of the costs and benefits of water management; and a lack of technical advice and information to facilitate the selection of interventions appropriate for the local environment. According to Dabi et al. (Citation2017) and Wolka (Citation2014), many socioeconomic factors influence the watershed development process, including an inadequate land management system, poor governance, ineffective working modalities, weak organizational ties between watershed development organizations, inappropriate use of extension methods, and top-down political management of the process. In addition, there are gaps in the distribution of roles among stakeholders, institutional links between players, and the targeting of the poor (Assefa, Citation2011, Hadush, Citation2015).
Many studies have evaluated the impact of watershed management (development) on food security, and the conclusions are generally positive, though occasionally they are contradictory. Argaw (Citation2022) used structured equation modeling and a livelihood approach to analyze the impact of watershed development and management practices on rural livelihood outcomes. The results showed that by implementing these practices, the community’s agricultural productivity and incomes increased, job opportunities were created, and social services and infrastructure were also improved. However, there is no significant difference between the livelihood status of the treated and untreated watersheds. According to Ethiopia’s Ministry of Agriculture report (Citation2018), large areas of degraded land were restored through area closures and cultivable land was protected with various physical and biological soil and water conservation techniques. When Gebregziabher et al. (Citation2016) analyzed the six watersheds (Oromia, Amhara, and Tigray), the findings showed that watershed management had a positive effect on socioeconomic conditions, livelihoods, crop-livestock productivity, and natural resource conservation. Data show that the average increase in farm incomes and food security due to watershed management has been 50% and 56%, respectively.
Addisu (Citation2023) evaluated participatory watershed management practices and their impact on food security among the rural community in the Chenetaly watershed in Guagusa Shikudad Woreda, Amhara National Regional State. The study’s findings supported the idea that the adoption of watershed management had a significant impact on the local environment. Some of these included a decrease in soil erosion, an increase in agricultural production and soil fertility, a rise in the amount of forest cover and firewood available, and a rise in the quantity of grass and other livestock fodder. Additionally, the watershed management intervention’s improvements in crop and livestock productivity helped to diversify revenue sources, enhance food availability, and improve access to food. In Kenya, Ng’ang’a Mwaura et al. (Citation2021) investigate how community-based water development programs affect rural poverty among small-holder farmers. The study used household survey data from 652 randomly chosen rural homes and employed the full information maximum likelihood endogenous probit regression model to obtain the impact of water user association membership on household poverty status. According to empirical findings, collective water management can improve the well-being of rural households.
Abate et al. (Citation2021) analyzed the quantitative impact analysis of the community-based integrated natural resources management project implemented in Ethiopia’s Lake Tana region between 2011 and 2019. The outcome showed that the program supported off-farm income diversification and offered incentives for youth employment and women’s empowerment. Additionally, it helped increase household incomes and some types of dietary diversity, but only in areas where the project managed greater community participation.
The impact of the integrated watershed management program on food security in the Mai Zeg Zeg watershed of Degua Tembein Woreda was also evaluated by Seyoum Halibo (Citation2010). The findings of the study demonstrate that the watershed-based food security program has had a considerable positive influence on household income, the environment, water coverage, and associated indicators. Tirhas et al. (Citation2021) investigated the status and challenges of integrated watershed management practices after-project phased-out in Eastern Tigray, Ethiopia. According to the evaluation, when the integrated water management project was phased out, physical soil and water conservation structures deteriorated by 47–64%. The key problems were a lack of periodic maintenance and a lack of adequate support from biological conservation efforts. Merkineh et al. (Citation2018) examined and analyzed the community adoption of watershed management practices in Kindo Didaye District, southern Ethiopia. The outcome showed that the community has accepted the watershed management technique because it is important for improving household livelihood, ecological balance, and coping with the effects of climate change.
Shukla (Citation2015), identified the criteria for selecting watershed size. The outcome demonstrated that the watershed depends on the development’s goals and the slope of the land. In simple valley regions where the development of forests or pastures is the primary goal, a big watershed can be used; in hilly regions or where heavy agricultural expansion is anticipated, a relatively small watershed can be used. Reddy et al. (Citation2011) examined the occurrence of potential conflicts that result from production taking place in various places. Pure soil and water conservation efforts upstream give the downstream a twofold benefit by reducing erosion and siltation as well as improving surface water flows and recharging. On the contrary, benefits could further shrink in the upstream areas. Alem-Meta and Singh (Citation2018), found the elements influencing farmers’ participation in watershed management initiatives in the Teleyayen sub-watershed of Ethiopia’s northeastern highlands. As a consequence, farm size had a favorable impact, whereas the slope of the farmland had a negative impact.
3. Materials and methods
3.1. Research area
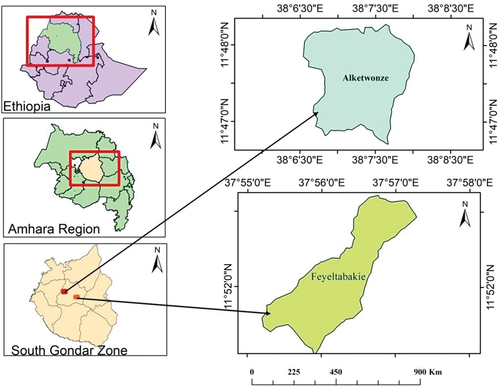
There are six watersheds in the Northern part of Ethiopia, namely, the Ananaye, Abayemer, Mariam wuha, Kuye, Alket Wonze, and Feyele Tebakie watersheds. Among these Alketwonze and Feyele Tebakie, are located in the Farta district (the study area) and are owned by both a project and the community. The watersheds of Alket Wonze and Feyele Tebakie receive 1150 mm and 1050 mm of rain yearly, respectively, with mean daily temperatures of 14 °C and 17 °C. Feyele Tebakie has 216 households (184 male and 32 female heads) while Alket Wonze has 210 households (188 male and 22 female heads) (FWAO, Citation2018). Moreover, the soil types in Feyele Tebakie are red and sandy, whereas those in Alket Wonze WSD are black clay. The native plants include Asta (Erica arborea), Nechi/Guassa (Festuca spp), Kosso (Hagenia abyssinica), Woyira (Olea europaea), Wulkifa (Dombeya torrid), Kega (Rosa abyssinica), Sama (Urtica simensis), Yehabesha Tid (Juniperus procera), kosheshile (Acanthus senii), and Embes (Allophylus abyssinicus).
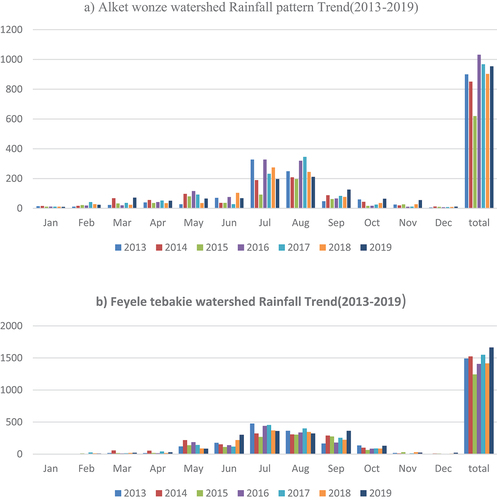
All watersheds have unimodal rainfall, with the majority of the yearly rainfall falling in June, July, and August. Alket Wonze and Feyele Tebakie watersheds receive 1150 mm, and 1050 mm of rain annually. In Alket Wonze, the three-month rainfall ranges from 50 to 72 percent, whereas in Feyele Tebakie, it ranges from 51 to 68 percent. Crop and livestock production are mixed in both watersheds’ farming systems. The watersheds of AlketWonze and Feyele Tebakie are located at (110 47’30“N and 380 7’ 15” E) and (110 52’20“N and 370 56’ 20” E) respectively. The watershed drains 511 and 503 hectares of land. It is 580 kilometers northwest of Addis Ababa, west of the Gunna Mountains. Their elevation varies between 2801 and 2998 meters above sea level, and between 2200 and 2500 meters above sea level (Figure ).
Figure 1. Study area map.
The government office has aided the development of the Aleketwonze watershed, as well as the Tana-Beles natural resource rehabilitation project (a local NGO) and the Feyletebakie watershed site organizational by the Government (Amhara national regional state Bureau of Agriculture). In both cases, the watershed development organizations are directly accountable to the Keble agricultural office, and the government office is in charge of implementing operations in the watershed. These non-governmental organizations (NGOs) seek to assist the government with financial and other capacity-building operations.
3.2. Sampling techniques
Both probabilistic (random sampling) and non-probabilistic (purposive sampling) sampling techniques were applied. The zone and woredas were chosen based on their severity using both purposive and multi-stage sampling procedures. Two of the six watershed sites were chosen at random from nearby community watersheds (one watershed developed by a specific project and the other one developed by the community). The target households in both types of watersheds were then chosen at random (simple random sampling) proportional to the population size (Gupta, Citation1981).
3.3. Data type, source of data, and sampling size
Both qualitative and quantitative types of data were collected from primary and secondary sources. Primary data was collected via a semi-structured questionnaire directly from farm households. The questionnaire includes questions regarding the socioeconomic composition of the household, the inputs, and outputs produced, the adoption and selection of soil and water conservation measures, farmer participation and willingness, power sharing, responsibility, linkage, equity, institutional linkage, and opportunities and constraints in watershed development practices. Secondary data includes Information from the Woreda agriculture office, population data, crop conversion factor, journal articles, and reports used from secondary sources.
The sample size for collecting quantitative and qualitative data for this research was determined by using the Kothari (Citation2004) formula which is expressed as follows.
Where: n=the sample size for a finite population; N= size of the population; p= sample population (or frequency estimated for a sample of size n), where p is 0.5 which is taken for all developing country’s populations and p+q = 1; e: margin of error considered is 6.5 % for this study; Zα/2: normal reduced variable at 0.05 level of significance z is 1.96. According to the above formula, the sample size is:
In each watershed, a total of 138 sample households were chosen from the watersheds (Feyletebakie and Aleketwonze watersheds).
Moreover, DEM 30 m (Digital Elevation Model 30 meter) and ArcGIS 2014 version 10.2.2 were used to determine watershed borders, watershed area coverage, and trend change analysis in farming, forest land, and rangeland pattern alterations. We applied the 2013 Landsat −8 imageries and high-resolution Sentinel −2 images. We used the latest Sentinel-2 images because it has a higher resolution than Landsat-8. The land use and land cover (LULC) classes were mapped using a 2019 picture. The satellite photographs were collected during February and March, when the sky was clear in the region, reducing atmospheric and radiometric impacts. The rainfall status was also estimated using precipitation (rainfall) data from Funk et al. (Citation2015) Scientific Data 2, 150066. cropland, bushland, plantation, wetland, grazing land, and degraded land are the principal applications for the sensors, as well as LULC mapping. All of the pictures were obtained from the Earth Explorer website of the United States Geological Survey. From the sentinel-2A dataset, which contains 13 multispectral bands, only bands 4, 3, and 2 were used (Table ).
Table 1. Description of satellite image data source and collection process
3.4. Data analysis
The data were analyzed using descriptive statistics, parametric and non-parametric tests, propensity score matching, food security measurements, and Arc GIS applied for the study.
3.4.1. Measuring the level of food security
Berihun and Ejigu (Citation2018) conducted a food security study in the Amhara region and outlined the key food security proxy indicators developed by the FAO, World Food Programme, and USAID’s Food and Nutrition Technical Support project that are often used in food security surveys. These include the Household Food Insecurity Access Scale (HFIAS), the Household Dietary Diversity Scale (HDDS), and the Food Consumption Score (FCS); the Months of Adequate Household Food Provisioning (MAHFP), Measurement of Household Food Access, Coping Strategies Index, Household Hunger Scale (HHS), and Household Food Balance (energy availability) model were the most common (Coates et al., Citation2007; Derara & Tolossa, Citation2016; Srivastava et al., Citation2014).
The Household Food Balance Model is one of the techniques used to quantify the food availability dimension (a proxy indicator of food security based on computation techniques). The model calculates the per adult equivalent kcal consumed annually in the household for the family (children who are less than and greater than 18 years of age) using their conversation factors and aggregates the results into food security categories as the outcome variable. The Ethiopian Nutrition and Health Research Institute reports that a daily energy intake for adults in households should be no more than 2100 kcal per AE. The minimum daily needed food energy consumption was chosen as the cutoff point for categorizing households in Ethiopia as either food secure or food insecure (Maxwell & Wiebe, Citation1998; Weldearegay and Dawit Gebremichael Tedla, Citation2018). For this analysis, the Household food balance model was employed.
3.4.2. Analysis of geospatial data for land use and land cover change.
For the processing and/or analysis of data, as well as the development of location and maps of the study region, Arc GIS 10.2.2 software was utilized. For digital image processing of the sets of land sat pictures, Erdas Imagine 15 software was employed. It can be used for image categorization and LULC. To improve image spatial resolution, pan sharpen HPF(High Pass Filter) resolution merge with Band 8-pan chromatic with 15 m spatial resolution was used for layer stacking of bands 1–7, sentinel −2A bands 4,3,2, and pan sharpen HPF(High Pass Filter) resolution merge with Band 8-pan chromatic with 15 m spatial resolution was used for enrichment. Delimiting polygons around representative sites was used to choose training samples by attaching Google Earth to the picture viewer for each of the specified LULC categories. It calculated spectral signatures for the various land cover categories collected by satellite photos using the pixels contained by these polygons. The supervised maximum likelihood method was used to classify LULC after the spectral signature had been properly captured (Cheruto et al., Citation2016; Gashaw et al., Citation2014; Nath et al., Citation2020).
3.4.3. Impact assessment (propensity score matching method)
The propensity score matching method, according to Diaz and Handa (Citation2004), compares the outcome of a treated observation to the outcomes of comparable non-treated observations. The impact evaluation can be done using a variety of matching algorithms to determine the treatment’s effect. The matching algorithms were chosen based on the most critical tests to eliminate bias and inefficiency at the same time. As a result the kernel caliper matching technique was chosen and utilized to determine the influence of watershed participation on household income based on the overall evaluation of these criteria.
3.4.4. Propensity score matching model
The propensity score match can estimate the propensity score using a variety of approaches. Because participation in WSD practices is influenced by observable, unobserved, or both factors. The study employs the probit/logit model. The observation was divided into two groups: the treated group, which received therapy, and the control group, which did not. Treatment D is a binary variable that determines whether or not an observation has received treatment. The treatment observation has D = 1 and the untreated observation has D = 0. The following is the propensity model with D as the dependent variable and X as the independent variable:
The average treatment effect is the difference between the outcome of the treated observation and the control observation (ATE). The purpose of this non-experimental observational study is to assess the average treatment impact by comparing the average treatment effect between WSD users and non-users. Equations (4) and (5) can be used to express this:
The difference between the outcomes of the treated observation if they had not been treated is the average treatment effect on the treated (ATET) which can be expressed below
We can compare the outcomes of the treatment and control groups or observations after matching the propensity scores.
The PSM essentially predicts farmers’ likelihood to employ current watershed development strategies on an individual basis, which is often, assessed using Logit regression as a function of observable farmer attributes, and then matches each user farmer with similar propensities. The following is the logit model for a dichotomous result (yes/no response) (Greene, Citation2003).
Predicted likelihood of the occurrence(farmers’ usage of WSD techniques), with 1 denoting a user and 0 denoting a non-user.
Farmer involvement in the watershed development initiative is predicted to be low or non-user.
4. Result and discussion
4.1. Respondents’socio-economic characteristics
The average age of the studied households was 50 years old which is below the regional average of 69 years (Amhara national data management center for Health, Citation2021). This suggests that the majority of the respondents were experienced farmers and well-informed about the importance of farming and watershed development practices. To participate in watershed activities, the older farmers have experienced skills while executing any regular duty (Table ). The results of the study are in line with those of Mersha (Citation2018), who discovered that most people in the upper Gumara catchment watershed had experience using techniques to conserve soil and water.
Table 2. Socio-economic characteristics of farm households in watershed development practices (fareta districts)
Similarly, the majority of the households (89 percent) were headed by a man, and the majority of the sample farmers (100 percent) worked in agriculture. Particularly in Ethiopia and in other African nations, men predominate over women in positions of patriarchal leadership. This has an impact on resource allocation and decision-making in households. There exists a significant variation in farming between the two watershed sites. A study by Alem-Meta and Singh (Citation2018) explained that watershed development in India is gender insensitive as all the benefits accruing are being cornered exclusively by men.
In comparison to community-supported farm households, the education status of the farm households suggested that project-supported farm households were literate. It was observed that 32.5% of the farmers polled were illiterate; while only 46.3% were literate i.e. projected supported watershed is more literate than community watershed farmers. Habtamu (Citation2011), claims that educated farmers have better watershed management information than those that cannot read or write.
For both WSD, the average livestock, which is expressed in interns of total livestock ownership (TLU), was 5 TLU which is higher than the national average livestock unit of 3.84 (Mekuria et al., Citation2022 cited in Abeje et al., (2019). A tropical livestock unit is equivalent to 250 kilograms of live weight (Endale et al., Citation2014). According to a study by Beyene and Muche (Citation2010), the number of cattle held had a major impact on farmers’ perceptions of watershed practice. There were significant differences in the two watersheds among livestock ownership implying that farmers who have more livestock employ more oxen labor as input for farming and are also able to use cow-dung or crop residue as alternative soil-fertilization and watershed conservation practices.
The average distance to the nearest market for both watersheds was 2.14 km and 6.07 km for project-supported and community-based watersheds, respectively. The difference is highly significant implying that households that are further away from their market are less likely to engage in watershed development initiatives. This is because farmers must travel to the market to purchase agricultural supplies and sell their products if they are closer. The findings are similar to Amanuel et al. (Citation2018) who found that the distance between farmers’ homes and cropland is the most important factor influencing household engagement in watershed development and management. Dufera et al. (Citation2020) also conducted a study on watershed management practices in the Chiracha sub-watershed of Ethiopia. They found that the adoption of soil and water conservation practices is determined by the distance from home to farm plots and the slope of the land (Dufera et al., Citation2020).
According to the study, approximately 79 percent of households received an extension visit within a month, whereas 46 percent of project-supported WSD farmers and 54 percent of community-based WSD farmers received training on soil and watershed development practices in the previous 1 to 3 years. According to a study conducted by Alem-Meta and Singh (Citation2018) in Ethiopia’s northern highlands, farmers’ involvement decisions in the watershed development practice were influenced by gender, extension service, and agricultural labor forces.
Farmers from the two project sites have an average family size of 5.6 individuals which is above the national average (ILO, Citation2021). The average size of the land was one hectare which is close to the national average of 0.96 ha (Headey et al., Citation2014 cited in Mekuria et al., Citation2022). This means the size of farmers’ land positively affects farmers who are engaged in watershed management practices. This implies that farmers who have an adequate amount of farming land are more likely to implement new agricultural technologies and conservation measures in their watershed development. There is a significant difference between the two watersheds in terms of plot size. According to Zarafshani et al. (Citation2008), landholding size is closely associated with farmers’ engagement in WSD.
4.1.1. Biophysical change of the two watersheds
The non-parametric analysis of the two WSD types confirmed that projects supported by WSD (Mean Rank = 46) are less sustainable than the community-based WSD (Mean Rank = 61) and the mean ranking between the two WSD is significant at a 10% probability level (Table ). Similarly, there is a mean rank difference in soil erosion, grazing land carry capacity, river water volume, and wild forest coverage in project-supported WSD compared to Community WSD at different significant levels. The result is in line with the study by Gebregziabher et al. (Citation2016) and Seyoum Halibo (Citation2010), which showed that participants in watershed interventions have improved vegetable coverage, water discharge in streams- downstream of the installed SWC measure, and increased production. Similar results were reported from the Ministry of Agriculture report of Ethiopia (Citation2018), Gebregziabher et al. (), and Merkineh et al. (Citation2018). In contrast to this, a study by Addisu et al. (Citation2013), on watershed evaluation reports in Ethiopia indicated that in terms of sustainability, over 80% of the sample respondents were willing to carry out the project’s interventions even if the project were to end.
Table 3. Status of biophysical trend in the two watersheds (Mann-Whitney test)
4.1.2. Changes in land use and land cover in the watershed
a) Project-supported WSD: According to Table , the land use and land cover change in the Aleketwonze watershed from 2013 to 2019 shows that degraded land dropped by 100% (replaced and used for other farming practices), indicating that there is no degradation at this moment, followed by farmland decrement (12 percent or 7.2 ha). Similarly, the amount of grazing area, bushland, wetland, and plantation has increased by 24%, 35%, 10%, and 8%, respectively. Aside from the extent of change in the matrix table, the land pattern changes were shown, as well as other land pattern types. More croplands in 2013 were converted to grazing land and planting as a result of this input. Overall, the project-supported watershed had a progressive scenario change toward improving land use and land cover change. The study is in line with Gashaw et al. (Citation2017) and Gisha Kuma et al. (Citation2022).
Moreover, the geospatial data, crop and degraded land patterns have decreased, whilst grazing land, bushland, wetland, and plantation land patterns have increased (Figure ).
Figure 2. Precipitation trend in Feyeletebakie and alekt wonze watershed.
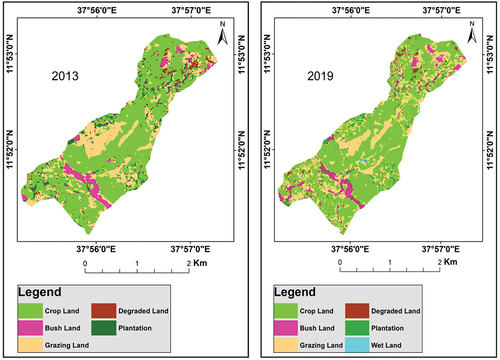
b) Community-based watershed: Similarly, changes in land use and land cover in Feyeletebakie (2013–2019) are depicted in the matrix (Table ). This result revealed the extent to which distinct land-use patterns switch back and forth. As a result, the amount of cropland was reduced by 4%, which helped to reduce soil erosion, while the size of pasture, bush, and plantation lands expanded by 8.2 percent, 4.4 percent, and 4.1 percent, respectively. In 2013, there was no wetland. In 2019, however, 1.6 hectares of land became a wetland. A similar result was reported by Ali Oumer (Citation2009).
Table 4. Project supported WSD(Aleketwonze) land use and land cover change (2013 to 2019)
The changes in the matrix land-use dynamics pattern indicate more of the changes were generated from the matrix itself (crop-to-crop, grazing-to-grazing, and bush-to-bush). However, the increase in plantation land size came from pasture grounds, and more degraded fields were converted to croplands. The development of watersheds has been shown to have a positive impact on the biophysical environment. It contributes to improved micro-climate development as well as improved land cover and land-use change within the specified periods (Table ). The result is also in line with Legesse et al. (Citation2018), which shows that the implemented community-based watershed management intervention resulted in the restoration of biodiversity and improvement of soil fertility.
The Land use and land cover change in the Feyeletebakie watersheds is also depicted (Figure ). The figure shows that farmland patterns have deteriorated slightly while grazing, bush, and plantation lands have remained relatively unchanged. The area’s degraded terrain contributes to a drop in trends. Furthermore, in 2013, there was no wetland, however, in 2019, a small number of wetlands emerged.
Figure 3. Aleketwonze watershed site land cover and land-use change between 2013 and 2019.
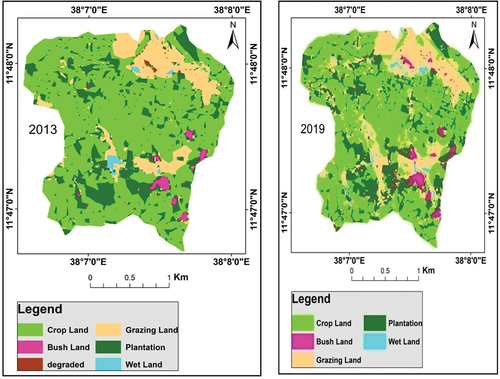
When comparing the two watersheds (Aleketwonze and Feyeletebakie) from 2013 to 2019, Aleketwonze (project-supported WSD) has more improvements than Feyeletebakie (community-based WSD). All degraded lands in Aleketwonze have been rehabilitated and are being used for different purposes and exploited for various land uses; however, 12.35 hectares of land in Feyeletebakie remain bare/degraded. The decrease in cropland and increase in bush and plantation areas in Aleketwonze is greater than the equivalent in Feyeletebakie. All of these factors indicate that the Aleketwonze watershed has made greater progress than the Feyeletebakie watershed, although both watersheds have made significant progress in terms of LULC conditions. The result is inlined with the study by Mintesinot AzeneTaye (Citation2007), Gebre et al. (Citation2013), and Amanuel et al. (Citation2018).
c) Precipitation trend: When comparing the two watersheds, the precipitation (rainfall) trend is increasing in both watersheds, however, the projected support WSD has slightly better rehabilitation compared to community-based WSD. Even in terms of precipitation amount, the project-supported WSD has recorded less amount of precipitation compared to community-based WSD. This implies that better LULC change is associated with the intervention of project-supported WSD management practices (Figure ). Previous research has backed up these good improvements as a result of watershed development; Wani et al. (Citation2010), Nick and Woldehanna (Citation2012), Merkineh et al. (Citation2018), and Getenet (Citation2019).
Figure 4. Feyeletebakie watershed site land cover and land-use change between 2013 and 2019.
4.2. Food security status of the farm households in WSD interventions
4.2.1. Crop production in the WSD.
In the two watersheds, maize, potatoes, wheat, teff, and barley were the principal crops farmed. Farmers in the project-supported watershed were given materials like spades, axes, gabion (coiled iron), tree seedlings (Pom and Gesho), forage varieties like truelecence, Vetber grass, and improved chickens in addition to technical training to support their participatory interventions in the practices of water and soil conservation. In contrast, the farm community administers all resources in community-based watersheds with the aid of woreda agricultural offices.
The effects of fertilizer input usage in the two watersheds were comparable and statistically did not differ significantly. This is because project-supported farmers only receive technical assistance in WSD applications and skills through training and model demonstration at Farmers’ Training Centers (FTCs) and on their farm fields, not assistance with the use of agricultural inputs like fertilizer and seed. The outcome revealed that there are no significant differences in both watersheds in terms of DAP, UREA, and NPSS application. Tewodros et al. (2000) explained that the use of fertilizers in Ethiopia has increased in recent years, despite having one of the lowest rates of application (43 kg of urea and 65 kg of DAP per hectare) when compared.
Since the data did not entirely satisfy the assumption of normality, the Mann-Whitney test was employed to analyze the samples. The results showed that there are significant differences in mean ranking between the two watersheds in the use of improved crop varieties and cow breeds. As a result, the difference in production of barley, maize, teff, and improved cow breeds have been significant (Table ).
Table 5. Community-based WSD (Feyeletebakie) land use and land cover change (2013 to 2019)
4.2.2. Crop production before and after the WSD interventions.
The project intervention outcome revealed that farmers who participated in project-supported watersheds had statistically and significantly higher crop production than their counterpart community-based watersheds. The results of the paired t-test showed that the yields of wheat, potato, barley, maize, teff, and wheat varied significantly before and after the WSD interventions. The mean difference was significant, i.e. 9.6 qt for potatoes, 2.5 qt for barley, 3.1 qt for maize, 1.2 qt for teff, and 1.7 qt. for wheat as a result of the intervention. The study is in line with Gebregziabher et al. (), who suggest that watershed management has a positive impact on crop-livestock production and productivity, natural resource conservation, socioeconomic conditions, and livelihoods (Table ).
Table 6. Inputs and outputs used in the farmers’ farming practices
4.2.3. WSD and food security status of households
In the two watersheds, about 43% of households were food-secured, while the rest (57%) were not. The food security status (measured in kcal) revealed that there are big disparities between the watersheds that are supported by projects and those supported by the community (Table ). The mean differences were found to be 1723.96 KCAL and significant at 1%. The finding shows that farmers sponsored by projects were relatively more food secure than community-based watersheds. The technical support from the projects and extension services on water-saving technology, as well as the provision of materials and improved breeds and forage grass, are the reasons behind this. The result is supported by different authors (Cochrane & Teferi, Citation2017; Laura et al., Citation2012; Mintesinot AzeneTaye, Citation2007; Wani et al., Citation2010).
Table 7. Annual average crop production before and after the WSD interventions (qt/ha)
4.2.4. Watershed development’s impact on food security (PSM-matching)
Food consumption per family is used to determine the food security status of a household. The total adult equivalent (AEU) need of Kcal intake was computed using the conversion factor for each food item in terms of the AEU (Adult equivalent unit) requirement of Kcal intake and measured using kernel width (0.5) matching (Table ).
Table 8. Food security status of households in the two WSD
The average daily gain of kcal per adult in the treatment and control groups were 3845.03 kcal and 3037.85 kcal, respectively with a statistically significant mean difference. WSD’s average treatment effect (ATE) gain was assessed to be 807.17 kcal. This demonstrated that the improvement of watersheds has a major impact on enhancing the food security of households. As a result, the project-supported WSD (Aleketwonze) has made more progress in ensuring household food security than the WSD that is not sponsored by a project (Feyeletebakie). In line with this, Bane et al. (2008) found that land degradation causes falling production, which leads to food insecurity. Sisay and Tesfaye (2003), and Foday and Ndeso (Citation2010), on the other hand, confirm that natural resource restoration entails food security. Similarly, watershed development improvement enhances land productivity, food security, and livelihoods, as well as diversification, farming systems, and natural resource sustainability (Cochrane & Teferi, Citation2017; Merkineh et al., Citation2018; Mintesinot AzeneTaye, Citation2007; Wani et al., Citation2010).
4.3. Impact of WSD on food security of households
For the matching process, the Logit model was used to create propensity scores. For the analysis, a total of 14 hypothesized variables were included. Table , shows the final result. According to the pseudo-R-square, the included explanatory factors account for around 48% of the variation with a statistically significant model. The land size was highly significant and the focus group discussion also confirmed that farmers are more likely to participate in community conservation zones if they own their land. Credit services, livestock ownership (TLU), and training services were also significant in impacting household food security status. The findings revealed that land size, credit, TLU, and training are all likely to significantly and favorably improve the chances of the treated families. The research is in line with Mebratu’s findings (Mebratu & Negera Feyisa, Citation2018).
Table 9. Impact of WSD on the food security status of households (PSM)
Distance to the farmers’ training center (FTC) and distance to the market center, on the other hand, have had a major and negative impact on household food security (Table ). This means that the distance between the farmers’ training center and the market reduces the likelihood of being food secure in the treated families significantly. The findings of this study are consistent with those of other investigations (Alem-Meta & Singh, Citation2018; Beyene & Muche, Citation2010; Mebratu & Negera Feyisa, Citation2018; Sani & Kemaw, Citation2019). On the contrary, it contradicts earlier research on the factors that influence food security such as Foday and Ndeso (Citation2010), and Tengberg and Valencia (Citation2017).
Table 10. Determinants of WSD users on food security Status (kernel Matching)
4.3.1. Current challenges of WSD interventions
The challenges of WSD intervention have been also identified from the survey data. the descriptive result indicates that the main constraints associated with WSD interventions were a lack of awareness about WSD values in the watershed development process (58.3%), weak rules and regulation implementation in the WSD process (94.4%), weak implementation of local WSD administration by law (84.4%), lack of community ownership (52.8%). The main threats were the beneficiaries need immediate benefit(100%), the plan is top-down approach(64,6%), weak implementation of local WSD bylaws (83.3%), weak integration among actors, and lack of responsibility sharing (100%), the work has not immediate benefits for community (66.7%), WSD planning does not take place based on WSD principles (66.7%), less budget (83.3%), no continuous follow up, monitoring and evaluation of WSD (100%), no/less equal distribution of benefits (83.3%), and lack of awareness about WSD benefits (100%). In line with this, the FGD also confirmed that the watershed’s sustainability and repeated violations of the watershed’s laws and the conservation structures like Gully rehabilitation (using biological practices), soil and water conservation practices (terracing, check dams, dam construction, waterway, and area closure) do not survive as long as they should. Furthermore, committee member corruption, poor administrative structure, violations of some farmers to the free grazing rule on protected areas, conflicts among administrative bodies, incompatible watersheds working calendar with farmers calendar, shortage of land (as most of their plots of land area are covered by eucalyptus tree), and the absence of a land use plan in the area (especially tree planting in fertile areas affected the farmers farming system) are all mentioned. Additionally, farmers’ group discussion revealed that the existing watershed farming practice method (as opposed to the community participatory approach) affects farmers’ livelihoods; nevertheless, in the case of project-supported watersheds, sustainability would be a critical concern.
5. Conclusion and recommendations
The study examined the impact of whether a project-supported WSD intervention has a better impact in terms of crop production, biophysical change, land use, and land cover change compared to community-based WSD and identified the main socio-economic factors that affect food security. The results confirmed that farmers who participate in the project-supported watersheds produce more crops than farmers in community-based watersheds. Crops like wheat, potato, barley, maize, and teff, are significantly varied before and after the WSD intervention. The biophysical analysis of the two WSD types also indicated that there is a mean rank difference in soil erosion, grazing land carry capacity, river water volume, and wild forest coverage in a project-supported WSD compared to a community WSD. However, projects supported by WSD are less sustainable than the community-based WSD. Land use and land cover change (LULC) showed that the patterns of crop and degraded land have decreased while those of grazing land, bushland, wetland, and plantation land have increased in project-supported watersheds over a given period. The food security status of WSD interventions across the two watersheds also shows that households in project-supported WSD have been more food secure than community-based WSD. The impact assessment findings as evaluated by the PSM model also demonstrate that farmers’ food security is significantly impacted by watershed development. The main challenges identified in the WSD interventions analysis include lack of awareness about WSD values, weak rules and regulation of implementation in the WSD process, weak implementation of local WSD administration bylaws, lack of community ownership, etc.
It is possible to conclude that WSD project intervention has a crucial impact on achieving food security. Hence, the project-supported watershed development must scale up to further replicate the result in similar areas. Some variables that affect the participation of farmers in WSD should receive due attention. These include increased productivity of land through technology and use of high-value crops, access to credit services, improvement of livestock ownership through feed and nutrition, and provision of veterinary services. It is also important to upgrade market infrastructures like roads, and transport facilities and strengthen farmers’ training centers with contemporary amenities. Additionally, it is crucial to make awareness about long-term WSD values, strengthen the implementation of rules and regulations of WSD, apply local rules and bylaws through government administrative bodies, ensure community ownership through training incentives and rewards, allocate alternative sources of budgets from partner organizations and NGOs, following up the scientific principles of WSD through demonstration and establishing farmers research group to evaluate and monitor WSD, making responsibility (tasks) shared among farmers, DAs and extension experts and other stakeholders. Finally, preparation of the land use plan, arranging the WSD calendar with farmers’ main cropping season, and providing special attention to the sustainability of the WSD development through active monitoring and awareness creation would be recommended to envisage the long-run benefits of WSD rather than the immediate benefits to farmers.
Public statement Astewel et al.docx
Download MS Word (11.7 KB)Biography -Astewel et al.docx
Download MS Word (30.8 KB)Acknowledgments
We highly acknowledge Bahir Dar University for financial support, and developmental agents and respondents who participated in data collection periods.
Disclosure statement
No potential conflict of interest was reported by the author(s).
Supplemental data
Supplemental data for this article can be accessed online at https://doi.org/10.1080/23322039.2023.2288466
Additional information
Notes on contributors

Astewel Takele
Astewel Takele was born in Ethiopia’s Amhara Region, Bahir Dar City. He earned his MSc degree in Agricultural Economics from Haramaya University (formerly Alemaya University) in Ethiopia. He is currently working as a lecturer and researcher in the Department of Agricultural Economics, College of Agriculture and Environmental Sciences at Bahir Dar University. His area of research includes agriculture marketing, production economics, and development studies.
Assefa A. Birhanu
Assefa A. Birhanu is a lecturer and Ph.D. candidate at the Department of Rural Development and Agricultural Extension at Bahir Dar University. He holds an MA in Development and Environment from Addis Ababa University, Ethiopia
Beneberu A. Wondimagegnhu
Beneberu A. Wondimagegnhu is a lead researcher at the Ethiopian Policy Studies Institute. He holds a Ph.D. degree in International Development Studies from the Ruhr University of Bochum, Germany.
Tirusew A. Ebistu
Tirusew A. Ebistu is a lecturer at the faculty of Civil and Water Resource Engineering, at Bahir Dar Institute of Technology, Bahir Dar University, Ethiopia.
Notes
1. GTP (Growth and Transformation Plan) I and II have been implemented in 2010/2011 to 2014/2015 and 2015/2016 to 2019/2020, respectively with the aim of transforming the Ethiopian economy.Citation2011
References
- Abate, G., de Brauw, A., Minot, N., Vos, R., Warner, J., Wassie, S. B., & Yang, S. (2021). Evaluating the impact of multi-intervention development projects. The case of Ethiopia’s community-based integrated natural resources management project. IFPRI Discussion Paper 2069. International Food Policy Research Institute. https://doi.org/10.2499/p15738coll2.134856
- Addisu, D. (2023). The role of participatory watershed management practice to ensure food security: Case study in Chenetaly watershed, Guagusa Shikudad Woreda. Science, 11(3), 51–25. https://doi.org/10.11648/j.sr.20231103.1
- Addisu, S., Goshu, G., Selassie, Y. G., & Tefera, B. (2013). Evaluation of watershed development plan and Technology adoption level of farmers in Amhara region, the case of SWHISA project, Ethiopia. International Journal of Scientific and Research Publications, 3(2), 1–10.
- Alem-Meta, A. A., & Singh, K. N. (2018). Determinants of food insecurity in the rural farm households in South Wollo zone of Ethiopia: The case of the Teleyayen sub-watershed. Agricultural and Food Economics. https://doi.org/10.1186/s40100-018-0106-4
- Ali Oumer, H. (2009). Land use and land cover change, drivers and its impact: A comparative study from Kuhar Michael and Lenche Dima of the Blue Nile and awash basins of Ethiopia. A PhD thesis presented to the faculty of the Graduate school of Cornell University in Partial Fulfillment of the Requirements for the Degree of Master of Professional Studies. Cornell University. https://hdl.handle.net/10568/75689
- Amanuel, B., Abebayehu, A., & Endalkachew, K. (2018). Assessment of community based watershed management practices: Emphasis on technical fitness of physical structures and its effect on soil properties in Lemo district. Environmental Systems Research, 7(20), 1–11. https://doi.org/10.1186/s40068-018-0124-y
- Amhara national data management center for Health. (2021). Burden of disease unit (BoD), national data management center (NDMC) for health. Ethiopia Public Health Institute.
- Argaw, T. (2022). The impact of watershed development and management practices on rural livelihoods outcome: A structural equation modeling study in central highlands of Ethiopia. Addis Ababa University. November 24, 2022.
- Assefa, A. (2011). Community based watershed development for climate change adaptation in choke mountain: The case of upper muga watershed in east gojjam of Ethiopia. Addis Ababa University. http://etd.aau.edu.et/handle/123456789/12305
- Baptista, D. M. S., Farid, M., Fayad, D., Kemoe, L., Lanci, L., Mitra, P., Muehlschlegel, T. S., Okou, C., Spray, J. A., Tuitoek, K., & Unsal, F. D. (2022). Climate change and Chronic food insecurity in sub-Saharan Africa. IMF Departmental Papers. https://www.elibrary.imf.org/view/journals/087/2022/016/article-A001-en.xml?ArticleTabs=abstract
- Berihun, D., & Ejigu, N., (2018). Food security and rural livelihood analysis of the Amhara region, Ethiopia technical report·.
- Beyene, F., & Muche, M. (2010). Determinants of food security among rural households of Central Ethiopia: An empirical analysis. Quarterly Journal of International Agriculture, 49(4), 299–318.
- César, E., & Ekbom, A. (2013). Ethiopia Environmental and climate change. Policy Brief. Sida’s Helpdesk for Environment and Climate Change.
- Cheber Bezu, D. (2018). A review of factors affecting food security situation of Ethiopia: From the perspectives of FAD, economic and political economy theories. International Journal of Agriculture Innovations and Research, 6(6), 336–344. https://ijair.org/administrator/components/com_jresearch/files/publications/IJAIR_2769_FINAL.pdf
- Cheruto, M. C., Kauti, M. K., Kisangau, D. P., & Kariuki, P. C. (2016). Assessment of land use and land cover change using GIS and remote sensing techniques: Acase study of Makueni County. Journal of Remote Sensing & GIS, 5(4). https://doi.org/10.4175/2469-4134.1000175
- Coates, J., Swindale, A., & Bilinsky, P. (2007). Household food insecurity access Scale (HFIAS) for measurement of household food Access: Indicator Guide (3). FHI 360/FANTA.
- Cochrane, L., & Teferi, A. A. (2017). Knowledge gaps, and opportunities for future research on Ethiopian food security and agriculture. Ethiopian Journal of Applied Sciences and Technology, 8(2), 33–41.
- Dabi, N., Fikrie, K., & Mulualem, T. (2017). Soil and water conservation practices, on crop productivity and its economic implication in Ethiopia: A review. Asian Journal of Agricultural Research, 11(4), 128–136. https://doi.org/10.3923/ajar.2017.128.136
- Derara, F., & Tolossa, D. (2016). Household food security situation in Central Oromia, Ethiopia: Acase study from Becho Wereda in Southwest Shewa Zone. Global Journal of HUMAN-SOCIAL SCIENCE: H Interdisciplinary, 16(2). https://globaljournals.org/GJHSS_Volume16/1-Household-Food-Security.pdf
- Desta, L., Carucci, V., Wendem-Agenehu, A., & Abebe, Y. (2005). Community Based Participatory Watershed Development: A Guideline. Ministry of Agriculture and Rural Development, Addis Ababa, Ethiopia.
- Diaz, J. J., & Handa, S. (2004). Propensity score matching as a non-experimental impact estimator: Evidence from Mexico‟s PROGRESA. UNC-CH, Department of Public Policy.
- Dufera, B., Kumar Dube, D., & Aschalew, A. (2020). Socioeconomic impacts, and factors affecting adoption of watershed management practices between the treated and untreated micro-waterheds in the chirachasub watershed of Ethiopia. PJAEE, V.17.
- Endale, Endale, W., Mengesha, Z. B., Atinafu, A., & Adane, A. A. (2014). Food insecurity in Farta district, Northwest Ethiopia: A community based cross–sectional study. BMC Research Notes, 7(1), 130. https://doi.org/10.1186/1756-0500-7-130
- FAO. (2008). Food security information for Action: Practical guides. EC-FAO Food Security Programme.
- FAO, IFAD and WFP. (2013). The State of Food Insecurity in the World 2013: The multiple dimensions of food security. FAO.
- Fareta Woreda Agricultural Office (FWAO). (2018). Farta Woreda Agriculture office annual report,
- Foday, B., & Ndeso, A. A. (Eds.). (2010). Enhancing natural resources management for food security in Africa (review on journal article of climate change implications for agricultural development and natural resources conservation in Africa. Christopher Gordon, AlhajiJallow, Elaine Lawson, Jesse Ayivor and Adelina Mensah). Nature and Faune (pp. 10–16). FAO. https://www.fao.org/3/am071e/am071e.pdf
- Funk, C., Peterson, P., Landsfeld, M., Pedreros, D., Verdin, J., Shukla, Shraddhan, G. H., Shukla, J., Harrison, L., Hoell, A., & Michaelsen, J. (2015). The climate hazards infrared precipitation with stations—a new environmental record for monitoring extremes. Scientific Data, 2(1), 150066. https://doi.org/10.1038/sdata.2015.66
- Gashaw, T., Bantider, A., & Mahari, A. (2014). Evaluations of land use/land cover changes and land degradation in Dera district, Ethiopia: GIS and remote sensing based analysis. International Journal of Scientific Research in Environmental Sciences, 2(6), 199. https://doi.org/10.12983/ijsres-2014-p0199-0208
- Gashaw, T., Tulu, T., Argaw, M., & Worqlul, A. W. (2017). Evaluation and prediction of land use/land cover changes in the andassa watershed, Blue Nile Basin, Ethiopia. Environmental Systems Research, 6(1), 17. https://doi.org/10.1186/s40068-017-0094-5
- Gebregziabher, G., Abera, D. A., Gebresamuel, G., Giordano, M., & Langan, S. (2016). An assessment of integrated watershed management in Ethiopia. (IWMI Working Paper 170) International Water Management Institute (IWMI). 28.
- Gebre, T., Mohammed, Z., Taddesse, M., & SCh, N. (2013). Adoption of structural soil and water conservation technologies by smallholder farmers in AdamaWereda, East Shewa, Ethiopia. Int J AdvStructgeotecheng, 2(2), 58–68.
- Getenet, R. (2019). Assessing the impact and effect of watershed management to rural household food security: A case of rebu watershed, waliso woreda Ethiopia. [MA Thesis] . Addis Ababa University. http://etd.aau.edu.et/handle/123456789/21983
- Gisha Kuma, H., Fufa Feyessa, F., & Adugna Demissie, T. (2022). Land-use/land-cover changes and implications in southern Ethiopia: Evidence from remote sensing and informants. Heliyon, 8(3). https://doi.org/10.1016/j.heliyon.2022.e09071
- Global Hunger Index (GHI). (2023) . Global Hunger Index 2023: Ethiopia. Ethiopia.pdf (globalhungerindex.org).
- Greene. (2003). Econometric analysis (5th ed.). Pearson Education, Inc.
- Gupta, S. C. (1981).Fundamentals of statistics. Himalaya Publishing House.
- Habtamu, T. (2011). Assessment of Sustainable Watershed Management Approach Case Study Lenche Dima, Tsegur Eyesus and Dijjil Watershed. PhD Dissertation, Cornell University,
- Hadush, M. (2015). The role of community based watershed management for climate change AdaptationIn Adwa, Central Tigray zone. International Journal of Weather, Climate Change and Conservation Research, 1(1), 11–35. https://www.eajournals.org/wp-content/uploads/The-role-of-Community-based-watershed-management-for-Climate-Change-Adaptation-in-Adwa-central-Tigray-Zone.pdf
- Headey, D., Dereje, M., & Taffesse, A. (2014). Land constraints and agricultural intensification in Ethiopia: A village-level analysis of high-potential areas fication in Ethiopia: A village-level analysis of high-potential areas. Food Policy, 48, 129–141. https://doi.org/10.1016/j.foodpol.2014.01.008
- International Labour Organization (ILO). (2021). Estimating the needs of workers and their families in Ethiopia. International Labour Office. https://www.ilo.org/wcmsp5/groups/public/---ed_protect/---protrav/---travail/documents/projectdocumentation/wcms_826322.pdf
- Jrad, S, Nahas, B, & Baghasa, H (2010). Food Security Models. Policy Brief No. 33. Syrian Arabic Republic Ministry of Agriculture and Agrarian Reform National Agricultural Policy Center.
- Kothari, C. R. (2004). Quantitative techniques. Vikas Publishing House Pvt. Ltd.
- Laura, G., Jeremias, M., & Chris, O. (2012). Integrated natural resource management: from theory to practice. World Agroforestry. https://www.worldagroforestry.org/publication/integrated-natural-resource-management-theory-practice
- Legesse, A., Bogale, M., & Likisa, D. (2018). Impacts of community based watershed management on land use/cover change at Elemo micro-watershed, Southern Ethiopia. American Journal of Environmental Protection, 6(3), 59–67. https://doi.org/10.12691/env-6-3-2
- Maxwell, D., & Wiebe, K. (1998). Land tenure and food security: A review of concepts, evidence, and methods. Research Paper no.129. https://minds.wisconsin.edu/bitstream/handle/1793/21885/10_rp129.pdf?sequence=1&isAllowed=y
- Mebratu, N. F., & Mebratu Negera Feyisa. (2018). Determinants of food insecurity among rural households of South Western Ethiopia. Journal of Development and Agricultural Economics, 10(12), 404–412. https://doi.org/10.5897/JDAE2018.0999
- Mekuria, W., Dessalegn, M., Amare, D., Belay, B., Getnet, B., Girma, G., & Tegegne, D. (2022). Factors influencing the implementation of agroecological practices: Lessons drawn from the aba-garima watershed, Ethiopia. Frontiers in Environmental Science, 10. https://doi.org/10.3389/fenvs.2022.965408
- Merkineh, M. M., Aklilu, B. M., Efrem, G., & Gashaw, G. (2018). Community adoption of watershed management practices at KindoDidaye district, Southern Ethiopia. International Journal of Environmental Sciences & Natural Resources, 14(2), 555881. https://doi.org/10.19080/IJESNR.2018.14.555881
- Mersha, D. (2018). Perceived impacts of land degradation on livelihood of farming Communities in upper gumara catchment. [MA Thesis]. Addis Ababa University.
- Ministry of Agriculture and Livestock Resources. (2018). Integrated watershed development strategy of Ethiopia. natural resource management Directorate. Addis Ababa.
- Mintesinot AzeneTaye. (2007). Watershed Management: Effects and Problems, the case of Meret Project in Kebelie-Chekorti Sub-Catchment, Kalu Woreda, Amhara Regional State ( master’s thesis). Addis Ababa University,
- Nath, B., Wang, Z., Ge, Y., Islam, K., Singh, P., & Niu, Z. (2020). Land use and land cover change modeling and future potential landscape risk assessment using the Markov-CA model and analytical hierarchy process. ISPRS. International Journal of Geo-Information, 9(2), 134. https://doi.org/10.3390/ijgi9020134
- Ng’ang’a Mwaura, S., Maina Kariuki, I., Kiprop, S., Sammy Muluvi, A., Obare, G. & Kiteme, B., Shafiullah, M. (2021). The impacts of community-based water development projects on rural poverty among small-holder farmers: Evidence from the Ewaso Ng’iro north catchment area, Kenya. Cogent Economics & Finance, 9(1), 1882763. https://doi.org/10.1080/23322039.2021.1882763
- Nick, C., & Woldehanna, T. (2012). Lessons in Linking Sustainability and Development, OECD. OECD iLibrary. https://doi.org/10.1787/dcr-2012-15-en
- Rapsomanikis, G. (2015). The economic lives of smallholder farmers. An analysis based on household data from nine countries ( The economic lives of smallholder farmers (fao.org). FAO.
- Reddy, V. R., Syme, G., Ranjan, R., Paul Pavelic, M. S. R., Kumar Rout, S., & Sreedhar Acharya, N. (2011). Scale issues in meso-watershed development: Farmers' perceptions on designing and implementing the common guidelines. LNRMI Working Paper No. 2.
- Sani, S., & Kemaw, B. (2019). Analysis of households’ food insecurity and its coping mechanisms in Western Ethiopia. Agricultural and Food Economics, 7(1). https://doi.org/10.1186/s40100-019-0124-x
- Seyoum Halibo, S. (2010). Impact of integrated watershed management program on food security: The case of mai zeg zeg watershed in Degua Tembein woreda of north Ethiopia. [MA Thesis]. Mekelle University. https://core.ac.uk/download/pdf/286041007.pdf
- Shukla, H. (2015). Watershed management: Its role in Environmental planning and management. Journal of Environmental Science, Toxicology and Food Technology (IOSR-JESTFT), 1(5), 08–11.
- Singh, R. V. (2000). (Ed.) watershed planning and management. Yash Publishing House.
- Srivastava, S., Singh, B., & Kumar, S. (2014). Food security status and nutritional adequacy in arid part of India: A district level analysis. Journal of Agriculture & Life Sciences, 1(2), 29–38. https://jalsnet.com/journals/Vol_1_No_2_December_2014/4.pdf
- Tengberg, A., & Valencia, S. (2017). Science of integrated approaches to natural resources management a STAP information document. Global Environment Facility.
- Tirhas, G., Teka, K., Taye, G., & Gidey, E. (2021). Status and challenges of integrated watershed management practices after-project phased-out in Eastern Tigray, Ethiopia. Modeling Earth Systems and Environment, 8(1), 1253–1259. https://doi.org/10.1007/s40808-021-01108-5
- Wani, S. P., Wangkahart, T., Yin, D., Zhong, L., & Thang, N. V.(2010). Community watersheds for food security and coping with impacts of climate change in rain‐fed areas. WS3.1 – Climate Change: Watershed Management and Food Security pp 1389-1400. 9th, European IFSA Symposium, 4‐7 July. 2010, Vienna (Austria)
- Weldearegay and Dawit Gebremichael Tedla. (2018). Impact of climate variability on household food availability in Tigray, Ethiopia. Agriculture and Food Security, 7(6). https://doi.org/10.1186/s40066-017-0154-0
- WFP. (2021). Watersheds and the important role they play in improving food security and livelihoods in Malawi. Saving lives and changing lives. World Food Program.
- Wolka, K. (2014). Effect of soil and water conservation measures and challenges for its adoption: Ethiopia in focus. Journal of Environmental Science and Technology, 7(4), 185–199. https://doi.org/10.3923/jest.2014.185.199
- Worku Meshesha, T., & Kumar Tripathi, S. (2015). Watershed management in highlands of Ethiopia: A review.
- World Bank. (2023). Poverty and equity brief. Africa: Eastern and southern.
- Zarafshani, K., Alibaygi, A. H., & Afshar, N. (2008). The Utility of Discriminant analysis for Predicting farmers’ intentions to participate in farmer-Managed Irrigation systems in Iran. Journal of Applied Sciences, 8(4), 697–701. https://doi.org/10.3923/jas.2008.697.701