
 ?Mathematical formulae have been encoded as MathML and are displayed in this HTML version using MathJax in order to improve their display. Uncheck the box to turn MathJax off. This feature requires Javascript. Click on a formula to zoom.
Abstract
The primary goal of this research is to examine the impact of external debt, exchange rates, economic growth inflation and tax revenue on foreign direct investment (FDI) in the Next-11 (N-11) countries where tax revenue used as a control variable. FDI plays an important role in boosting economic growth in developing countries such as the N-11. This study applied secondary data from 1993 to 2020. The panel unit root test has several criteria to make a decision on the unit root of the selected factors. This study considers the PMG panel ARDL model in the case of mixed orders. The exchange rate affects FDI negatively in the short run but positively in the long run, according to the findings of this study, the coefficient of variable external debt has a positive coefficient and result explains that a one percent raise in external debt tends to raise FDI by 0.46 percent in the long run but the result is not statistically significant. Economic growth has a positive impact on FDI over the long run and inflation has negative impact in the long run. By using the Kao cointegration test, a long-run association was found, and the ECT between the variables and the rate of adjustment was 27%. However, this study has the potential to have an impact on economic areas like global trade, global economics, public finance, and foreign direct investment decision-making.
Impact statement
This study has significant impact on academic field, accelerating foreign direct investment, international trade. This research also contributes to national and international policy level to increase the foreign direct investment.
REVIEWING EDITOR:
1. Introduction
Investment is an important feature of any economy because it activates adequate demand determinants, which ultimately raises the economic growth of the country. Foreign direct investment (FDI) is a national financial component of a country that refers to foreign investors’ investment in the domestic country (Bilawal et al., Citation2014). FDI plays a vital role in enhancing a country’s economy. It helps upgrade social and financial circumstances by raising the monetary development rate, expanding practical limits, and enhancing economic events (Louail & Zouita, Citation2021). FDI includes the ‘investment of assets into domestic equipment, structures, and organizations, but it does not include the investment of foreign assets in the stock market’. The definition of FDI indicates the capital movement that implies controlling the owner and country, which is important for the economic growth of the home country, and the main sources and factors of globalization of the world economy. Problem statement of this study state that, it is examined that flows of FDI help to build strong economic relationships between developing and industrialized countries (Bilawal et al., Citation2014). FDI is an important component of the enormous private investments that navigate world economic growth. FDI comes with many economic interests such as capital, foreign exchange, competition, technology, and enormous access to the global market. Over the last 20 years, the pattern of foreign direct investment has changed from a developed country to a rising country in the world (Paul et al., Citation2021). The presence of foreign investors in a host country is contingent upon the expectation of financial gain, despite the existence of several dangers, including political, legal, currency rate, external debt, and the tax revenue rate of the invested country (Sultanuzzaman et al., Citation2018). Foreign investors exhibit a keen interest in allocating their funds if the host nation can establish a conducive business environment, facilitate the creation of secure investments, reduce tax burdens, stabilize exchange rates, and minimize economic indebtedness (Haque et al., Citation2022).
A few studies (e.g. Ang, Citation2008; Liu, Citation2010; Majumder & Rahman, Citation2020; Shapiro & Globerman, Citation2003) find that country trade rates assume a basic stochastic part of the time spent on FDI inflows. Exchange rate volatility affects each critical part of the economy, including worldwide exchange viability, accumulated results, expansion, and FDI in the host country. The connection between FDI and trade rates has provoked curiosity among market analysts, scientists, and policymakers for several years. Since the immediate and roundabout effect of FDI inflows on the host economy is self-evident, FDI nations have endeavored to maintain an ideal macroeconomic climate, most strikingly, a steady conversion standard. Osinubi (Citation2002) finds a positive connection between FDI inflow and conversion scale development. Nonetheless, the charge assortment system is critical for attracting monetary support in a country (Gresik, Citation2001; De Mooij & Ederveen, Citation2003). Perhaps the most recognizable impediment to the cross-limit hypothesis is the two-fold expense evaluation of unfamiliarly obtained pay. A twofold duty assortment arises if the comparative cost base (e.g. pay or wealth) of a specific resident (i.e. an individual or undertaking) is troubled in no less than two wards. Two-sided charge deals, addressing common settlements on the meaning of expense liabilities, the task of burdening privileges, or the assurance of keeping charge rates, are the main methods for avoiding two-fold tax assessment from endeavors. External debt has a direct effect on FDI. However, it has two phases: the first is for the short term and the second is for the long term. The government takes money as a loan from external sources and invests it in several public projects. When the government invests in many public projects, it creates a demanding situation that looks attractive to invest in. Consequently, foreign investors are attracted to and invest in the country. However, in the long term, this creates problems. High debt services hamper the flow of resources needed for economic development. This limits capital expenditure, which can discourage foreign investors from investing. The high interest rate in external debt discourages foreign investment investors and reduces the flow of foreign investment (Shiyalini & Suresh, Citation2022).
In 2005, Goldman Sachs introduced a new country group named Next-11 (N-11). These Next-11 countries have a common feature: they all have a large population. The next 11 countries are Iran, Nigeria, Turkey, Egypt, Bangladesh, Indonesia, South Korea, Pakistan, Philippines, Vietnam, and Mexico. These countries have a huge market, which can be very impactful for future changes in world order. As countries are emerging markets in the world order, it is important to examine their foreign direct investment (Aslan et al., Citation2021). The next 11 countries are on the right track to become economic giants in the 21st century. N-11 countries change their economic policies to improve their financial condition so that N-11 countries can reach an advanced level of economics. N-11 countries are diversifying their income sources so that their economic growth can improve. Mainly focuses on agriculture, tourism, and industrialization. This sector helps upgrade foreign direct investment in a country, and these countries are helping to grab FDI in the long run (Louail & Zouita, Citation2021). Next-11 countries have a greater inherent potential for development and return on investment. This is why these countries have become preferable objects for investment. Through FDI, N-11 countries find foreign money, capital formation, resources, technology, innovation, production transfer, knowledge, skills, and management techniques. In N-11 countries, the well-being of foreign direct investment is well acknowledged. FDI has been beneficial for increasing economic growth and other factors in these countries. For this reason, the foreign direct investment market becomes much more competitive among N-11 countries. These countries compete with one another to collect more foreign direct investment in their own countries, and adopt myriad promotional policies to attract FDI into their countries. At the same time, these states have established special economic zones, offering incentives and liberalizing trade regimes (Jahan & Paul, Citation2021).
However, the prime objective of this study is to investigate the impact of external debt, exchange rates, and tax revenue on FDI in N-11 countries. There are some other specific objectives: a) to examine the linkage between exchange rate and FDI in N-11 countries, b) to determine the inter-linkage between external debt and FDI in N-11 countries, and c) to test the interrelationship between tax revenue and FDI in N-11 countries. This study contributes significantly to the comprehension of economic dynamics in N-11 countries. This study employs comprehensive PMG-ARDL panel data analysis to examine the complex connections among external debt, exchange rates, tax income, and foreign direct investment (FDI). Through this investigation, this study presents new and valuable insights that have both theoretical and practical significance. This study makes a noteworthy contribution by utilizing the PMG-ARDL panel data analysis method, which enables a thorough investigation of the long-term connections and immediate changes between the variables under scrutiny. Furthermore, the study aims to fill a significant void in the existing body of knowledge by specifically examining N-11 countries. Although there is existing research on the determinants of foreign direct investment (FDI), it is important to pay special attention to N-11 countries. These countries are a diverse group of emerging economies with unique characteristics. This study examines the influence of external debt, exchange rates, and tax revenue on foreign direct investment (FDI) within a specific group. It offers customized insights that enhance our understanding of the investment dynamics in various economic environments. Another significant contribution of this study is the incorporation of foreign debt as a variable of interest. The economic literature has expressed concern about external debt, but there has been limited exploration of its relationship with foreign direct investment (FDI), especially in the context of N-11 countries. In addition, this study’s inclusion of exchange rates and tax income as factors influencing FDI enhances the complexity of the analysis. The link between these economic determinants and their influence on FDI is subject to complicated interplay.
This study contributes to the existing literature by offering empirical information on the nature of these relationships, specifically within N-11 countries. These research findings have practical importance for policymakers, investors, and other stakeholders in N-11 countries. The findings of this study can provide valuable information for shaping economic policies and investment plans, which can contribute to creating a favorable climate for attracting foreign investment, effectively managing external debt, and optimizing tax structures. This study makes a substantial contribution to the academic understanding of the factors that influence foreign direct investment (FDI) in N-11 countries. Its rigorous methodology, specific focus on a unique set of developing economies, and examination of the effects of foreign debt, currency rates, and tax income make a noteworthy contribution to the existing body of research on international economics and investment dynamics. The findings possess the capability to influence policy decisions and investment plans, promoting sustainable economic development in N-11 countries.
2. Literature review
According to Chettri et al. (Citation2022), risk aversion and production flexibility are arguments in which flexibility arguments show that there is a direct relationship between exchange rates (EXR) and FDI, and risk aversion arguments show that there is a negative relationship between these variables. The researchers also investigate whether FDI is a cause of the appreciation of the EXR, with inputs or outputs dampened in the host country. Mwakabungu and Kauangal (Citation2023) explained that there is a link between FDI and economic growth by considering other variables, such as the volatility of the exchange rate in Tanzania. Buthelezi (Citation2023) found that if investment actions are reasonably low, then there is a weak relationship between investment and EXR, but if the movements are comparatively high or excessive, then there is a strong relationship. In Nigeria, there is a negative link between FDI and EXR risk (Adewale & Comfort, Citation2022). It has also been found that the volatility of EXR has a negative effect on FDI flow of FDI (Bénassy-Quéré et al., Citation2001). The tax policy affects the location and volume of FDI because a higher tax reduces the after-tax return. Tax policy is one of the significant factors in the decision-making process of multinational for foreign direct investment based on this perception. Majumder et al. (Citation2022) reported that higher duty and inside obligations prompt a decrease in FDI, implying that expenses and inward obligations have a negative connection through FDI inflows. Clements and Nguyen (Citation2003) argue that outer obligation adjustment adversely affects monetary development and FDI because it extends financial plan deficiencies. Investors are putting resources into a country with an enormous inner obligation on the grounds that some of their returns will be utilized to support the obligation through high tax collection. Again, the hypothesis holds that bringing down obligation commitments increases both domestic investment and FDI, reducing the probability of obligation default (Onifade et al., Citation2020).
Dhakal et al. (Citation2010) tried to inspect the impact of EXV on FDI by using panel data from some Asian countries, such as ‘Indonesia, the Philippines, South Korea, etc.’. These countries receive a high amount of FDI, but on the other hand, also face EXV. The results explain the positive effect of EXV on FDI in these countries. Pradhan (Citation2011) attempted to identify the factors influencing FDI in SAARC countries. The author applied the panel Vector Autoregressive (VAR) model to obtain results and investigate FDI in seven SAARC countries from 1980 to 2010. The author identified that FDI is mainly guided by several factors such as EXR, inflation, economic growth, labor population, long-term debt, and trade balance. Chaudhary et al. (Citation2012) attempted to determine the relationship between EXV and FDI. The authors selected Asian countries such as Bangladesh, Iran, South Korea, and Turkey. The results show a mixed trend in EXV and FDI. However, in 50% of the sample countries, there was no relationship between EXR volatility and FDI. Senibi et al. (Citation2017) use the ‘Structural Vector Autoregressive Framework (SVAR) to examine the relation between public debt, domestic investment, and FDI in Nigeria from the time period of 1981–2015’. The results showed that as the exchange rate depreciated, internal investment fell regularly. However, FDI receives a high response from the interest rate. High inflation in Nigeria reduces foreign investors’ expectations; consequently, it reduces the flow of FDI in Nigeria. Finally, we provide recommendations for increasing FDI flow. Qamruzzaman et al. (Citation2019) research the two-sided relationship between FDI and the conversion scale. The review was based on Bangladeshi financial aspects. The study utilized nonlinear ARDL examination to obtain the best result. The outcomes show the drawn-out relationships between the conversion standard, FDI, financial strategy, and monetary arrangement. Saw that in the long haul, the enthusiasm for swapping scales against the US dollar has a terrible effect on unfamiliar direct contributions and, subsequently, the progression of FDI decline. Ahmed et al. (Citation2020) explore the impact of global exchange and charges on the current equilibrium of the installments of nations, which are called the N-11 nations. The authors used data from 1990 to 2016, utilizing co-reconciliation tests and others. One of the discoveries was that the current record balance relies on various monetary determinants, such as swapping scale, amount and cost of imports, and terms of exchange. Fadl and Ghoneim (Citation2020) note the connection between FDI and swapping scales in Egypt. That is what the assessment showed in the event that inner money deteriorates the level of FDI increases. Conversion scale affects FDI. Jahan and Paul (Citation2021) examined board information to assess the determinants of the main considerations that increase FDI in N-11 nations. Exchange transparency, market size, normal asset accessibility, foundation offices, and monetary soundness are the primary spotlights of this exploration and show that infrastructure facilities do not play a key role in FDI inflows, whereas other factors play key factors of FDI. Louail and Zouita (Citation2021) attempted to determine the ‘relationship between FDI, financial development, and economic growth in N-11 countries and collected data from 1985 to 2019 from the next 11 countries’. Authors have done the study by using the ‘pooled mean group’ estimation method and the ARDL approach, and the results show that financial development and economic growth have an impact on FDI.
However, Young (Citation1988) analyzed the impact of internal taxes and return rates on FDI in the United States, and the results show that FDI that comes through retained earnings is more flexible with return rates and tax rates. On the other hand, FDI through new funds is not flexible with tax rates and return rates. This study shows that tax incentives raise FDI, but after the tax reform of 1986, the rate of FDI in the USA decreased. Desai et al. (Citation2004) observed the impact of indirect taxes on foreign direct investment. The authors used data from multinational American firms. The results show that high corporate income tax discourages investment ratios and profit rates, but high indirect tax rates do not depress them. Fahmi (Citation2012) examines the effect of tax holidays on FDI. Indonesia is a targeted economic country and uses the ordinary least squares regression technique, where tax holidays are independent variables, and FDI is a dependent variable. He found that inflation, capital formation, and openness have activist rapport with FDI, while the tax rate reverses with FDI. However, the main focus of the tax holiday has no impact on FDI inflows. Fahmi believes that this happened because there are some other problems in Indonesia that cannot be hidden under the tax holiday. Mahmood and Chaudhary (Citation2013) investigate the effect of FDI on tax revenue. This study used Pakistan as a sample country. In this study, tax revenue was the dependent variable. FDI and GDP were taken as independent variables. The outcome shows two types of relationships: short- and long-term. Tax revenue had a helpful and outstanding impact from gross domestic product and FDI and also showed that FDI helps to earn more tax revenue for the government. Aslam (2015) shows that tax revenue contributed about 77% to FDI in those years. FDI and tax revenue maintain a long-term positive link between the sample time periods. This study shows that tax revenue can be increasingly generated if FDI comes to the country. Odabas (Citation2016) researched the impact of FDI inflows on charge income using data from 1996 to 2012 from different European Association nations. The review showed that charge income had unidirectional causality from FDI. There was also unidirectional causality from FDI to financial development. Balıkçıoğlu et al. (Citation2016) examine the cause of FDI on charge income in Turkey, examine the information of assembling firms from 2004 to 2012, and find an incredible effect of FDI on charge income for firms with higher innovation. Medium- or low-innovation firms are minimally different from high-innovation ones. Etim et al. (Citation2019) analyze the effect of expense strategy motivations on FDI in Nigeria. This review examines the information on cost-based and benefit-based charge strategy impetuses from 1999 to 2017 on FDI and relapse procedures. The results showed that benefit-based charge strategy motivators did not have a more grounded impact than cost-based arrangement impetuses. But the main fact is that both ‘cost-based tax policy and profit-based tax policy’ incentives don’t have a significant relationship with FDI.
Based on a review of the literature, this study develops a conceptual framework for FDI and other factors that can explain the correlation between external debt, exchange rates, and tax revenue with FDI, as shown in .
Figure 1. Framework of FDI determination.
Source: Author’s estimation.
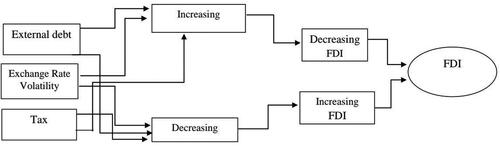
shows that the framework of increasing external debt, exchange rate, and tax revenue discourages foreign investors from FDI, decreasing the level of external debt, exchange rate, and tax revenue, which attracts foreign investors to FDI. Moreover, this study contributes to new methods and policy accumulation for stakeholders. An important factor that should be considered is the influence of political stability and the quality of governance in attracting foreign direct investment (FDI). Political instability, corruption, and poor institutional frameworks are common challenges that emerging nations frequently encounter. These factors can discourage international investors. Gaining insight into the interplay between these elements and external debt and currency rates could offer a more holistic understanding of the dynamics of foreign direct investment (FDI). The study could further investigate the influence of regulatory frameworks and investment incentives on foreign direct investment (FDI). Government policies, such as tax incentives, designated economic areas, and safeguards for investments, are crucial in enticing international investors. An analysis of the correlation between these policies and external debt and currency rates could provide significant insights into the decision-making processes of multinational firms. It would be advantageous for the study to investigate how market size and customer demographics affect the influx of foreign direct investment (FDI). Companies are generally drawn to emerging markets that have big and expanding consumer populations, as they aim to access new markets and increase their client base. This often leads to a substantial inflow of foreign direct investment (FDI). Examining the relationship between market characteristics, external debt, and currency rates may reveal additional factors influencing foreign direct investment (FDI). This study offers vital insights into the correlation between external debt, currency rates, and foreign direct investment (FDI). However, there is still a lack in the existing literature when it comes to investigating other significant factors that could enhance our comprehension of FDI patterns in emerging nations. By addressing these gaps, we may enhance our understanding of the various factors that influence foreign direct investment (FDI) flows. This knowledge can then be used by policymakers and investors to make better informed decisions. This study is the key initiative in analyzing the impact of external debt, exchange rate, and tax revenue on FDI in N-11 countries. This study attempts to minimize the existing gap through the use of new variables, and the empirical findings have policy implications for the selected panel as well as the academic field.
3. Methodology
3.1. Data and variable
The study used panel data for 11 countries from 1993 to 2020, all variables (i.e. external debt, exchange rate, tax revenue, and FDI) to investigate the influences of external debt, exchange rate, and tax revenue on FDI, where tax revenue, economic growth and inflation were used as control and independent variable, used as a control variable and external debt and exchange rate were used as independent variables. Data were collected from the World Development Indicators (WDI) as a reliable and better source of secondary data, and the central bank of each country also provided reliable data for this study. Owing to the unavailability of data, this study omitted three countries: South Korea, Vietnam, and Egypt. The data on FDI follows the guidelines of Busse and Hefeker (Citation2007) and is extracted as ‘foreign direct investment, net inflows (BoP, current US$), exchange rate determined by the official exchange rate (LCU per US$, period average),’ external debt defined by external debt stocks, total (DOD, current US$), and tax revenue defined by tax revenue (current LCU), economic growth defined by GDP growth (annual %) and inflation defined by inflation, consumer prices (annual %). In EquationEquation (1)(1)
(1) , the model specification is shown in a functional form; in EquationEquations (2)
(2)
(2) and Equation(3)
(3)
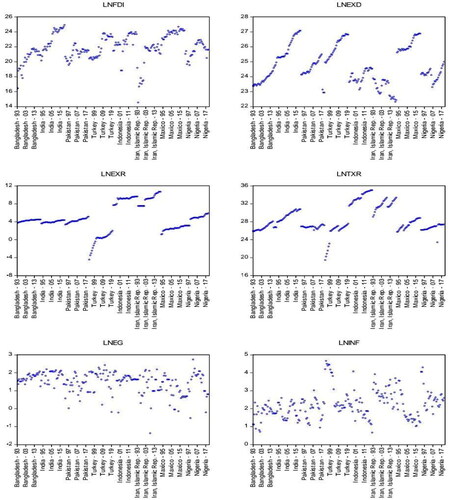
(3) , for the econometric model with log transformation and an absolute value, log has been taken to avoid any complexity of the estimated coefficient as well as other econometric measures. he reason behind the selection of N-11 countries is this panel group has efficient economic growth, has substantial emerging progress in socio economic development and large volume of production and huge opportunity of FDI. However, has been presented the trend of the data set by considering variables and cross section unit.
Figure 2. Representation of data.
Source: Authors estimation.
3.2. Model specification
FDI = F (Exchange Rate (EXR), External Debt (ExD), Tax Revenue (TxR) Economic Growth (EG), Inflation (InF))
(1)
(1)
(2)
(2)
(3)
(3)
where β0 is intercept term, β1 to β5 represents coefficients and ϵit is residual with consideing time and crosssection unit.
3.3. Empirical methodology
3.3.1. Panel unit root test
The CIPS (cross sectional Im, Pesaran and Shin) technique is utilized in the panel unit root test. EquationEquation (4)(4)
(4) presents a typical estimation procedure for the panel unit root. The alternative hypothesis ‘H1 is that there is a stationary is series (no unit root), while the estimated null hypothesis H0 is that there is no stationary is data series (have unit root) where the unit root has taken the assumption as
= 0 for all i’.
(4)
(4)
3.3.2. Cross sectional dependency (CSD) test and cointegration test
A CSD test is crucial for choosing between a first-generation panel and second-generation panel analysis. Pesaran’s CD test is the most commonly used approach to CSD testing. Pesaran’s CD test considers the LM test in this process, where is the simple estimation of the correlation of residuals with H0 such as no CSD.
(5)
(5)
The cointegration test states that the residual term defined by presents the parameter. Kao (Citation1999) suggests a cointegration system with respect to the ADF test, and the assessment follows EquationEquation (7)
(7)
(7) . The ‘parameter of α and the leftover term is uncorrelated, the speculation to pursue choice for cointegration is that way, H0: No cointegration among the variables’. Regardless, this study expected to dismiss invalid speculation while tolerating H1.
(6)
(6)
(7)
(7)
3.4. PMG panel ARDL
The best method for evaluating outcomes is ARDL, when the data series are stationary in a mixed order. Usefulness of ARDL model state that while the other variables are stationary at the first difference I(1), certain variables are stationary at level I(0). The current study uses the panel PMG-ARDL econometric approach to carry out its objectives. The ARDL method was based on the research of Osabohien et al., He et al. (Citation2019), and Arshad et al. (Citation2020). The ARDL PMG's prevalence ‘stems from its ability to assess both the short- and long-run sway and the cross-sectional short-run of the logical factors on the ward (Alola et al., Citation2019)’. The model’s (PMG ARDL) capability for examining a mixed order of dataset reconciliation, that is, ‘when datasets can be I (0), I (1), or a combination of both, is just one of its numerous benefits’. The dataset is ‘I (0), and some parts are stationary at I (1),’ according to the stationarity tests conducted in the current environment (Ibrahim & Alola, Citation2020). This finding supports the PMG panel ARDL technique. Pesaran et al. (Citation1999) were the first to apply this technique. The PMGARDL model is shown in EquationEquation (8)(8)
(8) .
(8)
(8)
where Δ is the first contrast term;
is the mistake term; and ‘β1, β2, β3, β4, β5, and β6’ impart to the ‘long-run coefficients and short run assessment displayed by γ1j, γ2j, γ3j, γ4j, γ5j, γ6j’. The long-run condition is obtained from the following condition:
(9)
(9)
At the point when, long-run affiliation exists among the variables; then, at that point, the ECM is performed. The conditions of the ECT are as follows:
(10)
(10)
where ω represents the slack of the next period, which implies the blunder adjustment term (ECT). The meaning of ECT is the rate at which a balance circumstance moves from a condition of disequilibrium. ECT assessment should be considered in econometric examinations to establish a long-run connection.
3.5. Panel causality tests
Owing to the presence of cross-sectional dependence, this study estimated the Dumitrescu Hurlin panel causality test. The causal equation is shown in EquationEquation (11)(11)
(11) .
(11)
(11)
Here, ϑ is the first difference operator, i is the cross-segment unit, and t is time. The causality between series has been shown on the off chance that E is the reason for F, and bidirectional reason implies that both have a causal connection, where F causes E and competes versa.
4. Result analysis
4.1. Descriptive statistics
Several criteria were considered in this section, such as the maximum value of the data series, ‘minimum value, mean value, median value, standard deviation, skewness, and skewness’. presents the results of the panel descriptive statistics. The results were estimated by taking logs for simplicity of all estimations in this study. The descriptive statistics for FDI (LNFDI) show that a minimum value of 14.509 denotes a country or group of countries among the panel countries with FDI. LNFDI is negatively skewed and has a long left tail, as shown by the skewness value of -0.806, where the kurtosis value is 4.190. The mean LNFDI value for this panel was 21.850, the median was 21.782, and the standard deviation was 1.788.
Table 1. Descriptive statistics.
The descriptive statistics for external debt (LNExD) show that the maximum value of this panel series is 27.059, and the minimum value is 22.303, which denotes a country or group of countries among the panel countries with external debt. External debt is positively skewed and has a long right tail, as shown by the skewness value of 0.209 and kurtosis value of 2.042. The mean value of external debt for this panel is 24.760 and the median is 24.519, with a standard deviation of 1.232. The descriptive statistics of the exchange rate (LNExR) show that LNExR is positively skewed and has a long right tail, as indicated by the skewness value of 0.112, where the kurtosis value is 3.040, which is positive. The mean LNExR for this panel was 4.565, the median was 4.192, and the standard deviation was 2.989. LNEG has the maximum value 2.730 and LNInF has the maximum value 4.490. Tax revenue (LNTxR) shows that the mean value of LNTxR for this panel is 28.387, median is 27.292, and standard deviation is 2.893. The minimum and maximum values of LNTxR were 19.393 and 34.973, respectively. The Skewness value was 0.417 for the panel series of the LNTxR variable, and the kurtosis value was 3.320. The results of the descriptive analysis indicated the strength of each variable in estimating further results.
4.2. Unit root test
There are some criteria are being used in panel unit root test such as intercept and trend and intercept by applying CIPS method. Estimated null hypothesis is H0 is there is no stationary is data series (have unit root) where alternative hypothesis H1 is there is stationary is series (no unit root). The results of the unit root tests are presented in .
Table 2. CIPS panel unit root test.
The results from show that LNFDI presents the statistics of CIPS at levels with a trend is −0.858, at the first difference, CIPS method state that H0 is rejected. This variable is stationary in both the level and first differences. LNExR presents the statistics at the 1st difference, the CIPS method state that H0 is rejected and at level also reject the null hypothesis, which means that the variable is stationary for the 1st difference and at level. Moreover, this variable is stationary in both level and first differences. LNTxR presents the statistics, when this variable measures the unit root at the 1st difference, the CIPS method reject H0, which indicates that the variable is stationary at the 1st difference. Moreover, this variable is stationary in both level and first differences. The variable LNExD is nonstationary at the level in the case of intercept, trend, and intercept. In the first difference case, the CIPS method rejects H0, which states that the variable is stationary at the 1st difference. LNEG and LNInF show the stationary at level and first difference. Moreover, these variables are stationary in both level and first differences. The results indicate a mixed order; ‘some variables are stationary at I(0) and some are I(1)’. The estimation suggests the ARDL model; for the case of cross-sectional dependency (CSD) with statationarity in mixed order, we may use three separate methods of ARDL: MG, PMG, and DFE. Based on these results and situations, this study conducted a PGM panel ARDL in the case of a second-generation panel. A similar model was used by Attiaoui et al. (Citation2017), Olayungbo and Quadri (Citation2019), Mensah et al. (Citation2019), Erülgen et al. (Citation2020), Elahi and Rahman (Citation2021), Majumder et al. (Citation2022), Rahman et al. (Citation2023b), and Voumik et al. (Citation2023).
4.3. Cross sectional dependency (CSD)
Panel data models are likely to display critical CSD in the blunder, which might arise because of the presence of typical dazes and unseen fragments that eventually become part of the error term, CSD, and capricious pairwise reliance in the blunder term with no particular example of normal parts or CSD, as per a developing collection of board information research. For a better understanding, consider a few models such as Robertson and Symons (Citation2000) and Pesaran (Citation2004). In addition, the impact of CSD on evaluation is regularly subject to various elements, such as the greatness of connection and the idea of CSD itself. Assuming we anticipate that cross-sectional dependence should be brought about by the presence of chosen factors that are unseen (and in this manner, the effect of these fragments is felt through the error term) yet uncorrelated with the considering regressors, obviously the standard ‘fixed-effect (FE) and random effect (RE)’ assessors are unsurprising but incapable, and the surveyed standard blunder is essentially one-sided where the CSD test is utilized. The after-effects of the CSD test are presented in .
Table 3. Result of cross sectional dependency: Pesaran CD (PCD) test.
The Pesaran CD test results show that LNFDI has CD statistics of 17.02, rejecting H0 and accepting H1 at the 1% level of significance, indicating that cross-section dependency exists. The Pesaran CD statistic of 5.79, which is significant at the 1% level, indicates that the result rejects H0 and accepts the H1 of CSD. The estimated LNTxR results show that cross-section dependency exists, with Pesaran CD statistics of 15.19, rejecting H0 and failing to reject H1 at the 1% level of significance. Similarly, the Pesaran CD statistics for LNExR are 23.79, indicating that the results reject H0 and accept the H1 of CSD at the 1% level of significance, similarly LNInF and INEG have cross sectional dependence. The CSD test suggests using a second-generation panel estimation for this dataset.
4.4. Lag selection criteria
The current study uses the vector autoregressive (VAR) model to estimate the optimal lag length criteria. The estimated results are presented in . The anticipated result suggests that the optimal lag length was 2. The SC and HQ criteria were used to determine the lag order in this study. The lag selection suggests that the PMG panel ARDL model, with a lag of 2. The lag selection values for the minimum AIC and LR were 4.55 and 65.07, respectively. The significance level for this estimation was 1%.
Table 4. Lag selection criteria.
4.5. Cointegration test: Kao method
The panel cointegration test run by Kao (Citation1999) to estimate the long-run relationship among the t-stat variables was considered. The outcome of the cointegration is presented in . An ADF test was used to determine the Kao technique. The t-stat of the ADF test is −3.001, and the probability is 0.00, which rejects H0 at the 1% level of significance and does not reject the alternative hypothesis. This outcome indicates that cointegration exists between the variables. shows the results of the Johansen and Fisher cointegration test, and this result also supports the notion that the variables have long-run cointegration. Drawing on an ARDL cointegration approach, results from Ahmed and Shaikh Citation(2024) concerning cointegration strategy found that there has been quite a long-term connection between the selected variables. Similar to He et al. (Citation2019) and Osabohien et al., this investigation connected ARDL to break down the long-run impact. To quantify the long-run relationship, the Kao test is much more effective in a panel series (Ssali et al., Citation2019; Wang et al., Citation2011). Based on the results, we conclude that the residuals of the variables encompass cointegration in the long run, rejecting the null hypothesis.
Table 5. Result of cointegration test: Kao method.
Table 6. Robustness check by Johansen Fisher cointegration.
4.6. Short-run estimations of PMG panel ARDL model
shows that the coefficient of ECT is negative (−0.27) and significant at the 1% level. To guarantee the short-run elements of the model, the coefficient of ECT ought to move into equilibrium from a disequilibrium situation. The consequence of the examination satisfies the prerequisites of the short-run elements. ECT implies the ‘speed of adjustment’ of the model toward equilibrium form a disequilibrium situation.
Table 7. Short-run estimations results of PMG Panel ARDL model.
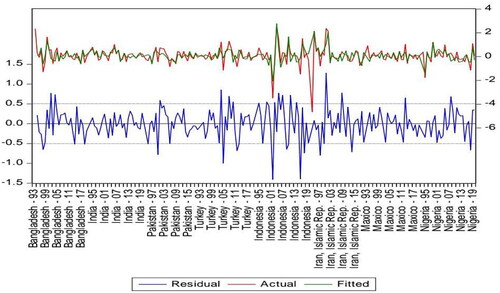
shows that the coefficient of external debt D(LNExD) has a positive coefficient of 0.06. This result explains that a one percent raise in external debt tends to raise FDI by 0.06 percent in the short run, but this estimation is not significant. However, the coefficient of the one-period lag of external debt D(LNExD(-1)) has a positive coefficient of 0.61, which explains D(LNExD(-1)) has a positive impact on LNFDI. The coefficient of the variable volatility of exchange rate D(LNExR) has a negative coefficient of -0.15, which explains why a one percent increase in external debt tends to reduce foreign direct investment 0.15 percent. External debt reduces foreign investment founded by Abille and Mumuni (Citation2023), Chowdhury et al. (Citation2023), and Rahman (Citation2023). However, the one-period lag coefficient of exchange rate D(LNExR(-1)) has a positive coefficient of 0.43, which explains why D(LNExR(-1)) has a positive impact on LNFDI. The one-period lag of foreign direct investment (LNFDI(-1)) has a negative coefficient, which means that the one-period lag of LNFDI has a negative impact on current-year FDI. The coefficient of tax review D(LNTxR) has a negative coefficient of −0.38, which explains that a one percent increase in tax review tends to reduce foreign direct investment by 0.38 percent. However, the coefficient of the one-period lag of tax review D(LNTxR(-1)) has a negative coefficient of −0.07, which explains why D(LNTxR(-1)) has a negative impact on LNFDI in N-11 countries. In the short run economic growth and inflation has no positive impact on foreign direct investment. Moreover, the diagnostic test of the residual is shown in .
Figure 3. Residual diagnostic: actual and fitted residual.
Source: Author’s estimation.
4.7. Long run dynamics: PMG panel ARDL and causality analysis
The inference from the long-run results presented in indicates that external debt, the exchange rate, and tax revenue are all significant at the 1% level. It can also be observed that most of the long-run coefficients of the PMG panel ARDL regression variables have their anticipated theoretical signs and magnitudes, which results are valid in economic theory.
Table 8. Results of long-run estimations of PMG Panel ARDL model.
The long-run coefficients of external debt and tax revenue are 0.46 and 0.33, respectively, for FDI in N-11 countries. A 1% increase in external debt will increase 46% in FDI. Although the framework suggests a posiive relationship between FDI and external debt as well as tax revenue because investors investigate the economic conditions of the country before investing, if the tax rate of an economy in production and transactions is higher, investors will pay less attention to investing (Albertus et al., Citation2022; Majumder & Rahman, Citation2020). The results demonstrate that the exchange rate in N-11 countries has a positive relationship with FDI in the long run. The coefficient of the exchange rate in the long run is positive (0.71) and significant at the 1% level. This finding is consistent with those of the framework. The results demonstrate that the stability of the stability of exchange rate increases FDI and that there is a positive association between exchange rate stability and FDI. Economic growth (LNEG) is positive to attract FDI in the long run. Inflation (LNInF) is negative to attract FDI in the long run, more inflation reduce FDI in the long run. This statement is supported by Lee and Brahmasrene (Citation2020), Warren et al. (Citation2023), Rahman et al. (Citation2023a), and Jamal and Bhat (Citation2023) for various panel groups and individual country.
However, ‘pair-wise Dumitrescu Hurlin panel causality (DHPC)’ tests have been used to estimate the causal relationship among variables, considering the case of cross-sectional dependence. The results of the DHPC test are presented in . The causality test indicates no causality between FDI and external debt. The result shows ‘unidirectional causality’ between the inflation and FDI, where the exchange rate causes economic growth in N-11 countries and the estimation process is significant at the 1% level. Similarly, the result illustrates a ‘unidirectional causality’ between economic growth and tax revenue, where tax revenue causes FDI. There is unidirectional causality from external debt to the exchange rate; H0 is rejected at the 1% level to determine the causality between those variables and estimate the external debt cause of the exchange rate in N-11 countries. Variables, such as tax revenue and external debt, show unidirectional causality. Tax revenue causes economic growth, and causality rejects H0 at the 1% level of significance. The estimated result shows that bidirectional causal relations exist between inflation and the exchange rate. To summarize, the Dumitrescu Hurlin panel causality tests results find that: LNEG to LNTXR, LNTXR to LNINF, LNINF to LNEG, LNEXR to LNINF, LNINF to LNEXR, LNFDI to LNINF, and LNEXD to LNEXR.
Table 9. Pairwise Dumitrescu Hurlin panel causality tests.
5. Conclusion and recommendations
Foreign direct investment (FDI) has been widely recognized as a crucial source of capital inflows in numerous nations, particularly in developing economies such as N-11 countries, throughout the past few decades. FDI plays a pivotal role in a nation’s economic progress. FDI offers direct benefits and facilitates the transfer of innovation, information, expertise, skills, and so on across countries. FDI is an integral component of a country’s balance of payments. When a country receives FDI from a foreign nation, it is recorded as a debit, while when a country invests in a foreign nation, it is recorded as credit. This study investigates the impact of exchange rate, external debt, and tax revenue on foreign direct investment in N-11 countries and measures the interlink between the dependent and independent variables as well as the control variable. This study considers secondary data from 1993 to 2020. The panel unit root test considers several criteria to decide on the unit root of the selected factors. According to the panel unit root, ‘some variables are stationary at level I(0), and some variables are stationary at the 1st difference, I(1)’. In the case of mixed orders, this study considered the PMG panel ARDL model. However, the key finding of this study is that the external debt coefficient has positive sign to determine FDI. The variable exchange rate has a positive impact in the long run and the coefficient is 0.71, explaining why an increase in external debt of one percent tends to increase FDI by 0.71 percent. However, the long-run coefficient of tax revenue on FDI in N-11 countries is positive. The findings indicate that over time, FDI and exchange rates are positively correlated in N-11 countries. Economic growth has significant impact to raise FDI in the long run, on the other hand inflation has negative impact that has been reduced FDI in the long run.
This study provides significant insights into the dynamics of foreign direct investment (FDI) in emerging markets. These findings provide numerous recommendations for policymakers, investors, and researchers to improve the comprehension and control of foreign direct investment (FDI) in the N-11 countries. It is imperative for policymakers in the N-11 countries to give top priority to maintaining macroeconomic stability, with a specific focus on effectively controlling external debt levels and volatility in exchange rates. Adopting cautious financial strategies, such as debt sustainability frameworks and responsible borrowing practices, can help reduce the dangers linked to excessive external debt. Furthermore, the adoption of flexible exchange rate regimes or the implementation of effective exchange rate management methods can reduce volatility and improve investor confidence. Policymakers should prioritize enhancing the investment climate and regulatory environment in order to attract a greater influx of foreign direct investment (FDI). This may entail optimizing bureaucratic processes, minimizing regulatory obstacles, and strengthening efforts to safeguard investors. Moreover, based on the empirical results, this study recommends that to attract foreign investors, the government should control the exchange rate system to protect volatility. A business-friendly environment is important for attracting foreign investors, so the government should ensure the stability of governance, policies, and legislation. Because the country’s crumbling infrastructure is deterring FDI influx and eventually having an adverse effect on GDP, the government ought to implement proactive actions, such as expanding and standardizing air ports, seaports, stable renewable energy, developing highways, and improving security. The forex market should be stable to attract foreign investors and increase total trade volume. The vulnerability of the exchange rate increases FDI because emerging countries have opportunities to enhance FDI. In the long run, the results show that a positive association of forex market stability increases FDI in N-1 countries. An ineffective foreign exchange rate policy is a barrier to FDI. Simultaneously, external debt and tax rates should be minimized to attract foreign direct investment in N-11 countries. Further studies should be conducted on new panel groups or giant panel groups, such as OECD, EU, D-8, African countries, and OPEC countries.
Authors contribution
Dr. Munira Sultana: data analysis, methodology, background of this study. Mr. Md. Hasanur Rahma: conceptualized, substantial writing, revision, proofreading, and improved drafts. Dr. Grzegorz Zimon: conceptualized, revised, proofread, and improved the draft.
Consent to participate
This study ensured that consent to participate was maintained and there was no contradiction.
Consent to publish
We have no contradiction to publish, and this paper has only been submitted to this journal.
Ethical approval
This study ensures that ethical approval is maintained and that there is no ethical contradiction.
Data availability statement
Data will be made available based on requests.
Disclosure statement
No potential conflict of interest was reported by the author(s).
Additional information
Funding
Notes on contributors
Munira Sultana
Dr. Munira Sultana is an Associate Professor, Department of Economics, Jagannath University, Dhaka, Bangladesh. She has published numbers of research papers in national and international journals.
Md. Hasanur Rahman
Md. Hasanur Rahman is a Lecturer at the department of economics, Sheikh Fazilatunnesa Mujib University (SFMU). Mr. Rahman has completed his BSS and MSS degree from the department of Economics, Comilla University, Bangladesh. He has published numbers of research papers in SCOP US (Q1,Q2,Q3,Q4), and Web of Science (WoS) SCI, SCI-E, SSCI, ESCI Indexed journals. His areas of research interest are macroeconomics, development economics, international trade, environmental economics and econometrics.
Grzegorz Zimon
Dr. Grzegorz Zimon is a Professor at the Department of Management, Rzeszow University of Technology, Poland. He has published numbers of research papers in SCOP US and Web of Science (WoS) Indexed journals.
References
- Abille, A. B., & Mumuni, S. (2023). Tax incentives, ease of doing business and inflows of FDI in Africa: Does governance matter? Cogent Economics & Finance, 11(1), 2164555. https://doi.org/10.1080/23322039.2022.2164555
- Adewale, E. A., & Comfort, E. S. (2022). Nexus between Exchange Rate Fluctuation and Foreign Direct Investment in Nigeria. NEXUS, 5(2), 21–37.
- Ahmed, F., Khan, L., Farooq, F., & Suleman, T. (2020). Impact of international trade and trade duties on current account balance of the balance of payment: A study of N-11 countries. Journal of Accounting and Finance in Emerging Economies, 6(1), 11–32. https://doi.org/10.26710/jafee.v6i1.1047
- Ahmed, S., &Shaikh, S. A. (2024). Economic Growth Determinants in Pakistan: An Empirical Analysis Using ARDL Model. Qlantic Journal of Social Sciences and Humanities, 5(1), 162–175. https://doi.org/10.55737/qjssh.682525285
- Albertus, J. F., Glover, B., & Levine, O. (2022). Foreign investment of US multinationals: The effect of tax policy and agency conflicts. Journal of Financial Economics, 144(1), 298–327. https://doi.org/10.1016/j.jfineco.2021.06.004
- Alola, A. A., Bekun, F. V., & Sarkodie, S. A. (2019). Dynamic impact of trade policy, economic growth, fertility rate, renewable and non-renewable energy consumption on ecological footprint in Europe. Science of the Total Environment, 685, 702–709. https://doi.org/10.1016/j.scitotenv.2019.05.139
- Ang, J. B. (2008). Determinants of foreign direct investment in Malaysia. Journal of Policy Modeling, 30(1), 185–189. https://doi.org/10.1016/j.jpolmod.2007.06.014
- Arshad, Z., Robaina, M., & Botelho, A. (2020). Renewable and non-renewable energy, economic growth and natural resources impact on environmental quality: Empirical evidence from south and southeast asian countries with CS-ARDL modeling. International Journal of Energy Economics and Policy, 10(5), 368–383. https://doi.org/10.32479/ijeep.9956
- Aslan, A., Altinoz, B., & Atay Polat, M. (2021). The nexus among climate change, economic growth, foreign direct investments, and financial development: New evidence from N‐11 countries. Environmental Progress & Sustainable Energy, 40(3), e13585. https://doi.org/10.1002/ep.13585
- Attiaoui, I., Toumi, H., Ammouri, B., & Gargouri, I. (2017). Causality links among renewable energy consumption, CO2 emissions, and economic growth in Africa: Evidence from a panel ARDL-PMG approach. Environmental Science and Pollution Research, 24(14), 13036–13048. https://doi.org/10.1007/s11356-017-8850-7
- Balıkçıoğlu, E., Dalgıç, B., & Fazlıoğlu, B. (2016). Does foreign capital increase tax revenue: The Turkish case. International Journal of Economics and Financial Issues, 6(2), 776–781.
- Bénassy-Quéré, A., Fontagné, L., & Lahrèche-Révil, A. (2001). Exchange-rate strategies in the competition for attracting foreign direct investment. Journal of the Japanese and international Economies, 15(2), 178–198.
- Bilawal, M., Ibrahim, M., Abbas, A., Shuaib, M., Ahmed, M., Hussain, I., & Fatima, T. (2014). Impact of exchange rate on foreign direct investment in Pakistan. Advances in Economics and Business, 2(6), 223–231. https://doi.org/10.13189/aeb.2014.020602
- Busse, M., & Hefeker, C. (2007). Political risk, institutions and foreign direct investment. European Journal of Political Economy, 23(2), 397–415. https://doi.org/10.1016/j.ejpoleco.2006.02.003
- Buthelezi, E. M. (2023). Exploring the relationship between exchange rate misalignment uncertainty and economic growth in South Africa. Cogent Economics & Finance, 11(2), 2267920. https://doi.org/10.1080/23322039.2023.2267920
- Chaudhary, G. M., Shah, S. Z. A., & Bagram, M. M. M. (2012). Do exchange rate volatility effects foreign direct investment? Evidence from selected Asian economies. Journal of Basic and Applied Scientific Research, 2(4), 3670–3681.
- Chettri, K. K., Bhattarai, J. K., & Gautam, R. (2022). Foreign direct investment and stock market development in Nepal. Asian Journal of Economics and Banking, 7(2), 277–292. https://doi.org/10.1108/AJEB-02-2022-0018
- Chowdhury, T. S., Rahman, M. H., Majumder, S. C., & Esquivias, M. A. (2023). Significance of technological progress and capital formation to expand foreign direct investment in Bangladesh: Does money circulation matter? Cogent Economics & Finance, 11(2), 2279351. https://doi.org/10.1080/23322039.2023.2279351
- Clements, B., & Nguyen, T. (2003). External debt, public investment and growth in low-income countries. IMF Working Paper No. 3(249).
- De Mooij, R. A., & Ederveen, S. (2003). Taxation and foreign direct investment: a synthesis of empirical research. International Tax and Public Finance, 10, 673–693.
- Desai, M. A., Foley, C. F., & Hines, J. R. Jr, (2004). Foreign direct investment in a world of multiple taxes. Journal of Public Economics, 88(12), 2727–2744. https://doi.org/10.1016/j.jpubeco.2003.08.004
- Dhakal, D., Nag, R., Pradhan, G., & Upadhyaya, K. P. (2010). Exchange rate volatility and foreign direct investment: Evidence from East Asian countries. International Business & Economics Research Journal (IBER), 9(7), 121–128. https://doi.org/10.19030/iber.v9i7.603
- Elahi, S. M., & Rahman, M. H. (2021). Remittance and inflation nexus in Bangladesh: Application of dynamic ARDL model with linear trend. Indonesian Journal of Business and Economics, 4(2), 611–622. https://doi.org/10.25134/ijbe.v4i2.4513
- Erülgen, A., Rjoub, H., & Adalıer, A. (2020). Bank characteristics effect on capital structure: Evidence from PMG and CS-ARDL. Journal of Risk and Financial Management, 13(12), 310. https://doi.org/10.3390/jrfm13120310
- Etim, R. S., Jeremiah, M. S., & Jeremiah, O. O. (2019). Attracting foreign direct investment (FDI) in Nigeria through effective tax policy incentives. International Journal of Applied Economics, Finance and Accounting, 4(2), 36–44. https://doi.org/10.33094/8.2017.2019.42.36.44
- Fadl, N., & Ghoneim, H. (2020). Impact of foreign exchange rate on foreign direct investment: Egypt case. Revue du Lareiid, 6, 7.
- Fahmi, M. R. (2012). Analyzing the relationship between tax holiday and foreign direct investment in Indonesia. Asia Pacific Studies Ritsumeikanasia Pacific University Japan.
- Gresik, T. A. (2001). The taxing task of taxing transnationals. Journal of Economic Literature, 39(3), 800–838. https://doi.org/10.1257/jel.39.3.800
- Haque, M. A., Biqiong, Z., Arshad, M. U., & Yasmin, N. (2022). Role of uncertainty for FDI inflow: Panel econometric analysis of selected high-income nations. Cogent Economics & Finance, 10(1), 2156677. https://doi.org/10.1080/23322039.2022.2156677
- He, P., Zou, X., Qiao, Y., Chen, L., Wang, X., Luo, X., & Ning, J. (2019). Does the double dividend of environmental tax really play a role in OECD countries? A study based on the panel ARDL Model. Ekoloji, 28(107), 49–62.
- Ibrahim, M. D., & Alola, A. A. (2020). Integrated analysis of energy-economic development-environmental sustainability nexus: Case study of MENA countries. Science of the Total Environment, 737, 139768. https://doi.org/10.1016/j.scitotenv.2020.139768
- Jahan, N., & Paul, S. C. (2021). Determinants of FDI inflows to Next 11 countries: A panel data analysis. International Journal of Research in Business and Social Science (2147–4478), 10(6), 159–165.
- Jamal, A., & Bhat, G. M. (2023). Disentangling the nexus between exchange rate volatility, exports, and FDI: Empirical evidence from the Indian economy. Global Journal of Emerging Market Economies, 15(3), 449–472. https://doi.org/10.1177/09749101221108788
- Kao, C. (1999). Spurious regression and residual-based tests for cointegrating in panel data. Journal of Econometrics, 90(1), 1–44. https://doi.org/10.1016/S0304-4076(98)00023-2
- Lee, J. W., & Brahmasrene, T. (2020). Exchange rate movements and structural break on China FDI inflows. Contemporary Economics, 14(2), 112–126. https://doi.org/10.5709/ce.1897-9254.335
- Liu, W. (2010). Determinants of FDI inflows to China: An empirical analysis of source country characteristics. In Proceedings of the 2010 Taipei International Conference on Growth, Trade and Dynamics (pp. 1–18).
- Louail, B., & Zouita, M. S. (2021). The relationship between foreign direct investment, financial development and growth economic in Next-11 Countries: A PMG/ARDL estimation. Management, 25(1), 28–50. https://doi.org/10.2478/manment-2019-0058
- Mahmood, H., & Chaudhary, A. R. (2013). Impact of FDI on tax revenue in Pakistan. Pakistan Journal of Commerce and Social Sciences (PJCSS), 7(1), 59–69.
- Majumder, S. C., & Rahman, M. H. (2020). Impact of foreign direct investment on economic growth of China after economic reform. Journal of Entrepreneurship, Business and Economics, 8(2), 120–153.
- Majumder, S. C., Rahman, M. H., & Martial, A. A. A. (2022). The effects of foreign direct investment on export processing zones in Bangladesh using Generalized Method of Moments Approach. Social Sciences & Humanities Open, 6(1), 100277. https://doi.org/10.1016/j.ssaho.2022.100277
- Mensah, I. A., Sun, M., Gao, C., Omari-Sasu, A. Y., Zhu, D., Ampimah, B. C., & Quarcoo, A. (2019). Analysis on the nexus of economic growth, fossil fuel energy consumption, CO2 emissions and oil price in Africa based on a PMG panel ARDL approach. Journal of Cleaner Production, 228, 161–174. https://doi.org/10.1016/j.jclepro.2019.04.281
- Mwakabungu, B. H. P., & Kauangal, J. (2023). An empirical analysis of the relationship between FDI and economic growth in Tanzania. Cogent Economics & Finance, 11(1), 2204606. https://doi.org/10.1080/23322039.2023.2204606
- Odabas, H. (2016). Foreign direct investment inflows on tax revenues in the transition economies of European Union. New Trends and Issues Proceedings on Humanities and Social Sciences, 2(2), 17–22. https://doi.org/10.18844/prosoc.v2i2.408
- Olayungbo, D. O., & Quadri, A. (2019). Remittances, financial development and economic growth in sub-Saharan African countries: Evidence from a PMG-ARDL approach. Financial Innovation, 5(1), 1–25. https://doi.org/10.1186/s40854-019-0122-8
- Onifade, S. T., Çevik, S., Erdoğan, S., Asongu, S., & Bekun, F. V. (2020). An empirical retrospect of the impacts of government expenditures on economic growth: New evidence from the Nigerian economy. Journal of Economic Structures, 9(1), 1–13. https://doi.org/10.1186/s40008-020-0186-7
- Osinubi, T. S. (2002). Does stock market promote economic growth in Nigeria. The ICFAI Journal of Applied Finance, 10(3), 17–35.
- Paul, S. C., Jahan, N., Hassan, M. M., & Mondal, T. (2021). Nexus between FDI and production indices: Evidence from Asian countries. Asian Journal of Empirical Research, 11(4), 33–40. https://doi.org/10.18488/journal.1007.2021.114.33.40
- Pesaran, M. H. (2004). General diagnostic tests for cross section dependence in panels. CESifo Working Paper Series No. 1229; IZA Discussion Paper No. 1240. Available at SSRN: http://ssrn.com/abstract=572504.
- Pesaran, M. H., Shin, Y., & Smith, R. P. (1999). Pooled mean group estimation of dynamic heterogeneous panels. Journal of the American statistical Association, 94(446), 621–634.
- Pradhan, J. P. (2011). Emerging multinationals: A comparison of Chinese and Indian outward foreign direct investment. Institutions and Economies, 3(1), 113–148.
- Qamruzzaman, M., Karim, S., & Wei, J. (2019). Does asymmetric relation exist between exchange rate and foreign direct investment in Bangladesh? Evidence from nonlinear ARDL analysis. The Journal of Asian Finance, Economics and Business, 6(4), 115–128. https://doi.org/10.13106/jafeb.2019.vol6.no4.115
- Rahman, M. H. (2023). Does the current account balance influence foreign direct investment in the Indian economy? Application of quantile regression model. SN Business & Economics, 3(5), 94. https://doi.org/10.1007/s43546-023-00471-y
- Rahman, M. H., Chowdhury, M. A., & Akter, M. S. (2023a). Interaction of market size, inflation and trade openness on foreign direct investment inflows in India, China and Japan: Panel dynamic analysis. International Journal of Indian Culture and Business Management, 29(1), 45–64. https://doi.org/10.1504/IJICBM.2023.130963
- Rahman, M. H., Voumik, L. C., Rahman, M. M., & Majumder, S. C. (2023b). Scrutinizing the existence of the environmental Kuznets curve in the context of foreign direct investment, trade, and renewable energy in Bangladesh: Impending from ARDL method. Environment, Development and Sustainability, 26, 12619–12638.
- Robertson, D., & Symons, J. (2000). Factor residuals in SUR regressions: Estimating panels allowing for cross sectional correlation (No. 473). Centre for Economic Performance, London School of Economics and Political Science.
- Senibi, V., Oduntan, E., Ayo, A., Makwal, I., & Eldad, M. (2017). Public debt, domestic investment and foreign direct investment in Nigeria: A structural var approach (1981–2015). International Journal of Innovative Research and Advanced Studies (IJIRAS), 4(6), 508–519.
- Shapiro, D., & Globerman, S. (2003). Foreign investment policies and capital flows in Canada: A sectoral analysis. Journal of Business Research, 56(10), 779–790. https://doi.org/10.1016/S0148-2963(02)00466-6
- Shiyalini, S., & Suresh, K. (2022). The impact of public debt on domestic and foreign direct investments in developing market: An ARDL bounds testing approach. Corporate Law and Governance Review, 4(1), 8–18. https://doi.org/10.22495/clgrv4i1p1
- Ssali, M. W., Du, J., Mensah, I. A., & Hongo, D. O. (2019). Investigating the nexus among environmental pollution, economic growth, energy use, and foreign direct investment in 6 selected sub-Saharan African countries. Environmental Science and Pollution Research, 26(11), 11245–11260. https://doi.org/10.1007/s11356-019-04455-0
- Sultanuzzaman, M. R., Fan, H., Akash, M., Wang, B., & Shakij, U. S. M. (2018). The role of FDI inflows and export on economic growth in Sri Lanka: An ARDL approach. Cogent Economics & Finance, 6(1), 1518116. https://doi.org/10.1080/23322039.2018.1518116
- Voumik, L. C., Rahman, M. H., Rahman, M. M., Ridwan, M., Akter, S., & Raihan, A. (2023). Toward a sustainable future: Examining the interconnectedness among Foreign Direct Investment (FDI), urbanization, trade openness, economic growth, and energy usage in Australia. Regional Sustainability, 4(4), 405–415. https://doi.org/10.1016/j.regsus.2023.11.003
- Wang, Y., Wang, Y., Zhou, J., Zhu, X., & Lu, G. (2011). Energy consumption and economic growth in China: A multivariate causality test. Energy Policy, 39(7), 4399–4406. https://doi.org/10.1016/j.enpol.2011.04.063
- Warren, M., Seetanah, B., & Sookia, N. (2023). An investigation of exchange rate, exchange rate volatility and FDI nexus in a gravity model approach. International Review of Applied Economics, 37(4), 482–502. https://doi.org/10.1080/02692171.2023.2239719
- Young, K. H. (1988). The effects of taxes and rates of return on foreign direct investment in the United States. National Tax Journal, 41(1), 109–121. https://doi.org/10.1086/NTJ41788713