
 ?Mathematical formulae have been encoded as MathML and are displayed in this HTML version using MathJax in order to improve their display. Uncheck the box to turn MathJax off. This feature requires Javascript. Click on a formula to zoom.
Abstract
This study explores volatility spillovers and financial connectedness between conventional and Islamic equity stock markets in developed, emerging, and frontier economies. Four regions– Gulf Cooperation Council (GCC), South Asian Association for Regional Cooperation (SAARC), Brazil, Russia, India, and China (BRIC), and Group of Seven (G7)–were selected for this study following the Diebold and Yilmaz (DY-12) and Baruník and Krehlík (BK-18) spillover methods. Daily data from 01 January 2012 to December 31, 2021, were sourced from the Eikon Refinitiv data stream. The results showed that the COVID-19 crisis was lethal compared to the oil crisis of 2014–15. These results suggest that Islamic stock markets are highly interconnected in terms of overall returns. For conventional stocks, the USA stock market largely serves as the top transmitter of returns and volatility. However, for Islamic stocks, France and the USA found to be the top transmitter and receiver of the shock, respectively. Together with these findings, we found that the DY-12 approach could replicate the frequency-domain connectivity measurements of BK-18. Our findings have significant implications for investors, regulators, and policymakers.
Impact Statement
This study comprehensively explored the static and dynamic volatility spillover effect between Islamic and conventional stock markets across the globe in four regions covering major economic turmoil including the Oil crisis and Pandemic. The results showed that the US conventional stock market appeared to be the top transmitter of shock during the oil crisis. However, the oil rich countries including Oman, Bahrain, UAE, Kuwait, and Qatar were heavily affected due the decline in the oil prices. In addition, with time- and frequency-volatility spillover perspective, Islamic stock market had stronger impact during the COVID-19 compared to the conventional markets. However, Qatar Islamic index stands out as an exception during pandemic. The findings of our study provide strong implications for the portfolio managers to put emphasize on static and dynamic volatility connectedness to make prudent and informed investment decisions.
Introduction
‘Black Swan’ events harmed stock markets by making investors react impulsively, hence creating uncertainty (Lewis & Kindleberger, Citation1979; Kindleberger et al., Citation2005). For instance, the Gulf War (1990–91), the Asian financial crisis (1997–98), the September 11 attacks (2001–02), the global financial crisis (GFC) (2007–08), the Russian Financial Crisis (2014), the Brazilian economic crisis (2014–17), the crude oil crises (2014–15), the China stock market crash (2015–16), and the COVID-19 pandemic (2019–20) are all examples of Black Swans (Lewis & Kindleberger, Citation1979; Kindleberger et al., Citation2005; Ansell & Boin, Citation2019). The Coronavirus (COVID-19) has caused an unprecedented level of panic and uncertainty among global business operators, which has shaken economic markets and caused the global economy to enter recession. It started out as a health crisis, but it has become a huge economic disaster, causing economic and financial chaos around the world. People began to worry about an even bigger pandemic, which caused investors to get scared and pull their money out of the stock market. The stock markets in Europe, the UK, France, and Japan all lost around 30–42% of their value due to the pandemic (Taera et al., Citation2023). In just one-week, global stocks lost almost $6 trillion, while the US S&P 500 lost around $5 trillion. Therefore, the pandemic impacted almost every sphere of life and stock markets are no exception. Unpredictably, stock market indices show varied response to external shocks, which requires further investigation (Hasan et al., Citation2021). Investors have been drawn to Islamic stocks in recent years, especially since the GFC and European Debt Crisis (EDC). Studies have shown that Islamic stocks outperform their conventional counterparts during a crisis, and have become popular among investors who want to invest in stocks that reflect their religious beliefs. The Islamic financial market has been growing steadily, at an annual rate of 11% according to the Islamic finance development indicator (IFDI) for 2018, showing that it’s a long-term investment opportunity (Bossman et al., Citation2022).
Recent studies have compared Islamic and conventional markets during the pandemic (Ali et al., Citation2022; Bahloul & Khemakhem, Citation2021; Bossman et al., Citation2022; Li et al., Citation2021; Mensi et al., Citation2021a; Taera et al., Citation2023; Zahid et al., Citation2023). On the other hand, Gulf Cooperation Council countries play a leading role in the global economy, with a contribution of 23 percent of proven oil and gas investments, while stock market behavior is understudied (Naeem et al., Citation2021). Furthermore, Gulf Cooperation Council economies, known as developing markets, are undergoing financial liberalization, resulting in a significant connection with the global economy. In context of oil crisis, despite ample studies in stock markets (Basher et al., Citation2018; Naeem et al., Citation2021) the evidence of spillover covering the developed, emerging, and frontiers market is limited. In addition, Rehman et al. (Citation2023) discovered a weak spillover effect in the conventional market from the leading markets around the globe, However, this study investigates the economic relationship between conventional and Islamic stock market returns via return and volatility spillover effects in the four regions (GCC, SAARC, BRIC, G7). There is a conspicuous lack of studies discussing volatility spillovers and financial connectedness worldwide. All studies, except the one in the UK (Ahmad et al., Citation2021), are based on collective indexes. Moreover, prior research has not paid sufficient attention to how global conventional and Islamic stock markets are connected. This study attempts to examine the dynamic relationship between Islamic and traditional stocks to fill this gap. Importantly, majority of the studies seem to focus on the impact between developed markets, or alternatively between local and regional markets. This study includes a wide range of 18 countries with Islamic and conventional stock markets from developed, emerging, and frontier markets and identifies the directional co-movements of volatility and connectedness. Furthermore, the current study intends to help financial regulators assess future market risk owing to crises such as COVID-19. Asset managers and foreign corporations can use changing spillover dynamics to improve their investment decisions.
The current study is expected to contribute to the literature in the following ways. First, by utilizing countries-specific stock indices, which cannot entirely indicate the performance of the global market, this study analyzes conventional and Islamic markets using regional stock indices. Furthermore, the study considers four Islamic and conventional stock markets based on major geographical region around the globe. This resulted in a substantial set of eighteen (18) stock markets studied in the broad connectivity framework to confirm that all significant financial sectors were covered. Third, building on the current empirical research, we broaden our understanding of the issues that cause volatility spillovers across financial markets. Due to the fact that the COVID-19 pandemic prompted several policy actions by governments worldwide, including the closure of businesses and stock exchanges. Therefore, to determine whether the coronavirus is reason for risk transmission is of great significance. We investigate the spread of coronavirus in four regions: the GCC, SAARC, BRIC, and G7, and their roles in global and Islamic financial sector. The COVID-19 has enhanced investment strategy uncertainties in many countries and heightened investor’s concerns. As a result, it is hypothesized that these factors, rather than the actual COVID-19 spread, may be more responsible for volatility spillovers across markets. The hypothetical or sentimental factors were examined within the equity market volatility due to infectious diseases, economic setbacks, and US financial uncertainty (Adekoya et al., Citation2022).
Literature review
The spread of coronavirus pandemic impacted stock markets in many countries, and immediately after this outbreak, the markets experienced negative abnormal returns. This section provides a brief review of existing studies in the context of stock market volatility and financial connectedness.
Stock market reaction to the pandemic
The economic impact of COVID-19 affected 202 countries worldwide (Zahid et al., Citation2023). Setiawan et al. (Citation2022) investigated risk and return to analyze how financial and alternative assets behaved during the COVID-19 pandemic. Financial markets frequently exhibit behavior influenced by external factors. The findings show that asset behavior reacts to market information and economic conditions in various ways. For instance, the risk is lower than usual during the pandemic period for gold and Bitcoin. Therefore, one strategy for handling this type of situation is to assess investment performance by carefully monitoring portfolios and controlling risk by diversifying sets across various instruments, especially during periods of global economic unrest. According to Ali et al. (Citation2022), the global pandemic has affected both the conventional and Islamic stock indices. The KSE and KMI indices of the PSX were used to analyze the results. The findings suggest that the conventional stock index and Islamic stock index behaved in a similar way during the COVID-19. As the crisis affected both types of stocks, and investors reacted impulsively resulting the greater volatility and lower returns in the end. To conclude the findings, the risk associated with both markets is of equal intensity. Similarly, Taera et al. (Citation2023) investigated how the current health crisis and geopolitical unrest increased the volatility of both traditional and non-traditional financial assets, such as the fintech, Islamic, ESG, and cryptocurrencies. Using GARCH (1,1), GJRGARCH, and EGARCH. The findings showed, with the exception of Bitcoin, all financial markets and alternative assets experienced high volatility throughout the observation period. Before the pandemic outbreak, Islamic stocks and ESG indices were more volatile than other financial assets. On the other hand, Setiawan et al. (Citation2022) explored the risk and return convergence of Islamic, ESG, conventional and other financial assets in selected countries of Muslim majority countries from the Group of Seven (G7). The finding revealed the risk associated to stock markets in Muslim-majority countries showed a random behavior. Therefore, no evidence of risk convergence in pre-pandemic period is observed in Islamic stock markets. However, the risk of the alternative assets including commodities, US bonds, and cryptocurrency converged in the selected countries in pre-pandemic period, which made the asset market riskier than Islamic stock market in selected Muslim states. Similarly, Chowdhury et al. (Citation2022) documented evidence in favor of resilience of Islamic stock market during the COVID-19 crisis compared to conventional counterparts. Using the Max. DD approach, the authors further argued in the speedy recovery of the Islamic equity market as opposed to the time taken by non-Islamic markets. In support of Chowdhury et al. (Citation2022) findings, Hassan et al. (Citation2022) confirmed the fact that Islamic stock market in Asian region was least affected and experience a speedy recovery compared to Middle East, Africa, Europe, and the US. Furthermore, the authors noticed a positive annual return where Islamic markets performed tremendously well during the COVID crisis. These results reinforce the views of proponents of Islamic financial market, which states that Islamic financial market is more resilient to economic setbacks.
Saleem et al. (Citation2021) explored how the COVID-19 pandemic has affected Islamic stock indices worldwide. The study considered Islamic equity indices from Australia, Qatar, Bahrain, United Arab Emirates, Middle East and North Africa (MENA), Middle East, North Africa, and Southeast Asia (MENASA), BRIC, and GCC. The results revealed that Australian, UAE, MENASA, and Bahrain Islamic equity indices were the least affected by the crisis until mid-2020. However, investors from GCC, BRIC, MENA, Qatar, and Asian countries responded pessimistically to the crisis. Contrary to the linearity, Suleman et al. (Citation2021) examined the asymmetric volatility effect between the Dow-Jones Islamic Equity Market Index (DJIM), the Brent crude, silver, and gold markets. The results showed a strong evidence of volatility transmission between the DJIM and commodity markets, with the DJIM and Brent oil markets being the largest transmitter. Moreover, non-linearity volatility transmission was also confirmed by Aziz et al. (Citation2021), who studied financial uncertainty between US stock market and the market of SAARC countries, namely India, Sri Lanka, Pakistan, and Bangladesh. The results from EGARCH indicate that the US market has a negative spillover effect on stock market returns in SAARC member countries. The exception is Sri Lanka, in which the spillover effect is positive. Pakistan’s stock market volatility is not affected by US stock market. Furthermore, Hamid et al. (Citation2019) argued that majority of the Islamic stock markets are found to be the volatility receptor. The authors covered the risk transmission from international, local, and GIPSI markets. MSCI is taken as international benchmark, whereas on local front S&P500 is taken to represent United States, Stoxx300 is for European region, and P1Dow is taken for Asia-Pacific region. The multivariate GARCH models revealed the risk transfer to and from Islamic stock market to conventional markets. In addition, Sevinç (Citation2022) examined volatility results that rippled across MIST stock markets, including countries (Mexico, Indonesia, South Korea, and Turkey) using the GARCH model to show how all series are provisionally affected by shocks. It is worth noting that these studies explored the volatility shifts caused by pandemics using contemporary GARCH family models. Aslam et al. (Citation2023) reinstated the finding of symmetric effect of COVID-19 on Islamic and conventional markets along with the US market impact on other markets including Pakistan, Indonesia, India, and Thailand. The authors used Multifractal Detrended Cross-Correlation Analysis (MF-DCCA) to analyze the pair-wise comparison of US economic policy uncertainty (EPU) with Islamic and conventional stock markets of the selected countries. The results revealed a similar impact on both markets, arguing that the conservative characteristics of Islamic stocks had failed to protect their investors during the time of economic uncertainties, financial crisis, and external shocks.
Stock market spillover effect in response to pandemic
One of the comprehensive studies by Mensi et al. (Citation2018) explored MSCI World Indexes as global benchmarks, regional indices (S&P500 in the US, Stoxx300 in Europe, P1DOW in Asia/Pacific), and the five GIPSI stock markets (Greece, Ireland, Portugal, Spain, Italy) by Diebold and Yilmaz (Citation2012) (hereafter DY (2012)) and used the GRACH-ADCC model. The findings indicate that the stock market exhibits significant risk spillover. Similarly, Kang et al. (Citation2019) observed that the world Index to the ASEAN-5 stock markets using a multivariate DECO-GARCH model and Diebold and Yilmaz (Citation2012) Spillover Index, which identifies the net directional spillover effect of each market. It is estimated that the ripple effect of the ASEAN-5 stocks price index and the world stock price index shows a positive equi-correlation. The use of the time-varying parameter vector autoregression (TYP)-VAR technique to study the dynamic interdependence between Islamic and conventional stock markets in GCC economies and global financial uncertainty has proven efficient in obtaining reliable and robust results (Naeem et al., Citation2021). This study explains how Islamic and traditional stocks exhibit strong interdependencies between nations. Together with these results, the Islamic stock market receives more ramifications than the traditional stock market. The study also shows that indicators of global financial uncertainty (GVZ, USEPU, and UKEPU) have positive and negative impacts, respectively, on financial market interconnectedness. In contrast, VIX and OVX were still not significant (Naeem et al., Citation2021).
Zhang et al. (Citation2020) found a significant evidence of volatility spillover effect in the G20 equity market using BEKK-GARCH models. Similarly, evidence of volatility spillover in the emerging markets particularly in Pakistan, China, Bangladesh, and India is documented from Pakistan to India, China to China, and China to Pakistan. In addition, larger negative shifts in volatility occur more frequently (Hamid et al., Citation2020). Moreover, Panda et al. (Citation2021) examined the volatility spillover by Diebold and Yilmaz (Citation2012), by analyzing stock indices for 16 regions of BRICS countries to determine the cross-country directional, rolling, gross, net, and net pairwise volatility spillovers. On the contrary, Agyei et al. (Citation2022) considered a newer technique by using the Baruník and Křehlík (Citation2018) (referred to as BK(18)) spillover index to explore time-frequency spillovers between BRIC and G7 equity markets. The UK, France, and Germany are the main transmitter of short-span shocks. The authors further explained that Canada and the United States appeared to be the shock originator towards the BRIC market spillover over the medium term, leaving the UK out. In the long term, the US, Canada, France, and Germany are the risk remitter. To conclude the discussion on volatility spillover, Naeem et al. (Citation2021) studied the Chicago Board Options Exchange (CBOE) to implement a volatility index to estimate the time and frequency of information between financial markets. The study used wavelet correlation (DY, 2012), and BK (2018). The results confirmed the dynamic short- and long-term relevance between the alternative asset classes of the asset class. Moreover, several other studies have confirmed similar results, for instance, across the US equity market (Mensi et al., Citation2021a), emerging markets (Bahloul & Khemakhem, Citation2021), G20 stock markets (Li et al., Citation2021), BRICS equity markets (Chien et al., Citation2021; Hung, Citation2021a; Karim et al., Citation2022; Mensi et al., Citation2021b), the SAARC region (Kotishwar, Citation2021), and Chinese A and B listed stocks (Khalid et al., Citation2021).
Furthermore, Aloui et al. (Citation2022) employed the multivariate GJR-GARCH model within the framework of dynamic conditional correlation (DCC) alongside partial wavelet coherence techniques to assess the impact of the coronavirus on the interconnectivity between Chinese Islamic and conventional stock markets. The findings of the multivariate GJR-GARCH model indicated that the incidence rate of COVID-19 significantly influenced the mean dynamic conditional correlation (DCC) between Islamic and conventional stock markets. Conversely, the cumulative number of recoveries demonstrated no discernible impact on this correlation. Notably, neither factor yielded a statistically significant effect. Numerous studies have explored the phenomenon of spillover effects, albeit many are confined to specific geographic regions. However, Naeem et al. (Citation2022) conducted a comprehensive analysis encompassing 19 countries representing both developed and developing financial markets worldwide, examining the dynamic interaction between sustainable and Islamic investments. Their findings reveal moderate intra-national correlations between sustainable and Islamic investments, alongside limited cross-border linkage within ethical investment domains. A sub-sample analysis focusing on the impact of COVID-19 in North American and European regions further illustrates inter-regional connections, particularly evident in high-frequency bands dominating total returns and volatility spillovers (Geng et al., Citation2021), inclusive of structural disruptions. Casual diversification tests indicate two-way casual diversification across all markets except South Korea and Mexico, with mutual volatility spillovers observed among MIST countries. Consistent with preceding research, Lin and Chen (Citation2021) examined various connectivity indicators to assess information spillover in financial markets using a (TVP)-VAR model. Their results highlight interconnectivity between major financial markets in China and the United States, spanning equity stocks and real estate markets.
Materials and methods
Data and variables
This study utilizes daily closing stock indices from the GCC, BRIC, SAARC, and G7 equity markets. Two distinct sets of market indices are employed: conventional stock indices encompassing Bahrain, Kuwait, Oman, Qatar, Saudi Arabia, the UAE, Pakistan, India, Brazil, Russia, China, Canada, France, Germany, Italy, Japan, the UK, and the USA. Additionally, Islamic stock indices for the selected countries are incorporated, including the FTSE Shariah Index, Refinitiv-Idealratings Islamic Index, S&P Shariah Index, and Islamic Index KMI30. The data collection period (01 January 2012 to 31 December 2021) spans various volatile phases and disruptive events, including significant global incidents such as the oil price crisis, the Brazilian economic crisis, the Russian Financial Crisis of 2014, the Chinese stock market crash of 2015, and the COVID-19 global pandemic of 2019. Thomson Reuters DataStream and investing.com serve as the primary sources for data collection. Spillover effects are estimated and interconnectivity is analyzed through the examination of logarithmic returns and volatilities. (Appendix) provide a comprehensive listing of the selected indices, their respective abbreviations, and the sources of data collection.
Table 1. Interpretations to frequency bands.
Table 2. Conventional stocks return connectedness (Diebold–Yilmaz spillover method (DY-12)).
Methods
Based on the research objective and support from previous literature (Aloui et al., Citation2022; Bahloul & Khemakhem, Citation2021; Chien et al., Citation2021; Hung, Citation2021b; Karim et al., Citation2022; Khalid et al., Citation2021; Kotishwar, Citation2021; Li et al., Citation2021; Mensi et al., Citation2021a; Mensi et al., Citation2021b), this study used two popular methods to analyze the financial connectedness and spillover effect considering the time-and frequency- dependent response functions. These methods have been widely used in empirical studies to understand the interconnectedness and transmission of shocks among different financial markets or regions (Xiao et al., Citation2023; Alsubaie et al., Citation2023; Owusu Junior, Citation2022; Khalid et al., Citation2021; Kotishwar, Citation2021; Aloui et al., Citation2022; Rehman et al., Citation2023).
Diebold and Yilmaz Spillover Index.
Barunik and Kehlik Spillover Index
1. Diebold and Yilmaz (2012) Spillover Index
This study used the connectedness structure developed by Diebold and Yilmaz (2012) to investigate risk spillovers across various stock markets. The method measures the time-dependent spillover index and contagion risk focus of the spillover index using the forecast generalized variance decomposition (FGVD) process in vector autoregression (VAR) models. Furthermore, the method overweighs on other spillover models in several way. For instance, DY-12 provides a straightforward visualization of spillover dynamics through the construction of spillover index metrices, and this allows for the comparison of spillover intensities across different markets. Therefore, it turned out to be sensitive to the choice of variance and covariance estimator, potentially affecting the accuracy of spillover measurements (Diebold & Yilmaz, Citation2012). The process is built on a stationary N-variable covariance generalized VAR framework with lag p.
I
I
Where ‘ i’ is the ith coefficient matrix and Rt = (R1t, R2t…, RNT) denotes volatility in numerous stock’ markets’ 1, 2…, N. White noise,
∼ N (0,
) exists. Let Rt be a stationary covariance procedure assuming that the roots of |
i|, where i = 1, 2…, p, are located outside the unit circle. The vector moving average representation shown below can be used to represent VAR(p):
II
II
where Kh =
Ki − 1 +
Ki − 2 + … +
Ki − p (i = 1, 2, …,
is recursive and remains an N-dimensional unit matrix. The forecast error variance of Rj on the (h = 1, 2, …, H) horizons can be measured using Equation (II) by accounting for market Rk.
The DY method breaks down the variance of the forecast error in the Equation (II). The forecast error ratios in Rj forecast because of market shocks Rk at H-horizon is j, k. When j
k, the pairwise directional spillover from the market ‘k’ to market ‘j’ is denoted by
j, k and can be calculated as:
III
III
In the VAR framework, σkk = (Ʃkk) Represents the standard error of the kth equation, and Kh is an N × N matrix affecting average coefficients with a lag of h. εt is the VAR error term’s non-diagonal covariance matrix of Σε. The standard pairwise spillover from the market ‘k’ to ‘j’ is based on j, k is
IV
IV
Additionally, the construction of the total volatility spillover index is
V
V
where Br denotes the trace operator is denoted by {o}. The total spillover index calculates the variance in the total forecast error caused by volatility shock spillovers across all the markets. Additionally, market ‘j’ receives the following definition of directional spillover from all the other k markets:
VI
VI
The directional spillover from the market’s ‘j’ to all other markets’ ‘k’ is similar.
VII
VII
In addition, we can quickly determine the difference between Equations (VI) and (VII) to determine the net directional spillover of the market ‘j’.
VIII
VIII
2. Barunik and Kehlik (Citation2018) Spillover analysis in the frequency domain:
A frequency response function developed by Barunik and Kehlik (Citation2018) (hereafter referred to as the BK-18) is applied to analyze risk spillovers covering the time horizons (Liu et al., Citation2022). Barunik and Krehlik (BK-18) method is robust to the curse of dimensionality, making it suitable for high-dimensional datasets with many markets. This method allows for incorporating additional features like nonlinearity and time-varying correlations, enhancing the flexibility of spillover analysis. Moreover, it might require more computational resources than simpler spillover measures, especially when dealing with a large dataset. Therefore, the interpretation of spillover results might be more complex due to the high dimensional nature of the analysis, requiring careful consideration and validation of the findings (Shah & Dar, Citation2022). By applying a Fourier transformation to the impulse response Zi, we can obtain (f ()) j, k, which is the ratio of the jth market’s spectrum at frequency
(
(−π, π)) payable shocks in the kth market. The formula is as follows:
IX
IX
The jth market’s frequency share of variance must be weighted into to consider the forecast error variance decomposition for various frequencies. The weighting function is defined as
X
X
which expresses the influence of something at a specific frequency over all other frequencies in the frequency band (−π, π). The frequency band (−π, π). Therefore, the FEVD on the frequency band h=(a, b), a, b (−π, π) and a < b is
XI
XI
In the time domain. Equation (XI) can be transformed into when h→
XII
XII
Further standardization of the GFEVD on frequency bands h = (a, b), a, b (−π, π), and a < b can be further standardized as.
XIII
XIII
The spillover from the market’s ‘k’ to the market’s ‘j’ is measured inside the frequency band h by Following this definition, the frequency spillover effect on the frequency band h is as follows:
XIV
XIV
We compute directional and net spillovers in the same way that Equations does (VI)–(VIII).
In conclusion, Diebold and Yilmaz (DY-12) and Barunik and Krehlik (BK-18) spillover methods are often preferred over the Dynamic Conditional Correlation (DCC) GARCH model due to their ability to comprehensively analyze and visualize spillover effects among multiple markets in high-dimensional settings. These methods offer a faster understanding of the interconnectedness and transmission of shocks across financial markets. While the DCC GARCH model excels at modelling time-varying conditional correlations between pairs of assets, and they lack the scalability, interpretability and flexibility required for analyzing spillovers in large markets (Zhang et al., Citation2020).
Results and discussion
Descriptive statistics
displays the return series for conventional stocks and for Islamic stocks. Except for Oman, we find that the mean returns on conventional stocks are all positive. India recorded the highest mean return of 0.0005, followed by the UAE with a mean return of 0.0005. The UK recorded the lowest average return of 0.000094. At the same time, in Islamic stocks, all mean returns are positive, except for Oman and Brazil, with Qatar recording the highest mean return of 0.0007. Kuwait recorded the lowest average return at 0.00007. Nonetheless, all return series exhibit excess kurtosis, with leptokurtosis and a fat tail for the financial variables. Among conventional stocks, Brazil is the most volatile (as measured by standard deviations), followed by Italy. Among Islamic stocks, Qatar is the most volatile (as indicated by the standard deviations), followed by Brazil. All series show negative skewness in conventional stocks, while all Islamic stocks show negative skewness, except Bahrain and Qatar. The Jarque-B test revealed a non-normal distribution with a 0.00 probability of all the series in both Conventional and Islamic stocks. When kurtosis is high, the probability of high yields is higher than in a normally distributed series.
We further investigated the data stationarity variables using the unit root test of the augmented Dickey-Fuller (ADF) stationary test, and demonstrate that all variables are stationary at level. demonstrate the pairwise correlation between the Conventional and Islamic stock asset prices. Data from this analysis were not normally distributed. For conventional and Islamic stocks, all pairwise correlations are significant at the 1% level and are positive, negative, or neither. In conventional stocks, France and Germany have the strongest pairwise correlation (.975), followed by Russia and the USA. (.971), and Russia-India (.974), implying that they are less efficient. In contrast, for Islamic stocks, Japan and the USA have the strongest pairwise correlation (.954), followed by Italy-USA (.939). In Conventional stocks, there is a weak pairwise correlation between Oman-Pakistan (.183) and Bahrain-Pakistan (.193), while in Islamic stocks, there is a weak pairwise correlation between Canada-UK (.004) and Oman-Brazil (.019), implying the benefits of diversification between Bahrain, Oman, Pakistan, Canada, the UK, and Brazil. Overall, it is clear that France has a relatively strong association with conventional stocks in the majority of BRIC and G7 nations, while the USA has a fairly strong pairwise correlation with most SAARC and G7 nations in Islamic stocks. In contrast, Oman had the lowest and most negative pairwise correlations with almost all nations. This means that the Oman stock market offers a good opportunity to diversify and hedge assets, although it is less successful than the stock markets of France and the USA.
Table 3. Barunik–Krehlik spillover method (BK-18) – spillover band: 3.14–0.79; corresponds to 1–4 days (short term).
Table 4. Baruník–Krehlík spillover method (BK-18) – Spillover band: 0.79–0.31; corresponds to 4–10 days (medium term).
Time- and frequency-domain analysis
This section presents the results of the DY-12 time-domain and BK-18 frequency-domain connectedness. Return and volatility spillovers over time were calculated using the VAR model. Using the DY-12, generalized variance decomposition was used to build the volatility and spillover as shown in . We used the generalized variance decomposition of variances to assess the magnitude and direction of variation in the temporal domain across a set of markets. Meanwhile, the spillover is divided into three separate frequency bands using the BK-18 frequency domain technique (following (Mensi et al., Citation2023)). The three frequency ranges are defined as follows: short-term (one week to four days), medium-term (four days to ten days), and long-term (ten days to infinity, or one year). Consistent with Mensi et al. (2023), based on a 200-day rolling window size, we evaluated the dynamic connectivity. The BK-18 system also uses a 100-day forecast horizon, although it is not dependent on it.
Static connectedness
present the empirical findings of the impact on return and volatility of conventional stocks while, present the Islamic stocks, respectively. The results for the DY-12 approach are shown in , , , , and the estimates for the BK-18 method for the three frequency bands are shown in , , , . From row to column, the cross-market spillover effect can be shown, showing the directional spillovers from market i-th to market j-th and vice versa. The overall spillover index from all other variables is indicated by the last value in the last column in , , , .
Table 5. Baruník–Krehlík spillover method (BK-18)—spillover band: 0.31–0.00; corresponds to 10 days to infinite days (long term).
Table 6. Conventional stocks volatility connectedness – Diebold–Yilmaz spillover method (DY-12).
Table 7. Baruník–Krehlík spillover method (BK-18)—spillover band: 3.14–0.79; corresponds to 1–4 days (short term).
Table 8. Baruník–Krehlík spillover method (BK-18)—spillover band: 0.79–0.31; corresponds to 4–10 days (medium term).
Table 9. Baruník–Krehlík spillover method (BK-18)—spillover band: 0.31–0.00; corresponds to 10 days to infinite days (long term).
Table 10. Islamic stocks return connectedness – Diebold–Yilmaz spillover method (DY-12).
Table 11. Baruník–Krehlík spillover method (BK-18)—spillover band: 3.14–0.79; corresponds to 1–4 days (short term).
Table 12. Baruník–Krehlík spillover method (BK-18)—spillover band: 0.79–0.31; corresponds to 4 days to 10 days (medium term).
Table 13. Baruník–Krehlík spillover method (BK-18)—spillover band: 0.31–0.00; corresponds to 10 days to infinite days (long term).
Table 14. Islamic stocks volatility connectedness - Diebold–Yilmaz spillover method (DY-12).
Table 15. Baruník–Krehlík spillover method (BK-18)—spillover band: 3.14–0.79; corresponds to 1–4 days (short term).
Table 16. Baruník–Krehlík spillover method (BK-18)—spillover band: 0.79–0.31; corresponds to 4–10 days (medium term).
Table 17. Baruník–Krehlík spillover method (BK-18)—spillover band: 0.31–0.00; corresponds to 10 days to infinite days (long term).
The overall frequency connectedness for the three frequency bands is provided by the last value in the second-to-last column of , , , & , ‘FROM-ABS’, where adding these three parts equals the total connectedness index of ‘FROM’ in , , , . The unweighted connectivity from the variable inside its corresponding band, as opposed to outside, is presented by ‘FROM-WTH’. The ‘TO’ in , , , , ‘TO-ABS’ in , , , & , and ‘TO-WTH’ represent the unweighted connectivity to other variables that are inside its frequency range, respectively. A positive (negative) value indicates the transmitter (receiver) of returns and volatility to (from) the other markets. Finally, ‘NET-ABS’ determines the difference between the ‘TO-ABS’ row and the ‘FROM-ABS’ column.
In , , , , we provide the time-domain findings obtained using the DY-12 approach, followed by the frequency-domain results obtained using the BK-18 method for the short-, medium-, and long-term in , , , & , respectively. As indicated in & , the overall interconnectivity in returns reaches 23.83% for conventional stocks, 25.5% for volatility, whereas 44.3% for Islamic stocks, and 34.29% for volatility in & . This suggests that compared to conventional stocks, stock market returns for Islamic stocks are more closely linked. In , , , & , conventional stocks’ short-, medium-, and long-term frequency connectedness for returns is 14.48, 5.30, and 4.05%, respectively, while Islamic stocks’ short-, medium-, and long-term frequency connectedness for returns is 28.77, 9.44, and 6.09%, respectively (higher frequency lowers the returns spillover), indicating that return spillovers from one market that is transmitted to other markets only have short-term effects.
Additionally, according to the results of & and & analysis of volatility spillover, the frequency spillover (FROM-ABS) for conventional stocks over the short, medium, and long terms is 0.74, 1.76, and 22.99%, respectively, whereas the corresponding figures for Islamic stocks are 2.04, 3.84, and 28.40% (the higher the frequency, the greater the volatility spillover). The corresponding figures for whole period, medium-term, long-term connectedness is given in Appendix in . However, contrary to the return spillover, the volatility spillover from one market spreads to other markets and is initiated by effects that last for a long period.
. According to conventional stocks, the USA (4.18%) and Brazil (2.62%) are the largest transmitters and recipients of spillovers in the temporal domain. The largest net transmitter of return spillover to other markets is the USA stock market, followed by Russia and Japan. The highest net recipients of return spillover are Canada, the United Kingdom, and Italy. In , the total spillovers in the short-term frequency, a high level of spillovers is found among the markets of the United States, Brazil, and France. The United States and Brazil continue to be the top net transmitters of stock returns in the medium and long term, while Canada is the top receiver in the short and medium term and France is the top receiver in the long term. Islamic equity stock markets also show that, in the temporal domain, France (6.42%) and the United Kingdom (6.36%) are the top transmitters and receivers of spillovers. The French stock market, followed by Germany and Italy, is the largest transmitter of return spillover to other markets. The United States, India, and China are the top recipients of return overflow. show short-term spillovers between the French and British markets. In the medium- and long-term frequencies, France remains the top transmitter of stock returns, while the United States is the top receiver in the short-, medium-, and long-term frequencies.
Similarly, show that the highest volatility spillovers at all frequencies: France in the short-term (0.18%), USA in the medium-and long-term (0.17, 3.75%). According to , France contributes the most to volatility spillovers at all frequencies: short-term (0.29%), medium-term (0.58%), and long-term (4.91%). indicate conventional stock market returns and volatility, in which the USA significantly contributes to spillover to other countries. By contrast, indicate Islamic stock market returns and volatility, in which France significantly contributes to spillover to other countries. Our evidence is supported by Bossman et al. (Citation2022), who show stock market integration between the USA in Conventional and France in Islamic stock markets throughout the crisis. Our findings are also close to those of Bossman et al. (Citation2022), who identified Canada as the largest net shock recipient and the USA as the country that contributes the most spillovers.
Dynamic overall spillover
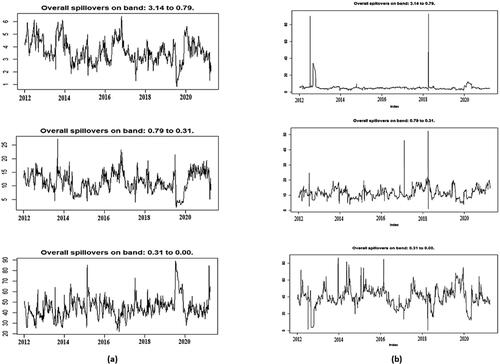
From the return overall spillover indices for all the studied markets (), the return spillovers in Islamic stocks are much higher than those in conventional stocks, and we find that the magnitude of volatility spillovers increases with increasing frequencies. Thus, volatility spillovers () are lower in the short-, medium-, and long-term horizons. For instance, the volatility spillover within the first band, 3.14 ∼ 0.79, which approximates 1 ∼ 4 days, is 0.74%, which increases to 1.76 and 22.99% in conventional stocks, and 2.04%, which increases to 3.84 and 28.40% in Islamic stocks, respectively, through the second to third (0.79 ∼ 0.00) spillover/frequency bands. Our findings are consistent with (Alsubaie et al., Citation2023), who used a similar methodology and found that short-term return spillovers are more significant than medium-term spillovers for Islamic and conventional (G7) markets, respectively, indicating that short-term return spillovers are more significant than medium-term and long-term spillovers for Islamic and conventional (Global) markets (Alsubaie et al., Citation2023) ().
Figure 1. (a) Conventional stocks return spillovers. (b) Islamic stocks return spillovers.
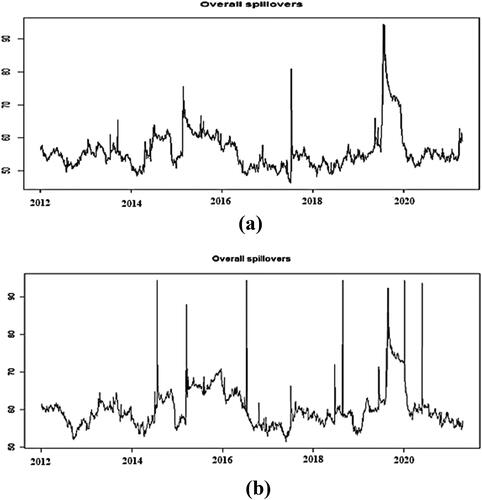
Figure 2. (a) Conventional stock volatility spillovers. (b) Islamic stocks volatility spillovers.
Dynamic returns spillover
Dynamic volatility spillovers
Conclusion and policy implications
This study investigated the returns and volatility spillover of conventional equity stock markets and Islamic equity stock markets (Bahrain, Kuwait, Oman, Qatar, Saudia, UAE, Pakistan, India, Brazil, Russia, China, Canada, France, Germany, Italy, Japan, UK, and USA) from (developed, emerging, and frontier markets) and used daily data ranging from 01 January 2012 to 31 December 2021, considering the two major economic crisis that including Oil crisis and pandemic.
The static analysis results show that the total return spillover among conventional stock indices indicates a weak level of interconnectedness. In contrast, the total return among Islamic stock indices indicates a strong level of interconnectedness. Among conventional stock indices, the USA is the highest, and China is the lowest net transmitter of shocks under different periods. In addition, Canada is the highest, and Oman is the lowest net recipient of shocks to other countries. The total volatility spillover among conventional stock market indices is weaker among and suggests a diversification benefit in making a portfolio investment in conventional stock markets. Using a Time and frequency-domain methodology, we found evidence that return spillovers mainly occur in Islamic stocks. In contrast, overall volatility spillover is more pronounced in the long term in Islamic stocks. Most of the spikes in total return spillovers correspond to global events, namely the 2014 Russian Financial crisis, the 2014–2017 Brazilian economic crises, the 2014–2015 crude oil crises, and the 2019–2020 Coronavirus disease. We also recognized that the USA stock market acts primarily as the top transmitter in returns and volatilities for other countries (conventional stocks), especially during the economic crisis. Russia Islamic index (Russia FTSE Shariah index) performs well in returns and volatility from the conventional index (IMOEX) because the IMOEX index declined 8.1% at one point before ending the day higher during the Russian crisis. The 60% decline in the price of crude from 2014 to 2015 has been the remarkable growth of U.S. tight oil production. In the wake of falling oil prices, conventional stock countries such as Saudi Arabia, Oman, Bahrain, UAE, Kuwait, and Qatar, whose economies rely heavily on exporting oil, often suffered greater losses and were highly affected. Still, declining oil prices have less affected Qatar Islamic index (TRQAPI). The effect of the Coronavirus disease on directional spillovers amongst Conventional and Islamic countries, known as the GCC, SAARC, BRIC, and G7, was examined. Our study examines the return and volatility spillovers among Conventional and Islamic stock markets from time-domain (DY12) and frequency-domain (BK18) perspectives. We demonstrated that the pandemic had a greater impact on the return and volatility of conventional and Islamic stock markets, except Qatar, where the Qatar Islamic index (TRQAPI) was the least affected during the COVID-19.
Investors stand to benefit significantly from the results. Spillovers show variability over time, which is an important factor for equities investors to consider. During energy crises and health crises, such as the COVID-19 pandemic, investors might use insights into market patterns and volatility to hedge against anticipated stock return losses, particularly in the short term (within four trading days), when spillover effects are most prominent. When estimating stock price volatility and building equity portfolios, portfolio managers must consider the implications of policy changes resulting from market shocks like energy crises and the COVID-19 pandemic. Furthermore, during times of financial instability, officials must actively watch spillover effects, which can disrupt cross-market relationships, prompting immediate action to restore financial markets and limit crisis implications on the broader economy.
Portfolio managers and policymakers can make better decisions by analyzing data on the frequency and dynamics of spillover intensities and directions. Understanding the findings from financial connectedness analyses emphasizes the importance of understanding the dynamic interrelationships across different time horizons for the ideal asset management strategies. For both international investors and portfolio managers, timely portfolio rebalancing is critical in capitalizing on diversification, safe haven assets, and hedging between Islamic and conventional stocks. Similarly, regulatory bodies can attract international investment by implementing timely interventions based on optimal policy impact forecasts for financial markets.
Author contributions
Moghis Ur Rehman: Investigation, writing – original draft, Writing – review & editing. Adil Saleem: Conceptualization, Validation, Formal analysis, Investigation, Methodology, Software, Resources, Data curation, Writing – original draft, Project administration. Judit Sagi: Review & Editing, Validation, Supervision, Funding acquisition, Final Approval.
Acknowledgment
No funding was received.
Disclosure statement
No potential conflict of interest was reported by the author(s).
Data availability statement
On behalf of all authors, the corresponding author states the data will be available on demand.
Additional information
Notes on contributors
Moghis Ur Rehman
Moghis Ur Rehman successfully finished his Masters in Finance from University of Management and Technology, Lahore, Pakistan. His prime goal is to seek PhD opportunities in world’s renowned university in the field of finance and establish a long-term career in academia.
Adil Saleem
Dr. Adil Saleem holds PhD in Management and Business Administration (specializing in Finance) from Hungarian University of Agriculture and Life Sciences (formerly Szent Istvan University), Hungary. He has 9 years of academic and industry experience including teaching, research, and banking. His area of research includes Islamic financial markets, Stochastic Modelling, Finance-growth nexus, and ESG performance. Prior to joining the PhD program, Adil served Virtual University of Pakistan – the public sector university as Lecturer of Banking and Finance for four years followed by an experience of a leading Islamic commercial bank for 3 years. Besides, Dr. Adil likes travelling, playing musical instruments, ping-pong, cycling, and take part in social work.
Judit Sági
Dr. Judit Sági Associate professor at Budapest Business University - University of Applied Sciences in Hungary, Deputy dean for research affairs at the Faculty of Finance and Accountancy. Leader of the Financial Services specialization. Visiting professor, with track record in several European universities, mainly for full courses in Banking and Finance.
References
- Adekoya, O. B., Oliyide, J. A., & Tiwari, A. K. (2022). Risk transmissions between sectoral Islamic and conventional stock markets during COVID-19 pandemic: What matters more between actual COVID-19 occurrence and speculative and sentiment factors? Borsa Istanbul Review, 22(2), 363–376. https://doi.org/10.1016/j.bir.2021.06.002
- Agyei, S. K., Owusu Junior, P., Bossman, A., Asafo-Adjei, E., Asiamah, O., & Adam, A. M. (2022). Spillovers and contagion between BRIC and G7 markets: New evidence from time-frequency analysis. PLOS One, 17(7), e0271088. https://doi.org/10.1371/journal.pone.0271088
- Ahmad, W., Kutan, A. M., & Gupta, S. (2021). Black swan events and COVID-19 outbreak: Sector level evidence from the US, UK, and European stock markets. International Review of Economics & Finance, 75, 546–557. https://doi.org/10.1016/j.iref.2021.04.007
- Ali, K., Ashfaque, M., Saleem, A., Bárczi, J., & Sági, J. (2022). Did the Islamic stock index provide shelter for investors during the COVID-19 crisis? Evidence from an emerging stock market. Risks, 10(6), 109. https://doi.org/10.3390/risks10060109
- Ali, S. R. M., Mensi, W., Anik, K. I., Rahman, M., & Kang, S. H. J. E. A. (2022). The impacts of COVID-19 crisis on spillovers between the oil and stock markets: Evidence from the largest oil importers and exporters. Economic Analysis and Policy, 73, 345–372. https://doi.org/10.1016/j.eap.2021.11.009
- Aloui, C., Asadov, A., Al-Kayed, L., Hkiri, B., & Danila, N. (2022). Impact of the COVID-19 outbreak and its related announcements on the Chinese conventional and Islamic stocks’ connectedness. The North American Journal of Economics and Finance, 59, 101585. https://doi.org/10.1016/j.najef.2021.101585
- Alsubaie, S. M., Mahmoud, K. H., Asafo-Adjei, E., & Bossman, A. (2023). Time-frequency connectedness between Shariah indices in a systemic crisis era. Complexity, 2023, 1–17. https://doi.org/10.1155/2023/5602895
- Ansell, C., & Boin, A. (2019). Taming deep uncertainty: The potential of pragmatist principles for understanding and improving strategic crisis management. Administration & Society, 51(7), 1079–1112. https://doi.org/10.1177/0095399717747655
- Aslam, F., Ferreira, P., Ali, H., Oliveira, M., & Arifa. (2023). Islamic vs. conventional equity markets: A multifractal cross-correlation analysis with economic policy uncertainty. Economies, 11(1), 16. https://doi.org/10.3390/economies11010016
- Aziz, T., Marwat, J., Mustafa, S., Zeeshan, A., & Iqbal, Y. (2021). Linkage between US financial uncertainty and stock markets of SAARC countries. The Journal of Asian Finance, Economics and Business, 8(2), 747–757.
- Bahloul, S., & Khemakhem, I. (2021). Dynamic return and volatility connectedness between commodities and Islamic stock market indices. Resources Policy, 71, 101993. https://doi.org/10.1016/j.resourpol.2021.101993
- Baruník, J., & Křehlík, T. (2018). Measuring the Frequency Dynamics of Financial Connectedness and Systemic Risk*. Journal of Financial Econometrics, 16(2), 271–296. https://doi.org/10.1093/jjfinec/nby001
- Basher, S. A., Haug, A. A., & Sadorsky, P. (2018). The impact of oil-market shocks on stock returns in major oil-exporting countries. Journal of International Money and Finance, 86, 264–280. https://doi.org/10.1016/j.jimonfin.2018.05.003
- Bossman, A., Junior, P. O., & Tiwari, A. K. (2022). Dynamic connectedness and spillovers between Islamic and conventional stock markets: time-and frequency-domain approach in COVID-19 era. Heliyon, 8(4), e09215. https://doi.org/10.1016/j.heliyon.2022.e09215
- Chien, F., Sadiq, M., Kamran, H. W., Nawaz, M. A., Hussain, M. S., & Raza, M. (2021). Co-movement of energy prices and stock market return: Environmental wavelet nexus of COVID-19 pandemic from the USA, Europe, and China. Environmental Science and Pollution Research, 28(25), 32359–32373. https://doi.org/10.1007/s11356-021-12938-2
- Chowdhury, M. I. H., Balli, F., & de Bruin, A. (2022). Islamic equity markets versus their conventional counterparts in the COVID−19 age: Reaction, resilience, and recovery. International Review of Finance, 22(2), 315–324. https://doi.org/10.1111/irfi.12349
- Diebold, F. X., & Yilmaz, K. (2012). Better to give than to receive: Predictive directional measurement of volatility spillovers. International Journal of Forecasting, 28(1), 57–66. https://doi.org/10.1016/j.ijforecast.2011.02.006
- Geng, J.-B., Chen, F.-R., Ji, Q., & Liu, B.-Y. (2021). Network connectedness between natural gas markets, uncertainty and stock markets. Energy Economics, 95, 105001. https://doi.org/10.1016/j.eneco.2020.105001
- Hamid, K., Akash, R. S. I., & Ghafoor, M. M. (2019). Testing of volatility spillovers dynamics and network connectedness between Islamic indices of regional stock markets. Global Regional Review, IV(I), 128–137. https://doi.org/10.31703/grr.2019(IV-I).15
- Hamid, K., Ghafoor, M. M., & Saeed, M. Y. (2020). Emerging markets and volatility spillover effects: Empirical evidence from regional emerging economies of Pakistan, China, India, and Bangladesh. Global Economics Review, V(I), 102–116. https://doi.org/10.31703/ger.2020(V-I).09
- Hasan, M. B., Mahi, M., Hassan, M. K., & Bhuiyan, A. B. (2021). Impact of COVID-19 pandemic on stock markets: Conventional vs. Islamic indices using wavelet-based multi-timescales analysis. The North American Journal of Economics and Finance, 58, 101504. https://doi.org/10.1016/j.najef.2021.101504
- Hassan, M. K., Chowdhury, M. I. H., Balli, F., & Hasan, R. (2022). A note on COVID-19 instigated maximum drawdown in Islamic markets versus conventional counterparts. Finance Research Letters, 46, 102426. https://doi.org/10.1016/j.frl.2021.102426
- Hung, N. T. (2021a). Directional spillover effects between BRICS stock markets and economic policy uncertainty. Asia-Pacific Financial Markets, 28(3), 429–448. https://doi.org/10.1007/s10690-020-09328-y
- Hung, N. T. (2021b). Financial connectedness of GCC emerging stock markets. Eurasian Economic Review, 11(4), 753–773. https://doi.org/10.1007/s40822-021-00185-2
- Kang, S. H., Uddin, G. S., Troster, V., & Yoon, S.-M. (2019). Directional spillover effects between ASEAN and world stock markets. Journal of Multinational Financial Management, 52–53, 100592. https://doi.org/10.1016/j.mulfin.2019.100592
- Karim, M. M., Chowdhury, M. A. F., & Masih, M. (2022). Re-examining oil and BRICS’stock markets: New evidence from wavelet and MGARCH-DCC. Macroeconomics and Finance in Emerging Market Economies, 15(2), 196–214. https://doi.org/10.1080/17520843.2020.1861047
- Khalid, H. M., Farooq, S., Liaqat, F., & Naeem, M. (2021). Assessment of return and volatility spillover across sectors’ indices: Evidence from Pakistan stock exchange. International Journal of Monetary Economics and Finance, 14(5), 477–496. https://doi.org/10.1504/IJMEF.2021.118281
- Kindleberger, C. P., Aliber, R. Z., & Solow, R. M. (2005). Manias, panics, and crashes: A history of financial crises (Vol. 7). Palgrave Macmillan.
- Kotishwar, A. (2021). Global markets effect on stock market volatility with reference to SAARC nations–a study. A Kotishwar, global markets effect on stock market volatility with reference to SAARC nations–a study. International Journal of Management, 11(12), 2020.
- Lewis, W. A., & Kindleberger, C. P. (1979). Manias, panics and crashes: a history of financial crises. Journal of Interdisciplinary History, 10(2), 356. https://doi.org/10.2307/203353
- Li, Y., Zhuang, X., Wang, J., & Dong, Z. (2021). Analysis of the impact of COVID-19 pandemic on G20 stock markets. The North American Journal of Economics and Finance, 58, 101530. https://doi.org/10.1016/j.najef.2021.101530
- Lin, S., & Chen, S. (2021). Dynamic connectedness of major financial markets in China and America. International Review of Economics & Finance, 75, 646–656. https://doi.org/10.1016/j.iref.2021.04.033
- Liu, Y., Wei, Y., Wang, Q., & Liu, Y. (2022). International stock market risk contagion during the COVID-19 pandemic. Finance Research Letters, 45, 102145. https://doi.org/10.1016/j.frl.2021.102145
- Mensi, W., Gubareva, M., Ko, H. U., Vo, X. V., & Kang, S. H. (2023). Tail spillover effects between cryptocurrencies and uncertainty in the gold, oil, and stock markets. Financial Innovation, 9, 92, https://doi.org/10.1186/s40854-023-00498-y
- Mensi, W., Boubaker, F. Z., Al-Yahyaee, K. H., & Kang, S. H. (2018). Dynamic volatility spillovers and connectedness between global, regional, and GIPSI stock markets. Finance Research Letters, 25, 230–238. https://doi.org/10.1016/j.frl.2017.10.032
- Mensi, W., Nekhili, R., Vo, X. V., Suleman, T., & Kang, S. H. (2021a). Asymmetric volatility connectedness among US stock sectors. The North American Journal of Economics and Finance, 56, 101327. https://doi.org/10.1016/j.najef.2020.101327
- Mensi, W., Rehman, M. U., Maitra, D., Al-Yahyaee, K. H., & Vo, X. V. (2021b). Oil, natural gas and BRICS stock markets: Evidence of systemic risks and co-movements in the time-frequency domain. Resources Policy, 72, 102062. https://doi.org/10.1016/j.resourpol.2021.102062
- Naeem, M. A., Farid, S., Arif, M., Paltrinieri, A., & Alharthi, M. (2022). COVID-19 and connectedness between sustainable and Islamic equity markets. Borsa Istanbul Review, 23(1), 1–21. https://doi.org/10.1016/j.bir.2022.06.001
- Naeem, M. A., Qureshi, F., Farid, S., Tiwari, A. K., & Elheddad, M. (2021). Time-frequency information transmission among financial markets: Evidence from implied volatility. Annals of Operations Research, 334(1-3), 701–729. https://doi.org/10.1007/s10479-021-04266-y
- Owusu Junior, P. (2022). Dynamic connectedness, spillovers, and delayed contagion between Islamic and conventional bond markets: Time-and frequency-domain approach in COVID-19 era. Discrete Dynamics in Nature and Society, 2022, 1–18. https://doi.org/10.1155/2022/1606314
- Panda, P., Vasudevan, S., & Panda, B. (2021). Dynamic connectedness among BRICS and major countries stock markets. Journal of Public Affairs, 21(3), e2265. https://doi.org/10.1002/pa.2265
- Rehman, M. U., Khursheed, Z., & Ali, M. K. (2023). Time-frequency volatility spillovers of conventional stock markets: Evidence from developed, emerging, and frontier markets. Journal of Finance and Accounting Research, 5(1), 1–29. https://doi.org/10.32350/jfar.51.01
- Saleem, A., Bárczi, J., & Sági, J. (2021). Covid-19 and Islamic stock index: Evidence of market behavior and volatility persistence. Journal of Risk and Financial Management, 14(8), 389. https://doi.org/10.3390/jrfm14080389
- Setiawan, B., Afin, R., Wikurendra, E. A., Nathan, R. J., & Fekete-Farkas, M. (2022). Covid-19 pandemic, asset prices, risks, and their convergence: A survey of Islamic and G7 stock market, and alternative assets. Borsa Istanbul Review, 22, S47–S59. https://doi.org/10.1016/j.bir.2022.11.011
- Sevinç, D. (2022). Volatility spillovers among MIST stock markets. Data Science in Finance and Economics, 2(2), 80–95. https://doi.org/10.3934/DSFE.2022004
- Shah, A. A., & Dar, A. B. (2022). Asymmetric, time and frequency-based spillover transmission in financial and commodity markets. The Journal of Economic Asymmetries, 25, e00241. https://doi.org/10.1016/j.jeca.2022.e00241
- Suleman, M. T., McIver, R., & Kang, S. H. (2021). Asymmetric volatility connectedness between Islamic stock and commodity markets. Global Finance Journal, 49, 100653. https://doi.org/10.1016/j.gfj.2021.100653
- Taera, E. G., Setiawan, B., Saleem, A., Wahyuni, A. S., Chang, D. K., Nathan, R. J., & Lakner, Z. (2023). The impact of Covid-19 and Russia–Ukraine war on the financial asset volatility: Evidence from equity, cryptocurrency and alternative assets. Journal of Open Innovation: Technology, Market, and Complexity, 9(3), 100116. https://doi.org/10.1016/j.joitmc.2023.100116
- Xiao, Y., Dong, Z., Huang, S., Li, Y., Wang, J., & Zhuang, X. (2023). Time-frequency volatility spillovers among major international financial markets: Perspective from global extreme events. Discrete Dynamics in Nature and Society, 2023, 1–20. https://doi.org/10.1155/2023/7200306
- Zahid, R. A., Ali, Q., Saleem, A., & Sági, J. (2023). Impact of geographical, meteorological, demographic, and economic indicators on the trend of COVID-19: A global evidence from 202 affected countries. Heliyon, 9(9), e19365. https://doi.org/10.1016/j.heliyon.2023.e19365
- Zhang, W., Zhuang, X., & Wu, D. (2020). Spatial connectedness of volatility spillovers in G20 stock markets: Based on block models analysis. Finance Research Letters, 34, 101274. https://doi.org/10.1016/j.frl.2019.08.022
Appendix A
Figure A1. (a) Conventional stocks correlation. (b) Islamic stocks correlation. Note. Correlation heat map. This graph displays a matrix of price correlations for the GCC, SAARC, BRIC, and G7. The color intensity of the shaded boxes indicates the magnitude of the correlations. Blue denotes positive correlation, whereas red denotes negative correlation. All correlations were significant at 1% level.
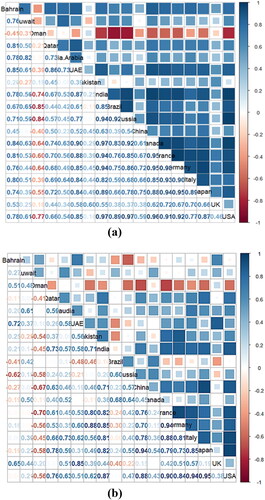
Figure A2. (a) Time series plot for conventional stocks. (b) Time series plot for Islamic stocks. Note. describe the market prices for the financial markets of GCC, SAARC, BRIC, and G7.
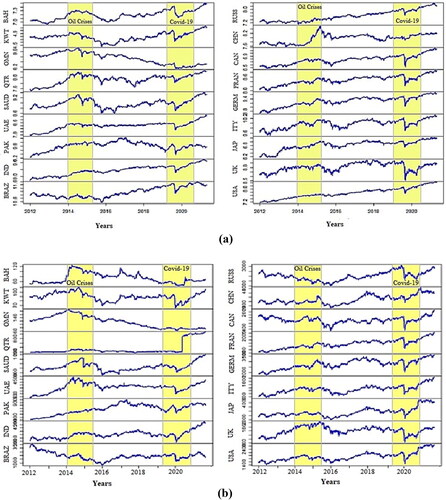
Figure A3. (a) Dynamics for conventional stocks return. (b) Dynamics for Islamic stocks return. Note. describe the market returns for the GCC, SAARC, BRIC, and G7 financial markets.
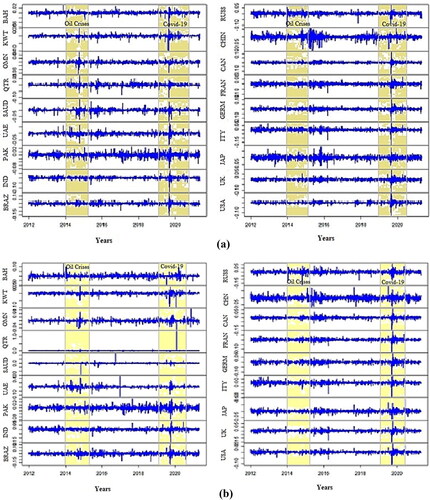
Figure A4. (a) Dynamics for conventional stock market volatility. (b) Dynamics for Islamic stock market volatility. Note. describe the market volatility for the GCC, SAARC, BRIC, and G7 financial markets.
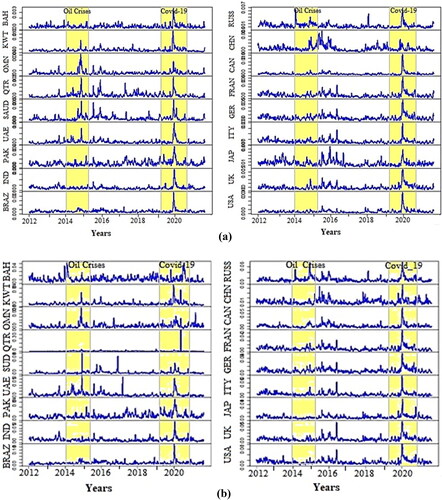
Figure A5. (a) Conventional stock markets, short-term. (b) Conventional stock markets, medium-term. (c) Conventional stock markets, Long-term. Note. describe the BK-18 return spillovers with short-, medium-, and long-term frequency bands. The weighted red circle describes the net transmitter of shocks to other markets, whereas the weighted green circle describes the net receiver of shocks from other markets. The weighted edges describe the highest and lowest return spillovers, respectively.
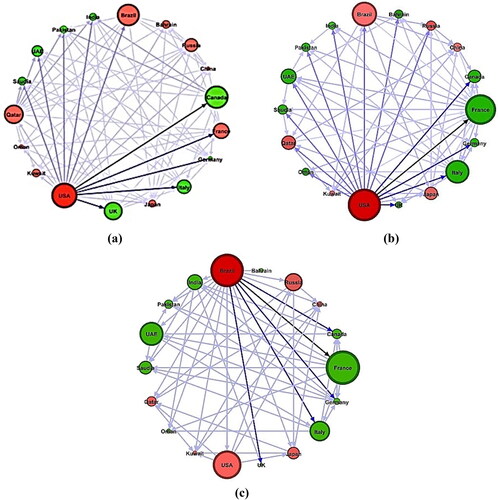
Figure A6. (a) Islamic stock markets, short-term. (b) Islamic stock markets, medium-term. (c) Islamic stock markets, long-term. Note. describe the BK-18 return spillovers with short-, medium-, and long-term frequency bands. The weighted red circle describes the net transmitter of shocks to other markets, whereas the weighted green circle describes the net receiver of shocks from other markets. The weighted edges describe the highest and lowest return spillovers, respectively.
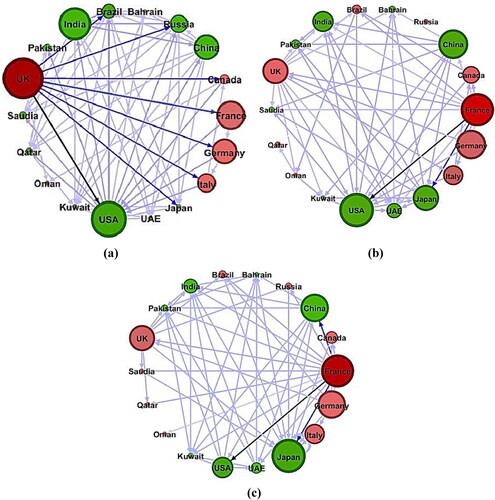
Figure A7. (a) Conventional stock markets, short-term. (b) Conventional stock markets, medium-term. (c) Conventional stock markets, long-term. Note. describe the BK-18 volatility spillovers with short-, medium-, and long-term frequency bands. The weighted red circle describes the net transmitter of shocks to other markets, whereas the weighted green circle describes the net receiver of shocks from other markets. The weighted edge describes the highest and lowest volatility spillovers.
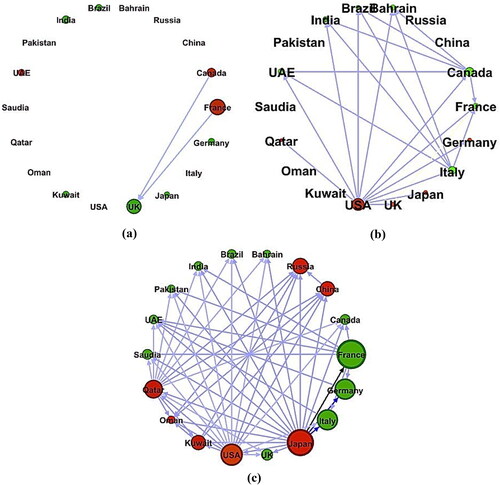
Figure A8. (a) Islamic stock markets, short-term. (b) Islamic stock markets, medium-term. (c) Islamic stock markets, long-term. Note. describe the BK-18 volatility spillovers with frequency bands, short-, medium-, and long-term. Weighted Red circle describe the net transmitter of shocks to other markets, while the weighted green circle describes the net receiver of shocks from other markets. Weighted edge describes the highest and lowest volatility spillovers.
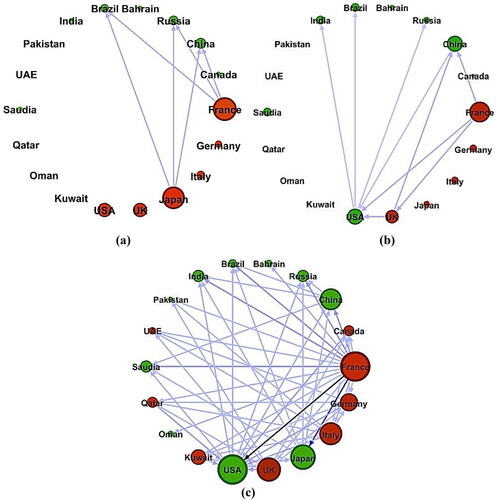
Table A1. Conventional equity stock market indices.
Table A2. Islamic equity stock market indices.
Table A3. Descriptive statistics of conventional stock market.
Table A4. Descriptive statistics of Islamic stock market.