
 ?Mathematical formulae have been encoded as MathML and are displayed in this HTML version using MathJax in order to improve their display. Uncheck the box to turn MathJax off. This feature requires Javascript. Click on a formula to zoom.
Abstract
Financial Inclusion (FI) is one of the most important indicators of inclusive growth of an economy. This paper examines the status of FI in India by constructing a comprehensive financial inclusion index (FII). The data analysis indicates that states such as Goa, Kerala, Tamil Nadu, Maharashtra, and Telangana performed well in FI. Further, a panel data regression model is estimated to know the determinants of financial inclusion in 27 Indian States for the period 2005 to 2020. The composite index can be used to monitor and assess financial inclusion over time and at the grass root level also. The estimated results show that per capita NSDP, literacy rate, urban population share, road length, and number of factories are perhaps the most important financial inclusion determinants. The novelty of this study is to provide a comprehensive understanding of financial inclusion levels across different states in India for two-decade period along with rural and urban financial inclusion levels.
Impact statement
The study serves as a critical resource for understanding the dynamics of financial inclusion in India for the two decades period and offers valuable insights for policymakers by identifying key determinants and guide the development of targeted policies aimed at improving financial inclusion, which is essential for economic growth and development.
Reviewing Editor:
Introduction
Financial inclusion (FI) aims to include vulnerable and weaker segments of society in the traditional banking system. It aids the vulnerable groups, including weaker sections and low-income groups, to obtain timely and adequate credit and other financial services at a reasonable cost. In the last ten years, many developing countries declared attaining financial inclusion as their primary objective. This is because it is just as vital as social inclusion and inclusive growth. International policymakers and central bankers meet at different events to discuss "financial inclusion" and create a more financially inclusive economy (World Bank, Citation2013; Hannig, Citation2014). Universal Financial Access by 2020, is a plan by the World Bank, G20 countries’ Global Partnership for Financial Inclusion (GPFI, Citation2014) is another initiative to encourage financial inclusion. In the US, the Community Reinvestment Act of 1997. The French Exclusion Law of 1998, In the UK, the Financial Inclusion Task Force, Mzansi, 2004 in South Africa, The Reserve Bank of India’s "no-frills" accounts and "General Credit Card" programs highlight the need of financial inclusion.
FI is the process of ensuring that vulnerable groups, such as the weaker segment and low-income groups, have affordable access to financial services and credits when needed (Rangarajan Committee, Citation2008). According to the World Bank’s Global Financial Database 2017, a significant portion of the population remains financially excluded (Demirguc-Kunt et al., Citation2018). Financial inclusion in India is promoted through the Pradhan Mantri Jan Dhan Yojana (PMJDY), a program of the central government. India, however, is in its nascent state compared to other developed nations.
The World Bank’s Findex survey reports that almost 1.4 billion persons lack access to banking Pomeroy (Citation2022). It is difficult for them to borrow money, save money, transfer money, or launch a business because of this lack of access.
The policy has focused on boosting financial inclusion over the last 20 years, and significant improvements have been observed. The overall number of bank accounts in India increased from 35 percent in 2011 to 53 percent in 2014 and 80 percent in 2017, according to the World Bank’s Global Findex dataset for 2021. This growth may have been caused primarily by the launch of the Pradhan Mantri Jan Dhan Yojana (PMJDY) initiative in 2014. Additionally, the proportion of persons who kept savings in a financial institution increased with time, rising from 12 percent in 2011 to 14 percent in 2014 to 20 percent in 2017. But with the outbreak of the pandemic in 2020, progress slowed down. In 2021, it was noted that both account ownership and the percentage of people saving their money decreased to 77 percent and 13 percent respectively (Demirgüc-Kunt et al., Citation2022).
Since 2011, India’s percentage of adults with a formal account with a financial institution has increased by more than double, reaching 80 percent. The formal saving and borrowing rates in India have remained low despite the focused program of financial inclusion known as Prime Minister Jan Dhan Yojana (PMJDY). According to the 59th NSSO study, financial inclusion is low in the eastern, northeastern, and central regions. To understand the diversities in financial inclusion across the Indian States, an in-depth examination of financial inclusion, determining factors and barriers is to be carried out. One of the important ways to measure the progress of financial inclusion is by constructing the composite index by using the three dimensions of FI - availability, penetration, and usage. Previous research has mostly concentrated on the availability and penetration of financial services and applied a single measure to evaluate financial inclusion (Arora, Citation2010; Kumar, Citation2013). More specifically, other studies have measured financial inclusion using a variety of factors (Sharma, 2008, 2012). It is evident that there is a dearth of literature on the measurement of financial inclusion in a comprehensive and cohesive way.
The basic objective of the present study is that to obtain insights into financial inclusion, it is necessary to measure the index of financial inclusion in a composite manner and then determine whether the associated parameters could improve financial inclusion.
The next section presents a comprehensive review of literature. Thereafter, the methodology follows for constructing the composite financial inclusion index and the econometric investigation. Finally, the paper presents the concluding remarks.
Review of literature
The literature review is divided into two sections: firstly, the importance and measurement of financial inclusion, and the determining factors of FI.
There are several benefits to having access to and using various financial services. People who have savings accounts can hold their money more securely, manage their consumption during times of hardship, and increase their ability to make profitable investments (Deaton, Citation1990; Dupas & Robinson, Citation2013). Finance also promotes innovation and technology in society and allows for risk-taking (Schumpeter, Citation1934). Given the low incomes in the agriculture industry, this is especially important. The study shows that having access to agricultural finance raises incomes, which eventually, helps drive up agricultural gross domestic product (GDP) (World Bank, Citation2008).
It is essential to understand the actual level of inclusion to improve FI in the nation. Across all the Indian States, efforts have been made to construct a relevant measure for financial inclusion (Chakravarty & Pal, Citation2010; Sarma, Citation2012). Indicators used for measuring financial inclusion in India have primarily focused on scheduled commercial banks. Sarma (Citation2008), for instance, makes use of the three measures of banking penetration, accessibility, and usage. The majority of the other studies have developed indices using comparable indicators (Arora, Citation2010; Kumar, Citation2013; Mehrotra et al., Citation2009). Extensive literature has been devoted to the study of financial inclusion in India. Undoubtedly, in recent years, financial inclusion has emerged as the top development concern. However, a substantial amount of the literature on the link between financial inclusion and socioeconomic advancement does not provide a rational justification. Bagehot (Citation1873), Schumpeter (Citation1934), then Goldsmith (Citation1959), and Gurley and Shaw (Citation1955) provided the theoretical foundation. A significant finding from earlier research was that economies with stronger financial systems tend to develop faster. Additionally, using the Generalised Method of Moments (GMM), Levine (Citation1997) found a strong positive relationship between the efficiency of the financial system and long-term economic growth. Similarly, Kuri and Laha (Citation2011), Arora (Citation2011), Gupta et al. (Citation2014), Govindapuram et al. (Citation2023) and others observed that financial inclusion has a favourable impact on human development and gender equality. Sarma and Pais (Citation2011) have studied that financial inclusion is dependent on income, urbanisation, literacy, and physical and electronic connectivity. Financial inclusion is significantly associated with per capita income, rule of law, and demographic structure, according to Park and Mercado (Citation2015). The financial inclusion index is used by Chithra and Selvam (Citation2013) to analyse the factors that influence financial inclusion in India. According to the study, socioeconomic factors that significantly influence the degree of financial inclusion include population, income, and factors related to literacy. Yadav and Sharma (Citation2016) examined the variables that have an impact on financial inclusion in India. The study makes use of information gathered from the Central Statistical Organisation (CSO) and the Reserve Bank of India (RBI). The study uses banking penetration, availability, and use of financial services to build a multi-dimensional index of financial inclusion. The percentage of agriculture in the GDP, the literacy rate, the population density, and the level of infrastructural development are all major characteristics that have an impact on financial inclusion, according to the study’s multiple regression analyses.
Kumar (Citation2013) examined the position of India in terms of financial inclusion and the factors that influence financial inclusion using panel data for 29 states and union territories from 1995 to 2008 using fixed effects (FE) and dynamic panel GMM techniques. Through the use of a composite index, Cámara and Tuesta (Citation2015) constructed a Principal Component Analysis (PCA) with two steps to evaluate the extent of financial inclusion for a nation or region. They found that the most significant predictors of financial inclusion are per capita GDP, level of education, the efficiency of a financial system, and financial strength. Numerous studies have shown that enrolling people in the financial stream improves their financial situation. There are, nevertheless, certain research gaps. Either parametric or non-parametric methods are used in the current literature on the construction of composite indices. Non-parametric methods were used in studies by Chakravarty and Pal (Citation2013) and Sarma (Citation2008, Citation2012). Similar to this, PCA and factor analysis, respectively, were employed by Cámara and Tuesta (Citation2015) to generate composite indices.
World Bank (Citation2022) stated that “Financial inclusion is a key enabler to reducing poverty and enhancing prosperity.
Financial inclusion can increase the income of the disadvantaged by providing funding for the establishment of new businesses or enterprises (Kara et al., Citation2021).
Malik et al. (Citation2021) used the financial indicators variables considered by Kim et al. (Citation2018) and adopted the PCA method to arrive at a composite index of financial inclusion. Micro-level factors such as age, gender, educational qualification, and income level of people and households are major determinant factors of financial inclusion (Zhang & Posso, Citation2019; Koomson & Danquah, Citation2021). Aracil et al. (Citation2022) used data from 75 developed and developing economies over the period from 2004 to 2017 and found that higher quality of institutions is encouraging to enhancing financial inclusivity.
From the above literature, the factors influencing financial inclusion have been examined in a limited number of studies and are mostly country specific. Most of the studies constructed the index with non-parametric methods. An in-depth analysis is required to comprehend the nature of financial inclusion and the factors influencing financial inclusion. Hence this study uses a composite index that is created using the two-stage PCA method to investigate the extent of interstate variation in the level of financial inclusion in India. Additionally, this study identifies and examines the factors that influence financial inclusion in India.
Research gaps
Previous studies have attempted to construct indices of financial inclusion using select dimensions, which is evident from the analyzed literature. One of the earlier measures has been developed by Sarma (Citation2008). This method was gradually established by Sarma (2010, Citation2012) by adding different indicators under certain dimensions to arrive at financial inclusion, but there was a lacuna in combining weights to different indicators. Certain studies followed the same methodology as Sarma (Kuri & Laha, Citation2011; Yorulmaz, Citation2013; Sethy et al., Citation2016). Others have used arithmetic averages or geometric averages for calculating the financial inclusion index (Arora, Citation2010; Chakravarty & Pal, Citation2010; Gupte et al., Citation2012; Amidžić et al., Citation2014). Only a few studies attempted to provide neutral weights to the indicators and dimensions (Amidžić et al., Citation2014; Cámara & Tuesta, Citation2015; Park & Mercado, Citation2015). By following this methodology, we used Principal Component Analysis (PCA), which is based on factor analysis, where factor loadings are used as weights to create a single index of financial inclusion. This method addresses the criticism of the arbitrary selection of weights and reflects the profoundness of financial inclusion across dimensions.
We used an index for measuring financial inclusion based on three dimensions: penetration, availability, and usage of banking services, with an extended variable considered in the analysis, i.e., RTGS, insurance companies, and policies that aid financial inclusion.
Data and methodology
Sources of data
For the construction of financial inclusion index, data is culled out from the Basic Statistical Returns (BSR) reports of the Scheduled Commercial Banks in India for the year 2005 to 2020. While estimation of the population for the states is collected from the Census of India. Additionally, data on per capita net state domestic product (NSDP) and other indicators are drawn from the “Handbook of Statistics on Indian States” provided by the RBI.
Rationale for choosing the period
During 2005 and 2020, the Indian government implemented several policies to improve financial inclusion. These include, Banking Correspondents Model and Microfinance Act (2005), the Aadhaar program (2009) for simplified KYC processes, the Financial Inclusion Plans (2010) by the RBI mandated rural banking outreach, Pradhan Mantri Jan Dhan Yojana (2014) for spreading bank account access, the digital India Initiative (2015) to promote digital literacy and payments, the Atal Pension Yojana (2015) along with insurance schemes like PMJJBY and PMSBY. These schemes have significantly increased access to financial services for underserved populations across India. Given these policy initiatives, the study considered the period 2005 to 2020 to see how these policies contributed to financial inclusion in the Indian States.
Methodology
The present study constructed a composite financial inclusion index (FII) with the help of dimension wise (penetration, availability, and usage) index. The value of financial inclusion index will fall between 0 and 1, where 0 indicates “no financial inclusion” and 1 indicates “complete financial inclusion”. For this construct of FII, the study used the Principal Component Analysis technique. PCA requires that input variables have to be similar scale of measurement before constructing the composite index; so, variables have to be standardized to zero mean and unit variance. Due to the different units of unit variables, the study used ‘min-max’ method for the standardization of variables:
In the min-max normalization, normalized scores are computed using minimum and maximum observations.
Where,
Xi = Actual value.
Xmin = minimum value.
Xmax = maximum value.
(1)
(1)
Where,
YA i, YP i, and YU i represent the State’s indices for availability, penetration, and usage, while, wU, wA, and wP represent their respective relative weights.
Selection of explanatory variables was based on the previous literature, as they are found to be the most influential variables on financial inclusion.
FII is computed using three dimensions (availability, penetration, and usage) for 28 states from 2005 to 2020. Then based on the value of FII, the states are classified as mentioned in . The financial inclusion index ranges between 0 and 1.
Table 1. Level of financial inclusion.
The States are grouped into three categories namely, High, Medium and Low based on range of index. States having index score 0.3 and below are categorized as Low, followed by medium category having score ranging from 0.3 up to 0.5. States with scores from 0.50 up to 1 are were categorized as high.
Analysis and results
Computation of financial inclusion index (FII)
present the composite financial inclusion index and ranking of all the states of India between 2005 and 2020. The FII is a composite index of all three dimensions (penetration, availability, and usage) and emphasizes the uniform development of the states across these three dimensions. It proposes a direction for policymakers to improve their performance. The objective of this analysis is to find out which state is doing well or is underperforming in terms of overall financial inclusion.
Table 2. Composite index of financial inclusion and ranking of all major Indian states.
To counter the panel data issues, we used Prais-Winsten regression with the panel-corrected standard errors (PCSE) method, which accounts for the endogeneity. Stationary and robustness tests were performed for the panel data.
From the above analysis ( and ), it is evident that Goa stands first in FII in 2005 and 2020 followed by Kerala and Tamil Nadu. In the year 2020, Maharashtra and Telangana moved to high financial inclusion category states. Karnataka, Punjab, and Himachal Pradesh are categorized under medium financial inclusion following FII between (0.3 < to <0.5) for both years. The state of Maharashtra has moved from a medium level to a high-level financial inclusion in 2020 as compared to 2005. As stated earlier, it may be seen that Goa ranked first in both years. Kerala and Tamil Nadu also performed better in terms of FI. The reason for the high financial inclusion is that most of these states are urbanized, industrialized, and have high literacy rates, and so on. Further, it is also observed that majority of the North Indian States are falling under the category of low financial inclusion The low financial inclusion states belong to hilly, territorial, are less urbanized, and do not have proper infrastructure. The states can move from low FI to medium and high FI by focusing more on availability and usage of banking services.
Figure 1. FII state wise in the year 2005 and 2020.
Source: Author’s own calculation using STATA.
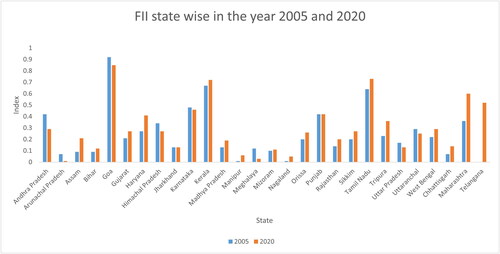
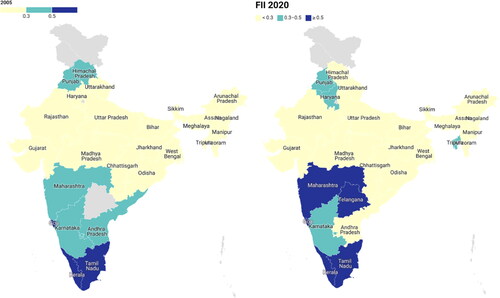
Figure 2. FII distribution (2005 and 2020) map.
Source: Author’s own calculation using STATA.
The results of composite FII indicate that there are regional differences in financial inclusion. Now we make an attempt to investigate critical variables that may have an impact on FI.
We make use of panel regression model to examine the major determinants of financial inclusion for 27 Indian states from 2005 to 2020. The independent variables include per capita NSDP (Net State Domestic Product), Fact (presence of factories), INVA (Industry Net Value Added), and RL (road length), urban population share (URPOP) and LITR (Literacy Rate).
The estimated regression equation is written as:
(2)
(2)
Where,
IFI is of endogenous variable for the ith state at the tth period,
β0 is for the intercept term, β1 is the vector of associated parameters. Xit is the matrix of exogenous variables.
αi is treated as a random variable with a specified probability distribution in the case of a random effects model, whereas a set of fixed parameters in a fixed effects model. Uit is the stochastic error term and i = 1, 2, 3, … 27, t = 2005 to 2020.
The observations for an individual, in particular, may not be independent due to the peculiar characteristics of the pooled dataset; therefore, the conventional ordinary least squares approach may produce inaccurate estimates. We use the panel data estimation methodologies (fixed-effects model and random-effects model) to account for the fixed or random individual variations. To determine if the fixed or random effects model is appropriate, the Hausmann test has been used.
Authors checked for the existence of heteroskedasticity. contemporaneous cross-sectional correlation and residual autocorrelation. Ignoring regression disturbance heterogeneity and potential correlation over time and between units may result in skewed statistical inference (Cameron & Trivedi, Citation2005). The cross-sectional dependency in the residuals is still often ignored, creating an arbitrary and potentially biased constraint on empirical models, even if most contemporary studies give heteroskedastic- and autocorrelation consistent standard errors. In fact, using appropriate statistical tests, we discover that each of the three issues exist in the data’s error structure ( test results). The average variance inflation factor (VIF) value is 2.45, indicating that the panel data structure does not pose a multicollinearity problem. Therefore, the authors take into account a Prais-Winsten regression with panel-corrected standard errors (PCSE) in order to appropriately adjust the standard errors (Ardizzi et al., Citation2014; Beck & Katz, Citation2006).
Table 3. Econometric test results.
shows the results of the regression analysis of the determinants of the Financial Inclusion Index (FII) like per capita NSDP, Net Value added, number of factories, road length, urban population share, and literacy rate. All estimated coefficients are statistically significant. The regression results also indicate that the per capita NSDP, number of factories, road length, share of urban population, and literacy rate impact positively financial inclusion. The R2 value shows that about 74 percent of the variation in the FII is explained by the variations in the explanatory variables included in the model.
Table 4. Determinants of financial inclusion.
The literacy rate (human capital) is commonly assumed to be a key determinant factor of financial inclusion, but our analysis shows that it is statistically insignificant. This can be due to several reasons. Financial inclusion is influenced by a wide range of factors, not just literacy, but other variables like income, employment status, and access to usage of financial institutions. These factors could have a more direct impact on financial inclusion than the literacy rate alone.
Conclusions
The study examined the level of financial inclusion by applying the Financial Inclusion Index (FII) for Indian states. The composite FII was computed for 28 states of India using financial indicators of three dimensions such as penetration, availability and usage of the banking services. On the basis of the composite FII, states were classified into three categories, namely, high financial inclusion, medium financial inclusion and low financial inclusion. The level of financial inclusion has increased over time across different Indian states, however, some of the States still fall into the medium and low inclusion category. Three states (Goa, Kerala and Tamil Nadu) fall into the high financial inclusion group along with two states (Telangana and Maharashtra) in the year 2020. Most of the north-eastern states fall under the low financial inclusion category.
One of the key factors affecting financial inclusion is the impact of income as measured by net state domestic product (NSDPit). It is generally accepted that raising financial inclusion requires a high-income level. In addition, taking into account the magnitude and the statistical significance, infrastructure, as shown by road length (Road Length) and the existence of factories (Fact), are the other crucial drivers of financial inclusion. The other main indicators such as the literacy rate and urban population share and others are statistically significant and, Net value added is not statistically significant. so that the from a macro perspective, the study’s findings suggest that the specified independent variables favorably influence financial inclusion among Indian states. The limitation of the study is that more variables could not be included for the paucity of data across all the States. The study, however, is restricted to a small number of variables and needs to be more generalizable. In order to ensure that all the states achieve and move to high financial inclusion, it is essential on the part of the government to see that there is an increase in the per capita income, creation of better infrastructure, aim to increase the literacy rate and also strive towards more urbanization. In addition, policies should be focused on enhancing awareness, usage and penetration of banking services as a step towards high financial inclusion.
The significant increase in the NSDP per capita shows a positive effect on financial inclusion. The panel regression shows that number of factories also have a positive and significant influence on financial inclusion. It implies that states with better industrial activity have a role in determining financial inclusion. Road networks also have a positive impact on financial inclusion, which is true because better road networks aid to enhance both from the supply side and the demand side, implying, that if better infrastructure is provided there is more access to financial inclusion. Literacy rate is also another positive and significant determinant because it not only increases employment opportunities but also creates financial awareness.
From the analysis, authors found that financial inclusion varies among the regions – for instance, the southern region performed better in terms of financial inclusion when compared to the other regions. Hence, it is essential to address the regional variations by focusing on specific policies that help the regions or states to become more financially inclusive. Further, there is a need to conduct financial literacy programs and create financial inclusion infrastructure.
Limitations
As far as the variables are considered for the construction of the index, we have taken only variables available for the study period, but there is a chance to take state-specific variables. The study could not capture the effect on FI during the pandemic. So, there is scope to capture the Covid-19 effect in future studies. The gender and digital index can also be constructed depending on data availability.
Nature of data
Secondary data.
Sample size
Since the study is based on secondary pooled data of time series and cross-section sample size is not applicable.
Data sources
The data used in this study were obtained from various sources. For the construction of financial inclusion index, Panel data were culled out from the Basic Statistical Returns (BSR) reports of the Scheduled Commercial Banks in India for the period 2005 to 2020 for all states. Similarly, for estimation of the population for the states is collected from the Census of India. Additionally, data on per capita net state domestic product (NSDP) and other indicators are drawn from the “Handbook of Statistics on Indian States” provided by the Reserve Bank of India.
https://www.mospi.gov.in/publication/state-domestic-product-state-series-1980-81
Rights and permission
As the data is of secondary nature, which is publicly available, from the above-mentioned website links, there is no need to take permissions.
Author contribution
Alivelu Kasturi – Conceptualization and design. Ramesh Annemalla-Analysis interpretation and drafting of the manuscript. Asha Prasuna – Revising it critically for intellectual content.
Fig 1 FII state wise in the year 2005 and 2020.xlsx
Download MS Excel (15.4 KB)Data availability statement
Authors agree to provide data file and the materials supporting the results and analyses upon reasonable request.
Disclosure statement
No potential conflict of interest was reported by the author(s).
Additional information
Notes on contributors
Asha Prasuna
Dr. Asha Prasuna Completed her Ph.D. in 1997 Economics from University of Hyderabad, a central university based at Hyderabad. She is currently working as Professor of Economics & International Finance at K J Somaiya Institute of Management, a constituent college of Somaiya Vidyavihar University, Mumbai. Her research areas include International Finance, Macroeconomics, Econometrics, Mergers and Acquisitions and small and risk management. She is adviser to the Academic Council of the Finance Academy, Mahindra Leadership University since April 27, 2015, till date, Life Member of The Indian Econometric Society and Editorial Board member of the journal -Letters in Spatial & Resource Sciences. She is also reviewer for Business Perspectives and Research, Sage Publications, Editor, CEPAR Annual Conference Proceedings and guest editor for The Empirical Economic Letters. Doctoral thesis principal adviser for Somaiya Vidyavihar University, Mumbai, BIT- Ranchi and CESS, Hyderabad. Jointly published five textbooks namely Wealth Management, Equity Valuation and Research, Fixed Income Securities, Macroeconomics and Policy for Managers, Ethics in Banking. She has completed three funded research projects for D&B content development for corporate trainings and certifications, Budget Impact Analysis for an Investment advisory firm and foreign exchange risk management for a large Corporate Her research publications link https://scholar.google.com/citations?user=JSNcy7kAAAAJ&hl=en.
Alivelu Kasturi
Dr. Alivelu Kasturi, was awarded Ph.D in Development Studies (with specialisation in Economics) in 2007. Currently, she is Associate Professor and Dean, Division for Graduate Studies, Centre for Economic and Social Studies, Hyderabad, Telangana, India. Her research interests include Industry with particular interest on manufacturing sector and regional inequalities in the performance of industry sector, Services (Railways), Water and Sanitation, Sustainable Development Goals and Financial Inclusion. Her recent publications (i) Piped Water in Premises and not in Premises - Impact on Illness among Households: A Case of Telangana State in India*Empirical Economics Letters, 21 (Special Issue 4): (July 2022) ISSN 1681 8997 (ii) Financial Inclusion and Economic Growth in India: An Empirical Study, Madhya Pradesh Journal of Social Sciences, A biannually Journal of M. P. Institute of Social Science Research, Ujjain ISSN: 0973-855X (Vol 27 No 6, June 2022) (iii) Productivity, Employment and Wages in the Organised Manufacturing Sector (co-authored with Priyadarshi Joshi), The Journal of Institute of Public Enterprise, 43(1), 1–17, January-June, 2020 She is a member of the Indian Economic Association and The Indian Econometric Society.
Ramesh Annemalla
Ramesh Annemalla Research Scholar in Commerce and Business Management in Centre for Economic and Social Studies, Hyderabad. My Research interests are Financial and Development Economics, Banking, Rural Economy.
References
- Amidžić, G., Massara, A., & Mialou, A. (2014). Assessing countries’ financial inclusion standing—A new composite index. International Monetary Fund.
- Aracil, E., Gómez-Bengoechea, G., & Moreno-de-Tejada, O. (2022). Institutional quality and the financial inclusion-poverty alleviation link: empirical evidence across countries. Borsa Istanbul Review, 22(1), 179–188. https://doi.org/10.1016/j.bir.2021.03.006
- Ardizzi, G., Petraglia, C., Piacenza, M., Schneider, F., & Turati, G. (2014). Money laundering as a crime in the financial sector: A new approach to quantitative assessment, with an application to Italy. Journal of Money, Credit and Banking, 46(8), 1555–1590. https://doi.org/10.1111/jmcb.12159
- Arora, R. U. (2011). Financial inclusion and human capital in developing Asia: The Australian connection. Third World Quarterly, 33(1), 177–197. https://doi.org/10.1080/01436597.2012.627256
- Arora, R. U. (2010). Measuring financial access. Griffith Business School Discussion Papers Economics, 1(7), 1–21.
- Bagehot, W. (1873). Lombard street: A description of money the market. Scribner, Armstrong & Co.
- Beck, N., & Katz, J. N. (2006). What to do (and not to do) with time-series cross-section data. American Political Science Review, 89(3), 634–647. https://doi.org/10.2307/2082979
- Cámara, N., & Tuesta, D. (2015). Peru model for financial inclusion: E-money potential adopters. BBVA Research, Financial.
- Cameron, A. C., & Trivedi, P. K. (2005). Microeconometrics: Methods and applications. Cambridge University Press. Capital, Credit, Interest, and the Business Cycle. Harvard University Press.
- Chakravarty, S. R., & Pal, R. (2010). Measuring financial inclusion: An axiomatic approach. Indira Gandhi Institute of Development Research, Working Papers (WP-2010-003; Issue March).
- Chakravarty, S. R., & Pal, R. (2013). Financial inclusion in India: An axiomatic approach. Journal of Policy Modeling, 35(5), 813–837. https://doi.org/10.1016/j.jpolmod.2012.12.007
- Chithra, N., & Selvam, M. (2013). Determinants of financial inclusion: an empirical study on the interstate variations in India. available at SSRN 2296096.
- Deaton, A. (1990). On risk, insurance and intra-village consumption smoothing. Preliminary Draft, Research Program in Development Studies. Princeton University.
- Demirgüc-Kunt, A., Klapper, L., Singer, D., & Ansar, S. (2022). The Global Findex Database 2021: Financial inclusion, digital payments, and resilience in the age of Covid-19. World Bank.
- Demirguc-Kunt, A., Klapper, L., Singer, D., Ansar, S., & Hess, J. (2018). The global findex database 2017: measuring financial inclusion and the Fintech revolution. The World Bank.
- Dupas, P., & Robinson, J. (2013). Savings constraints and microenterprise development: Evidence from a field experiment in Kenya. American Economic Journal: Applied Economics, 5(1), 163–192. Financial Economic Policy, 5(1), 4–19. https://doi.org/10.1257/app.5.1.163
- Goldsmith, R. W. (1959). Financial structure and development as a subject for international comparative study. In The comparative study of economic growth and structure (pp. 114–123). National Bureau of Economic Research.
- Govindapuram, S., Bhupatiraju, S., & Sirohi, R. A. (2023). Determinants of women’s financial inclusion: evidence from India. Annals of Public and Cooperative Economics, 94(1), 131–158. https://doi.org/10.1111/apce.12376
- GPFI. (2014). Financial inclusion action plan. Global Partnership for Financial Inclusion.
- Gupte, R., Venkataramani, B., & Gupta, D. (2012). Computation of financial inclusion index for India. Procedia - Social and Behavioral Sciences, 37, 133–149. https://doi.org/10.1016/j.sbspro.2012.03.281
- Gupta, A., Chotia, V., & Rao, N. M. (2014). Financial inclusion and human development: A state-wise analysis from India. International Journal of Economics, Commerce and Management, II(5), 1–23.
- Gurley, J. G., & Shaw, E. S. (1955). Financial aspects of economic development. The American Economic Review, 45(4), 515–538.
- Hannig, A., Leifheit, M., & Rüther, L. L. (2014, November). The alliance for financial inclusion: bringing smart policies to life. In Global funds and networks (pp. 198–207). Nomos Verlagsgesellschaft mbH & Co. KG.
- Kara, A., Zhou, H., & Zhou, Y. (2021). Achieving the United Nations’ sustainable development goals through financial inclusion: A systematic literature review of access to finance across the globe. International Review of Financial Analysis, 77, 101833. https://doi.org/10.1016/j.irfa.2021.101833
- Kim, K. J., Lee, K., & Ahn, H. (2018). Predicting corporate financial sustainability using novel business analytics. Sustainability, 11(1), 64. https://doi.org/10.3390/su11010064
- Koomson, I., & Danquah, M. (2021). Financial inclusion and energy poverty: empirical evidence from Ghana. Energy Economics, 94, 105085. https://doi.org/10.1016/j.eneco.2020.105085
- Kumar, N. (2013). Financial inclusion and its determinants: evidence from India. Journal of Financial Economic Policy, 5(1), 4–19. https://doi.org/10.1108/17576381311317754
- Kuri, P. K., & Laha, A. (2011). Financial inclusion and human development in India: An inter-state analysis. Indian Journal of Human Development, 5(1), 61–77. https://doi.org/10.1177/0973703020110103
- Levine, R. (1997). Financial development and economic growth: Views and agenda. Journal of Economic Literature, 35(2), 688–726.
- Malik, A. H., bin Md Isa, A. H., bin Jais, M., Rehman, A. U., & Khan, M. A. (2021). Financial stability of Asian Nations: Governance quality and financial inclusion. Borsa Istanbul Review, 22(2), 377–387. https://doi.org/10.1016/j.bir.2021.05.005
- Mehrotra, N., Puhazhendhi, V., Nair, G., & B.b, S. (2009). Financial inclusion: An overview (No. 48; NABARD occasional papers). NABARD.
- Park, C. Y., & Mercado, R. (2015). Financial inclusion, poverty, and income inequality in developing Asia. Asian Development Bank Economics, Working Paper Series, (426).
- Pomeroy, R. (2022). Sustainable development: How ’financial inclusion’ can help lift Millions of People out of Poverty - on Radio Davos. World Economic Forum. https://www.weforum.org/agenda/2022/09/financial-inclusion-findex-radio-davos-world-bank-economist/
- Rangarajan Committee. (2008). Report of the committee on financial inclusion. Committee Report.
- Sarma, M. (2008). Index of financial inclusion (No. 215). Working paper.
- Sarma, M. (2012). Index of Financial Inclusion – A measure of financial sector inclusiveness (No. 1207). Berlin: Hochschule fuer Technik und Wirtschaft.
- Sarma, M., & Pais, J. (2011). Financial inclusion and development. Journal of International Development, 23(5), 613–628. https://doi.org/10.1002/jid.1698
- Schumpeter, J. A. (1934). The theory of economic development: An inquiry into profits, World Bank annual conference on development economics 1989, World Bank Economic Review Supplement, 61–96. World Bank Policy Research Report.
- Sethy, S. N., Syed, T. H., Kumar, A., & Sinha, D. (2016). Hydrogeochemical characterization and quality assessment of groundwater in parts of Southern Gangetic Plain. Environmental Earth Sciences, 75(3), 1–15. https://doi.org/10.1007/s12665-015-5049-4
- World Bank. (2008). Finance for all?: Policies and pitfalls in expanding access. (No. 41792; A). World Bank.
- World Bank. (2013). Global financial development report 2014: Financial inclusion. The World Bank.
- World Bank. (2022). Financial inclusion. https://www.worldbank.org/en/topic/financialinclusion/overview#1
- Yadav, P., & Sharma, A. K. (2016). Financial inclusion in India: an application of TOPSIS. Humanomics, 32(3), 328–351. https://doi.org/10.1108/H-09-2015-0061
- Yorulmaz, R. (2013). Construction of a regional financial inclusion index in Turkey. BDDK Bankacılık ve Finansal Piyasalar Dergisi, 7(1), 79–101.
- Zhang, Q., & Posso, A. (2019). Thinking inside the box: a closer look at financial inclusion and household income. The Journal of Development Studies, 55(7), 1616–1631. https://doi.org/10.1080/00220388.2017.1380798