
 ?Mathematical formulae have been encoded as MathML and are displayed in this HTML version using MathJax in order to improve their display. Uncheck the box to turn MathJax off. This feature requires Javascript. Click on a formula to zoom.
Abstract
This paper develops, and then applies, a holistic framework that supports industrial policy decision-making at the global value chain (GVC) level, with the aim of stimulating sustainable development in developing countries. Notwithstanding the importance of economic growth for development, industrial policy decision-makers are also concerned about social and environmental objectives when setting industrial policies. We develop a framework that allows for a trade-off between economic growth, social objectives, and environmental goals. We do so by building on the established product space literature, and its extensions, and applying it to the value chain level using the input-output product space approach. By including emerging environmental and green metrics, we manage to identify Pareto-optimal industry targets, taking the economic, environmental, and social objectives simultaneously into account. At the same time, expected required government investment is minimized. Finally, we apply our new framework to the specific case of iron and steel in the Southern African Customs Union, and draw lessons for future work from this example.
1. Introduction
In 2015, the United Nations General Assembly adopted the “2030 Agenda for Sustainable Development”, which includes 17 Sustainable Development Goals (SDGs). The SDGs seek to balance the “three dimensions of sustainable development: the economic, social, and environmental” (United Nations, Citation2015). This is echoed in the African Union’s (AU) 50-year Agenda 2063 (African Union, Citation2015), with the very first of seven aspirations being: “A prosperous Africa based on inclusive growth and sustainable development”. To attain the SDGs and aspirations of Agenda 2063, there is a need to not only include economic considerations within decision-support frameworks, but also social and environmental considerations.
However, there appears to be a lack of integrated tools that support the scoping phase of industrial policy decision-making (i.e., the initial comparison and prioritization of activities for further evaluation) while including the three dimensions of sustainable development (Du Plessis & Bam, Citation2018). Furthermore, such tools would need to move beyond the generic, and consider the unique production structure and capabilities of a focal jurisdiction to prioritize opportunities based on expected viability. Such tools are of particular importance to African countries, as the continent seeks to drive significant development in an era where the “big development ideas” are increasingly deemed to be outdated due to the geographical fragmentation and complexity of global value chains (Baldwin, Citation2011) and sustainability is increasingly underlined as a desired outcome from policies.
The product space (PS) approach is an emerging scoping-phase analysis approach that shows early promise in incorporating such considerations (Ferraz, Falguera, Mariano, & Hartmann, Citation2021). It inherently considers the production structure of a country when identifying potential routes for development. Initially focused on economic growth, various measures have been added to the PS approach in recent years to include the other dimensions of sustainable development (Ferraz et al., Citation2021; Fraccascia, Giannoccaro, & Albino, Citation2018; Mealy & Teytelboym, Citation2020).
However, the PS literature remains largely detached from the global value chain (GVC) and global production network (GPN) perspectives. Thus, the linking of results from PS analyses to the value chain context is not intuitive. This is a notable weakness as the organization of economic activity is increasingly characterized by GVCs (Baldwin, Citation2011). Furthermore, PS analyses, although useful in the scoping phase of industrial policy decision-making, do not provide the in-depth understanding of GVC dynamics necessary to make final informed industrial policy decisions. Rather, they provide an initial prioritization of activities for further in-depth GVC, GPN, and other analyses that evaluate the key location determinants at play, the potential mechanisms for, and realism of, policy intervention (Bam & De Bruyne, Citation2017).
An important development in linking the PS and value chain perspectives is the Input-Output Product Space (IO-PS) framework (Bam & De Bruyne, Citation2019). The IO-PS bridges the two perspectives by overlaying PS metrics on a value chain conceptualization of an industry. The value chain with PS-based metrics can be used to prioritize activities within the value chain for further analysis, while inherently considering the entire production structure of the focal country to identify activities that are more likely to be viable in that country. By including the emerging PS metrics into the IO-PS framework that address concerns other than economic growth, we are able to evaluate the expected performance of GVC activities in terms of (aspects of) their economic, social, and environmental performance. This enables the identification of Pareto-optimal GVC activities that are likely to deliver different theoretically optimal trade-offs between the sustainability metrics, leading to their prioritization for further analysis.
To test the use of the proposed framework, we applied it to the iron and steel industry in the Southern African Customs’ UnionFootnote1 (SACU). The test case illustrates the utility of the proposed framework and the tension between the three development dimensions. It also enables the identification of the shortcomings of the extant metrics and where further development is required.
In the remainder of the paper, we first situate our contribution in the existing literature, and motivate our choice for the SACU iron and steel case (Section 2). In Section 3, we discuss the data and methodology for the case study. The results from the case study are presented in Section 4. Section 5 provides a discussion of the results, before Section 6 provides concluding remarks.
2. Background
This section begins with a brief overview of leading scoping-phase industrial policy decision-making frameworks and a summary of the integration of the three dimensions of sustainability in these frameworks (Section 2.1). Following on from this is a detailed discussion of the key metrics that form the foundation of the traditional PS framework (Section 2.2), developments in including sustainability considerations in this framework (Section 2.3), and adaptations of the PS towards a GVC perspective, i.e., the IO-PS framework (Section 2.4). Section 2.5 discusses the criteria for selecting a test case for the purposes of this study, along with an overview of the chosen case – the iron and steel industry in the SACU.
2.1. Scoping-phase Industrial Policy Decision Support Frameworks
Strategic industrial policymaking is a complex and dynamic process (Andreoni & Chang, Citation2019). This is due to, inter alia, competing objectives, limited resources, information uncertainty, and vested interests. The process entails various decision-making stages (though we focus mainly on the initial scoping phase in this paper), can be very resource-intensive, and have far-reaching consequences (Chitaka, von Blottnitz, & Cohen, Citation2018). Analytical approaches and decision-support tools often play a crucial role in supporting this process. These approaches can support the policymaking process by structuring and simplifying complex information, providing objective metrics, and enabling a comparative appraisal of alternatives.
Two related frameworks that have gained particular prominence in supporting analyses linked to industrial policymaking are the GVC (Gereffi, Citation2019) and global production network (GPN) (Coe & Yeung, Citation2019) frameworks. Initially focused on power relations between actors and the economic rent implications of these relations, these frameworks have increasingly been adapted to include social and environmental dimensions (Kano, Tsang, & Yeung, Citation2020). However, GVC-related frameworks have various shortcomings, particularly for scoping phase industrial policy analyses. These include the resource intensiveness of rigorous GVC studies, the descriptive (as opposed to prescriptive) nature of the results emanating from the approach and a lack of a systematic evaluation of location determinants (Bam & De Bruyne, Citation2017).
An alternative approach to enable the rapid evaluation of competing industries for support during the initial scoping phase, suggested by Du Plessis and Bam (Citation2018), makes use of public sustainability disclosures to assess the expected impact of target industries according to the three dimensions of the sustainable development using the triple bottom line (TBL) framing (i.e., measures on economic, social, and environmental elements). However, the approach suffers from data granularity issues and gives no indication of the potential attainability of a target industry within a focal jurisdiction.
A third approach to evaluate industries for promotion, which is a focus of this paper, is the PS-based approach. The PS, pioneered by Hidalgo, Klinger, Barabasi, and Hausmann (Citation2007), studies the network of relatedness between products. It has been applied in industrial planning to determine which sophisticated products are best supported for introduction to a country's export basket by identifying those productive sectors that are easily attainable and most suitable to foster capability development and economic growth. The methodology has various important benefits. By using widely available (trade) data, it can rapidly provide the information needed to guide further resource-intensive second phase analyses to improve resource allocation.Footnote2 The methodology can also extract easily interpretable results from very complex data (using dimension reduction calculations). Despite these strong points, there are some drawbacks and points for improvement.
First and foremost, the dimension reduction calculations can overly simplify the results, leading to important factors not being considered. Secondly, the theory and (open source) tools to fully leverage the methodology are still under development, and various areas of extension and improvement still exist. This includes uncertainty regarding the optimal integration of the metrics within decision-support tools. Thirdly, much of the PS literature fails to focus on a particular industry or link results to a value chain conceptualization. This means that the results are often superficially analyzed and uncontextualized. Finally, the optimal metrics to use for specific sustainability dimensions remain contested. This paper seeks to consolidate some of the most important developments in this field and illustrate how they might be leveraged to support the industrial policymaking process. Consequently, the following section provides a more in-depth discussion of the various metrics that have been developed in the PS literature.
2.2. Product Space and its Metrics
The PS studies the network of relatedness between products by means of several metrics such as complexity, distance and opportunity gain. An intuitive way to describe the PS is to consider each product to be a single tree and the set of all products to be a forest (Hausmann & Klinger, Citation2006). A country consists of a number of firms, which can be thought of as monkeys that live on the trees and exploit the products. Growth (higher complexity) implies that firms/monkeys move from the (typically less dense) parts in the forest where the trees bear less fruit to parts in the forest where the trees produce an abundance of fruit by jumping the distances between the trees. That implies that monkeys have to jump distances (build the necessary capabilities) to get to other trees. Sometimes, if a monkey is able to reach a particular tree, reaching that tree might unlock new opportunities to reach more or more sophisticated trees (opportunity gain) (Hausmann et al., Citation2011).
An important measure in the PS framework is that of complexity. An increase in a country’s complexity is associated with an acceleration of its long-term growth rate (Hausmann et al., Citation2011) and, hence, considered a potential goal of industrial policy. Economic complexity reflects the amount of productive knowledge embedded in the productive structure of an economy or a product. This knowledge – modularized into parts that are called capabilities – are hard to acquire and accumulate. New capabilities will therefore be more easily accumulated if they can be combined with capabilities that already exist. For this reason, countries are more likely to diversify by moving from the products they already produce to products that require a similar set of capabilities. The PS is the network connecting pairs of products that are significantly likely to be co-exported by many countries.
If a country has a smaller distance (formally defined in Appendix 1) to a product within the PS network, that product is often co-exported with the products that the country currently exports and is assumed to require similar capabilities to those that the country already possesses. To calculate distance, the PS makes use of the concept of revealed comparative advantage (RCA), based on the Balassa (Citation1965) definition (defined in Appendix 1). A country c “has an RCA” for a product i if the product constitutes a larger share of its export basket than for the average country, i.e., if its RCA value according to the Balassa definition is larger than 1. Otherwise, it “does not have an RCA” for the product. The metric distance can then be used to express how proximate a particular “unobtained” or “opportunity” product j (a product with RCA < 1) is in the PS to the collection of products which a country already exports “with an RCA”, compared to all products in the PS. It can be expected to be easier for a country to obtain an RCA for an unobtained product with a lower distance value (Hausmann et al., Citation2011).
Next to distance and complexity, the PS literature introduces a third important concept: opportunity gain (Hausmann et al., Citation2011), defined in Appendix 1. Opportunity gain indicates how much achieving an RCA for a product might contribute to developing the requisite capabilities for (i.e., reduce the distance to) higher complexity products.
To summarize, the PS framework identifies the products a country might want to diversify into, taking into account the country’s current capabilities, the products’ complexities (i.e., the potential for supporting economic growth), and their scope to attain higher complexity products in the future (i.e., supporting growth and structural transformation in the long run).
2.3. Sustainability Considerations in the Product Space
The foundational focus of the PS was on economic growth. Some of the initial developments related to it included competing approaches to evaluate the key opportunities for development from a purely economic perspective (Albeaik, Kaltenberg, Alsaleh, & Hidalgo, Citation2017a, Citation2017b; Hidalgo & Hausmann, Citation2009; Tacchella, Cristelli, Caldarelli, Gabrielli, & Pietronero, Citation2012). However, more recent developments have led to metrics addressing inequality (Hartmann, Guevara, Jara-Figueroa, Aristarán, and Hidalgo (Citation2017)) and competing metrics providing an approximation of the environmental impacts linked to different activities (Fraccascia et al., Citation2018; Mealy & Teytelboym, Citationin press). González, Ortigoza, Llamosas, Blanco, and Amarilla (Citation2019) brought in both social and environmental criteria simultaneously, but presupposed an equal weighting between the various dimensions, and did not incorporate any more recent PS-related developments.
Hartmann et al. (Citation2017) illustrated that the ability of an economy to both generate and distribute income is strongly correlated with the mix of products a country is able to produce and export. The higher the country’s economic complexity index value,Footnote3 the higher its per capita income and the lower its inequality, as measured by the country Gini coefficient.Footnote4 An important contribution by Hartmann et al. (Citation2017) is the introduction of the Product Gini Index (PGI)Footnote5 – a measure that associates a level of inequality with each product, depending on the Gini coefficients of the countries exporting the product. A high PGI implies that the good is associated with a high level of income inequality.
Other studies have analyzed the economic growth and environmental considerations from a PS perspective. Two studies deserve particular mention in this regard. Fraccascia et al. (Citation2018) identified the green productsFootnote6 with the highest potential for growth in a given country. They argued that among all green products in a given country, the country focuses best on producing those green goods that have the smallest distance to the goods it already exports competitively (RCA>1). In a second important paper, Mealy and Teytelboym (Citationin press) ranked countries in terms of their ability to export complex green productsFootnote7 competitively. They show that countries that export more (complex) green products are more likely to have higher environmental patenting rates, lower CO2 emissions, and more stringent environmental policies even after controlling for per capita GDP. However, neither the results of Fraccascia et al. (Citation2018) nor those of Mealy and Teytelboym (Citationin press) pin down a specific and advantageous green industrial policy. Although both studies provide novel insights – and useful indices – neither of them grants us a fundamental insight into the (possible) trade-off between the two objectives of economic and green development when laying out the optimal industrial policy. We introduce the consideration of green development in our framework using the data and methodology developed by Mealy and Teytelboym (Citationin press), as they use a more comprehensive list of green products. Unfortunately, there is no internationally agreed classification of green products. Despite interest and more than 10 years of effort by the World Trade Organization (WTO) Committee on Trade and Environment (CTE), a unified list of green products remains elusive (a.o. APEC list, WTO list, EPPFootnote8 list. See de Melo and Solleder (Citation2020)). Mealy and Teytelboym (Citationin press) also indicate the predictive abilities of their index in terms of predicting CO2 emissions – which can be considered to be closely linked to SDG 13 – as opposed to the focus of Fraccascia et al. (Citation2018) on identifying the green products with the highest potential of attainment.
To the best of our knowledge, González et al. (Citation2019) is the only PS-based paper that addresses economic, social, and environmental objectives concurrently to advise industrial policy decision-making. The authors combine the PS methodology with a multi-criteria Analytical Hierarchical Process (AHP) decision-making technique and test it on the case of Paraguay. Moreover, the main objectives are compared pairwise, and an equal weight is given to each of them. They also perform a sensitivity analysis to explore the impact of the increased importance of each of the objectives. This method is able to identify key activities for prioritization. However, it does require weights to be determined a priori and different baseline and sensitivity analysis weights might lead to different prioritizations. The AHP method has also been criticized for suffering from rank reversalFootnote9 (among them Salo and Hämäläinen (Citation1997) and Weber (Citation1997)).
Existing studies therefore mostly focus on either the simultaneous consideration of growth and inequality on the one hand, or growth and the environment on the other hand. Alternatively, they presuppose particular weightings of the dimensions and omit more recent developments. The main contribution of this paper is to simultaneously consider growth, inequality and the environmental metrics while focusing on a single value chain.
2.4. Input-Output Product Space
A recent development is the adaptation of the PS approach to be more value chain centric by arranging the analysis according to input-output relations between products and focusing on a particular industry value chain (W. Bam & De Bruyne, Citation2019). This Input-Output Product Space Approach (IO-PS) supports the identification of particular parts of a focal value chain that would best support the industrial policy aims of a particular country. The approach focuses on the interplay between the expected difficulty to attain an RCA for a product(s) in a GVC on the one hand (distance), and the preferred outcome (complexity) on the other hand. Using PS metrics, the IO-PS approach allows for an analysis of which parts of the value chain hold the most potential benefit to the country when produced locally (and hence supported by industrial policy). For an extensive explanation of the IO-PS, the reader is referred to Bam, De Bruyne, and Laing (Citation2021).
The first step of the IO-PS approach is to map the input-output structure of an industry, and then link this structure to international trade codes. The first outline is achieved by making use of input-output tables and concordance tables. The mapping undergoes further refinement by arranging the identified trade codes into different product categories and tiers. Product categories are defined in such a way that trade codes combined in a category will be produced by the same firms and/or can be targeted by the same interventions. The product categories in tier n−1 are used as inputs for product categories in tier n. Although the input-output tables are a good starting point in identifying trade codes, they are usually at too high a level of granularity to be solely relied upon. Hence, extensive desktop research, complemented by discussions with industry practitioners, are required to make sure that the mapping reflects the reality within the focal industry (W. Bam & De Bruyne, Citation2019).
2.5. The Steel Industry in SACU
To test the use of the proposed framework, we apply it to the iron and steel industry in the Southern African Customs’ Union (SACU). The industry is an ideal test case due to the global environmental, social, and economic importance of the sector (Cullen, Allwood, & Bambach, Citation2012; Singh & Gupta, Citation2018), the significant policy attention that the sector generally enjoys (Humphreys, Citation2013), and the particular focus of the AU’s Agenda 2063 (African Union, Citation2015) and Africa Mining Vision (African Union, Citation2009) on industrialization by means of beneficiation and the value addition of natural resources. The SACU (and South Africa in particular) is a natural case for further study, as South Africa is one of the developing countries producing the most iron ore per yearFootnote10 (US Geological Survey, Citation2021), and the South African government has considered various interventions in the sector (DTI, Citation2018). Moreover, South Africa has very high emissions per unit of value added,Footnote11 has a highly unequal income structureFootnote12 (which is worsening (World Bank, Citation2021c)), and has experienced disappointing economic growth over the last decade.Footnote13 Hence, considering that South Africa is a signatory to the SDGs and the African Union Agenda 2063, and made commitments related to the Paris Agreement (PA), avenues to improve performance on all three sustainability dimensions is of significant policy importance. Finally, only a limited number of studies have analyzed African countries using the economic complexity approach in association with sustainability (Ferraz et al., Citation2021), and none that we are aware of have attempted to link such analyses with a value chain perspective.
3. Data and Methodology
We propose a three-phase framework based on the value chain-centric IO-PS framework developed by Bam and De Bruyne (Citation2019) (with its focus on economic growth). We add to this framework the inequality and green indices developed by Hartmann et al. (Citation2017) and Mealy and Teytelboym (Citationin press), respectively. The first phase of the framework consists of calculating the average distance, Economic Complexity Index (ECI), and Product Gini Index (PGI) of the products for which a country does not have an RCA within each value chain activity. It also entails evaluating each GVC activity to determine the percentage of goods, for which the focal country does not have an RCA, that are “green” goods. The second phase consists of calculating a Pareto-set that provides a suite of options that represent the theoretical optimal trade-off between the four metrics (average distance, complexity, PGI of opportunity products, and percentage green opportunity products within each activity). The Pareto-set can be provided to stakeholders as a theoretically optimal (from a PS perspective) shortlist of products, which can be considered for further evaluation. In the third phase of analysis, the framework provides a sensitivity analysis to indicate the resulting Pareto-set if any of the four objectives would be considered to be of secondary importance by stakeholders. This enables the identification of the activities that are theoretically optimal under the widest range of assumptions. The advantage of this approach is that it does not presuppose a weighting of objectives by normalizing the different objectives to a single metric. Rather, it leaves the final weighting of objectives to decision-makers, whilst providing a detailed view of the trade-off implications.
We apply this framework to the iron and steel industry in the SACU.Footnote14 We use the steel value chain definition of Bam and De Bruyne (Citation2019), which is defined using the Harmonised System (HS) 1992 (HS92) version at the 4-digit level. For the trade-based calculations, we use the HS92 classification trade data for 2018, contained in the CEPII BACI 2020 version, which we convert from 6-digit level to 4-digit level. To calculate the traditional IO-PS metrics, we use the MATLAB code of Bam and De Bruyne (Citation2019).Footnote15
To calculate the inequality metrics, we obtained inequality data for 2014–2018 from the World Bank’s database of household surveysFootnote16 by using the povcalnetR package API.Footnote17 We then used the average of the Gini index for these years in the calculation of the PGI. We removed the countries with no data for these years. As the PovcalNet data isolates South Africa (in contrast to the BACI data), we used its Gini index value for the PGI calculation of the SACU.Footnote18 To determine the percentage of green products in each value chain activity without an RCA, we used the set of green products collated by Mealy and Teytelboym (Citationin press).
4. Results
In this section, the results from the application of the proposed framework to the case study are presented. presents the SACU steel value chain, with the RCA (for the SACU) and the (generic) complexity values for each of the activities in the value chain indicated at the tier and activity level. In this figure, and throughout the remainder of the text, we use a color spectrum to ease the interpretation of results; spanning from red (representing the least desirable from the perspective of a focal country), across orange, then yellow, and lastly to green (representing the most desirableFootnote19).
Figure 1. Iron and steel GVC adapted from Bam and De Bruyne (Citation2019). For each tier and category, the average RCA (for the SACU) and complexity for 2018 is indicated.
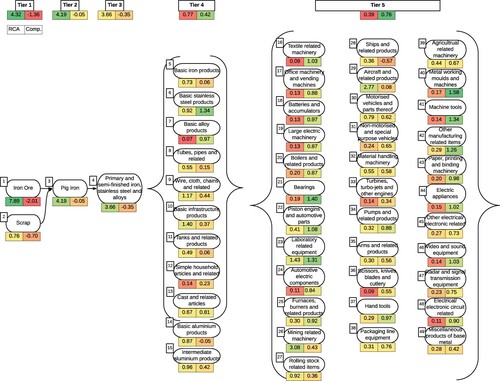
The SACU has a revealed comparative advantage (RCA value of larger than 1) mainly in the tiers which constitute the less processed items, i.e., in tiers 1 (Iron ore), 2 (Pig iron), and 3 (Primary and semi-finished iron, stainless steel, and alloys). However, there are also some GVC activities in the more processed tiers 4 (Wire, cloth, chains and related, and Basic infrastructure products) and 5 (Laboratory and related equipment, Mining and related machinery, and Aircraft and related products) for which the SACU already has an RCA>1.
Unfortunately, as illustrated in , only tiers 4 and 5 have average positive complexity values (with average values of 0.42 and 0.76, respectively), and all the activities for which the SACU has an RCA have a negative complexity value (with iron ore having a value of −2.19) or only modestly positive values (all below 0.5). The only exception is laboratory related equipment, with a complexity of 1.31. Hence, the SACU has a comparative advantage mainly for those activities in the value chain that are not associated with high per capita income and complex capabilities.
This means that a comparative advantage still needs to be developed for most of the higher complexity activities within the iron and steel value chain. However, by only studying complexity and RCA, which of these GVC activities should be prioritized for policy support from a sustainable development perspective remains unclear. To address this, we include the consideration of PGI (social aspect) and the percentage of green products (environmental aspect) per GVC activity. Table A2 in Appendix 2 provides an overview of the results. From Table A2, it is not apparent which sectors should one be targeted when taking the four metrics simultaneously into account. On average, the further down the value chain, the higher the expected difficulty (and expected investment) of attainment for the SACU (as the distances to the opportunity products are higher). The bearings sector scores high on the economic, social and green objective. This makes sense as it is a sector crucial in machine development (and machinery situates itself in the center of the PS) and it is mainly produced in developed countries with low(er) Gini indices. Thirdly, one of the top PCI goods is “machines designed for a wide range of areas of environmental management including waste, wastewater, drinking water production and soil remediation” (Mealy & Teytelboym, Citationin press) – goods where bearings are again an indispensable part of. However, at least 70% of the sectors in the GVC require a lower investment than bearings (based on the distance metric), illustrating the importance of the investment aspect of industrial policy as well.
To identify the specific GVC activities for further evaluation, we perform a multi-criteria Pareto-optimality analysis. A GVC activity is considered Pareto-optimal if there is no alternative GVC activity that provides a better value for any one of the metrics, without sacrificing performance on another metric. Therefore, the Pareto-set of Pareto-optimal activities will consist of activities that capture the full range of theoretically optimal trade-offs between the four metrics. In contrast, for each GVC activity in the dominated (non-Pareto-optimal) set, another GVC activity exists which provides better performance on one metric, and better or equal performance on all other metrics.
plots the performance of the Pareto-optimal and dominated opportunities according to three dimensions, with each dot representing a GVC activity. On the horizontal axis, the average complexity of unattained products in the activity is indicated, while the vertical axis represents the average PGI of the unattained products in each activity. The size of each dot indicates the percentage of green opportunity products in each GVC activity. Grey dots indicate Pareto-dominating GVC activities.
Figure 2. Pareto-optimal (grey) and dominated (white) set of unexploited opportunities within the iron and steel GVC considering all four metrics in the Pareto calculation.
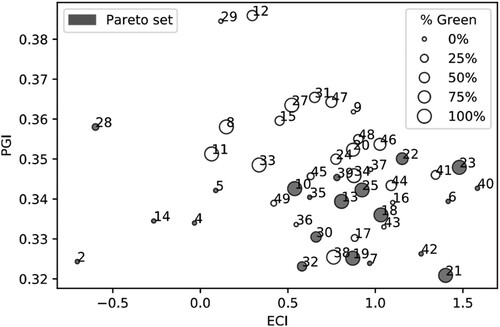
Looking at , 21 out of the 46 GVC activities with unexploited opportunities are Pareto dominating, which still leaves an extensive list of possible GVC activities to investigate further. Recall that the Pareto-set was constructed not presupposing a weighting of objectives. However, policy makers might want to give precedence to a particular objective or combination of objectives.
In the last step of our analysis, we conduct a sensitivity analysis to calculate the resulting Pareto set if any of the four objectives were to be considered less important to stakeholders. In practice, this implies that we determine the Pareto-set of unexploited opportunities for four cases, where each time one of the objectives is excluded from the Pareto calculation. (a)–(e) summarize the results.
Figure 3. Pareto-optimal (grey) and dominated (white) set of unexploited opportunities within the iron and steel GVC considering three constraints in the Pareto calculation (a–d) and only economic considerations (e). (a) Excluding distance from Pareto calculation. (b) Excluding complexity from Pareto calculation. (c) Excluding % green from Pareto calculation. (d) Excluding PGI from Pareto calculation. (e) Only considering distance and complexity.
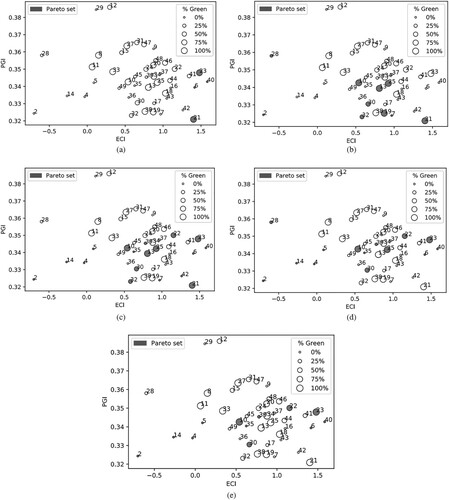
The first general finding is that the Pareto-set changes as objectives are excluded. summarizes which of the 21 activities from the combined Pareto front, as seen in , are included in each of the Pareto fronts, excluding one of the metrics (as illustrated in (a)–(d)) or when only considering the traditional IO-PS metrics of distance and complexity (as illustrated in (e)). Four activities (2, 10, 25, and 30) are sensitive to the inclusion of the distance metric. This implies that these activities only provide good performance in terms of the other metrics if their attainability is considered. Three activities (6, 23, and 40) only provide good performance if the economic metric (complexity) is considered. Finally, one activity (21) is only optimal if the inequality metric is included. The other 13 activities require different combinations of at least two of the metrics in the calculation of the Pareto front to be considered optimal. Of these 13 activities, two (42 and 19) require three metrics to be considered, and one (18) requires all four metrics to be considered to be included in the Pareto-set. Interestingly, no activity is only sensitive to the exclusion of % green. Only 12 of the 21 activities would have been included in the Pareto-set if only the traditional metrics had been employed.
Table 1. GVC Activities belonging to the Pareto-set for when different metric combinations are considered.
Given the results, it might be prudent to focus on the eight activities (2, 6, 10, 21, 23 25, 30, and 40) whose inclusion into the Pareto-set is only sensitive to a single metric. These activities can be deemed to be optimal under the broadest range of policy aims and assumptions. One might further reduce the eight activities by identifying which metric might be deemed of secondary importance. For example, if distance is of secondary importance (i.e., the government is dedicated to development regardless of the difficulty of attaining an activity), then four activities (2, 10, 25, and 30), would no longer be considered part of the optimal set. Similarly, three activities (6, 23, and 40) would be excluded if economic growth is of secondary importance, and one (21) if PGI is of secondary importance. Interestingly, only two of the eight activities (21 and 25) would not have been identified using the traditional IO-PS metrics (distance and complexity).
5. Discussion
The eight Pareto-optimal activities that we ultimately identify are situated in tiers 4 and 5 (barring scrap, which is a by-product of other activities). Similar to the results obtained by Bam and De Bruyne (Citation2019), this suggests that a strict beneficiationFootnote20 approach (where each tier is developed consecutively) is not necessarily the optimal strategy. Rather, a “leap-frogging” approach seems more desirable, where those activities that best reach the goals set out by governments given the unique production structure of a country are targeted. This suggests that the flagship African Commodities Strategy that forms part of the African Union Agenda 2063 should be implemented in a nuanced manner with due consideration for the endowments of each country for optimal benefit.
Furthermore, five of the eight least sensitive Pareto-optimal activities identified in this study align with the (distance sensitive) results of the IO-PS study of the iron and steel sector by Bam and De Bruyne (Citation2019) that only focused on distance and complexity and did not include PGI and % green metrics. The importance of sector 30 (Motorized vehicles and parts thereof) also became clear in a study on the South African automotive industry by Bam et al. (Citation2021) that suggested (among others) targeting passenger vehicle bodies, passenger vehicles, and vehicle parts. This indicates (at least partial) alignment between the results of IO-PS studies using data from different years, optimization techniques, metrics, and different levels of data aggregation. This suggests that the results from the IO-PS are, at least internally, robust.
Our findings also illustrate the limitations of the approach suggested. First, the results indicated that activity 2 (Scrap) is worthwhile to target. This appears counterintuitive; it is a sector with a low complexity. This indicates that it might be worth adding threshold values to limit the extensiveness of the Pareto front to certain target ranges for each variable (e.g., limiting the acceptable levels of complexity to those that are larger than, or equal to, the average value for the country). Another potential issue with our approach is that Pareto-optimality misses near-optimal products by potentially over-estimating the accuracy of the metrics derived. Moreover, Pareto-optimality becomes less informative the more conflicting objectives are added and more options deemed optimal. This could again be addressed through threshold values.
Finally, the adoption of the TBL has traditionally been framed to suggest win-win-win outcomes (Ferraz et al., Citation2021). As is increasingly becoming clear, these dimensions are often in tension. While there are of course optimal trade-offs, trade-offs will be inevitable. However, this did not come out as strongly in this study as expected. This might be because the metrics employed cover only a limited range of the vast scope that entails sustainable development (e.g., our environment index does not include deforestation, indirect plastic pollution, impact on biodiversity, noise pollution, etc., while our social sustainability-oriented metric does not consider important issues such as unemployment, education, empowerment, forced labor, etc. Even the economic measurement might be extended to include issues, such as the prevalence of anti-competitive practices and the ease of doing business). Clearly, even within a single TBL dimension, outcomes might be in tension (for example, using plastic water bottles might increase plastic pollution, but might reduce CO2 emissions during transport due to lower weight). Hence, future work might focus on identifying which additional metrics could improve the coverage of PS-based analytical frameworks, and how best they can be integrated in decision-support systems to inform holistic industrial policy decision-making.
6. Conclusions
Industrial policies have traditionally focused primarily on the attainment of economic growth. With the formulation of the SDGs, the United Nations emphasized the importance of sustainable development (i.e., including the social and environmental dimensions in addition to economic outcomes), and so did the AU in its Agenda 2063 aspirations. The decision-making framework we develop simultaneously considers aspects of the three sustainability pillars (viz., growth, inequality, and green products), while taking the difficulty of attainment into account, and as such provides an initial guide for optimizing industrial policies that seek to support sustainable development.
The novelty of our paper is twofold. First, we combine the emerging PS-based green, social, and economic considerations within the value chain centric IO-PS framework. Second, we apply a multi-criteria analysis to determine the Pareto-optimal unexploited opportunities within a GVC. We illustrate our analysis with a concrete case of the iron and steel global value chain in the SACU. We found that depending on the importance that the government attaches to each of the objectives, different GVC activities will be selected for further evaluation. We also illustrate the congruence of the results with previous IO-PS studies, and the implications of the results for policy implementation.
The case study highlights the key areas for future studies that could further improve the value that might be obtained from this line of research. Indeed, we realize that our framework requires further expansion. First and foremost, other objectives in each sustainability dimension need to be included. For instance, instead of opting for complexity as an economic objective, one could select the opportunity gain or employment of a GVC activity. The choice of metrics included would need to be tailored to align to the specific policy context within which the framework is implemented. Secondly, we only consider the supply side in determining the optimal industrial policy. Our analysis should therefore be complemented with a market study of the targeted GVC activities at hand. Finally, in the second stage, detailed analyses of the different prioritized GVC activities are needed to guide policy decision-making. Such analyses should address in more detail aspects such as the potential required investment for attaining an activity, feasibility of inserting in the GVC given the prevailing dynamics in the global market, and an evaluation of the wide-ranging impacts expected from successfully inserting in the GVC, including unanticipated adverse consequences. A selected GVC activity might for instance be associated with a positive impact on CO2 emissions and equality but increase noise pollution and forced labor. Additional metrics as well as detailed GVC analyses are therefore crucial to fully inform industrial policy decision-making.
Disclosure Statement
No potential conflict of interest was reported by the authors.
Additional information
Funding
Notes on contributors
W.G. Bam
Wouter Bam is a Senior Lecturer in the Department of Industrial Engineering, Stellenbosch University, South Africa. His research deals with industrial policymaking, inclusive innovation and decision support systems.
K. De Bruyne
Karolien De Bruyne is Assistant Professor at the Faculty of Economics and Business of KU Leuven. Her research deals with international trade and global value chains, development economics, labor economics and location decisions of firms.
Notes
1 The SACU is a customs union among five countries of Southern Africa: Botswana, Eswatini (formerly Swaziland), Lesotho, Namibia, and South Africa. The trade data for these countries are combined in the BACI trade dataset. South Africa accounts for approximately 87% of SACU’s exports to the world (Tralac, Citation2018).
2 Such as GVC and GPN analyses.
3 The Economic Complexity Index (ECI) measures the sophistication of a country’s productive structure by combining information on the diversity of a country (the number of products it exports), and the ubiquity of its products (the number of countries that export that product) (Hidalgo & Hausmann, Citation2009).
4 The Gini coefficient compares a country’s income distribution to a perfectly equal income distribution to determine how much the former differs from the latter. It can take a value between zero and one – where zero represents the hypothetical case of perfect equality and one represents the hypothetical case of perfect inequality.
5 Detailed analysis: see Appendix 1.
6 Using the Eurostat definition of Green Goods.
7 Using a new comprehensive dataset of 293 green products from the environmental goods classifications developed by the World Trade Organization (WTO), the Organization for Economic Corporation (OECD), and the Asia-Pacific Economic Corporation (APEC).
8 Environmentally Preferable Products.
9 An alternative chosen as the best out of a set X, fails to be chosen when another, perhaps unimportant, alternative is excluded from X.
10 Only exceeded by the three developing countries, Brazil, China, and India.
11 Ranking 110th out of 128 in reporting countries in terms of emission efficiency in 2017 (UNIDO, Citation2021).
12 Having the highest estimated Gini index of any reporting country according to the World Bank (Citation2021b).
13 The country’s GDP per capita (in constant 2010 US$) increased by only 1.8% between 2009 and 2019, with per capita GDP growth negative since 2015 (World Bank, Citation2021a).
14 We would like to have performed our analysis at the national level. However, the BACI database only reports trade for the Southern African Customs Union (SACU), and not for each individual country. However, South Africa accounts for 87% of SACU’s exports to the world (Tralac, Citation2018).
15 Available at: https://github.com/WoutersResearchGroup/IO-PS
18 Similarly, in the case of Belgium and Luxembourg, which are aggregated in the BACI data, we use the Gini index of Belgium as proxy for both.
19 For RCA, complexity and percentage of green goods, higher values are deemed more desirable; for distance and PGI, lower values are.
20 Beneficiation refers to mineral producing countries aiming to ‘capture more value’ from their mineral resources by encouraging (or even forcing) the downstream value added to minerals before export (Bam & De Bruyne, Citation2017).
References
- African Union. (2009). Africa mining vision (Issue February).
- African Union. (2015). Agenda 2063: An overview of Agenda 2063. African Union Commission.
- Albeaik, S., Kaltenberg, M., Alsaleh, M., & Hidalgo, C. A. (2017a). 729 new measures of economic complexity (Addendum to Improving the Economic Complexity Index). (Arixv Working Paper (arXiv: 1708)). https://arxiv.org/abs/1708.04107v1
- Albeaik, S., Kaltenberg, M., Alsaleh, M., & Hidalgo, C. A. (2017b). Improving the economic complexity index. (Arixv Working Paper (arXiv:1707)). https://arxiv.org/abs/1707.05826v3
- Andreoni, A., & Chang, H. J. (2019). The political economy of industrial policy: Structural interdependencies, policy alignment and conflict management. Structural Change and Economic Dynamics, 48, 136–150. https://doi.org/https://doi.org/10.1016/j.strueco.2018.10.007
- Balassa, B. (1965). Trade liberalisation and ‘revealed’ comparative advantage. The Manchester School, 33(2), 99–123. https://doi.org/https://doi.org/10.1111/j.1467-9957.1965.tb00050.x
- Baldwin, R. (2011). Trade and industrialization after globalization’s 2nd unbundling: How building and joining a supply chain are different and why it matters. NBER Working Paper Series (No. 17716). Cambridge, MA: NBER. https://doi.org/https://doi.org/10.1007/s13398-014-0173-7.2
- Bam, W., & De Bruyne, K. (2017). Location policy and downstream mineral processing: A research agenda. Extractive Industries and Society, 4(3), 443–447. https://doi.org/https://doi.org/10.1016/j.exis.2017.06.009
- Bam, W., & De Bruyne, K. (2019). Improving Industrial Policy Intervention: the case of steel in South Africa. Journal of Development Studies, 55(11), 2460–2475. https://doi.org/https://doi.org/10.1080/00220388.2018.1528354
- Bam, W. G., De Bruyne, K., & Laing, M. (2021). The IO – PS in the context of GVC-related policymaking : The case of the South African automotive industry. Journal of International Business Policy, 4, 410–435. https://doi.org/https://doi.org/10.1057/s42214-020-00081-7
- Chitaka, T. Y., von Blottnitz, H., & Cohen, B. (2018). The role of decision support frameworks in industrial policy development: A South African iron and steel scrap case study. Sustainable Production and Consumption, 13(December), 113–125. https://doi.org/https://doi.org/10.1016/j.spc.2017.11.004
- Coe, N. M., & Yeung, H. W. (2019). Global production networks: Mapping recent conceptual developments. Journal of Economic Geography, 19(4), 775–801. https://doi.org/https://doi.org/10.1093/jeg/lbz018
- Cullen, J. M., Allwood, J. M., & Bambach, M. D. (2012). Mapping the global flow of steel. Environmental Science & Technology, 46, 13048–13055.
- de Melo, J., & Solleder, J. M. (2020). Barriers to trade in environmental goods: How important they are and what should developing countries expect from their removal. World Development, 130, 104910. https://doi.org/https://doi.org/10.1016/j.worlddev.2020.104910
- DTI. (2018). Industrial Policy Action Plan 2018/19–2020/21. Pretoria: DTI. https://www.gov.za/sites/default/files/gcis_document/201805/industrial-policy-action-plan.pdf
- Du Plessis, J., & Bam, W. (2018). Comparing the sustainable development potential of industries: A role for sustainability disclosures? Sustainability, 10(3), 1–30. https://doi.org/https://doi.org/10.3390/su10030878
- Ferraz, D., Falguera, F. P. S., Mariano, E. B., & Hartmann, D. (2021). Linking Economic Complexity, diversification, and industrial policy with sustainable development: A structured literature review. Sustainability, 13(3), 1265. https://doi.org/https://doi.org/10.3390/su13031265
- Fraccascia, L., Giannoccaro, I., & Albino, V. (2018). Green product development: What does the country product space imply? Journal of Cleaner Production, 170, 1076–1088. https://doi.org/https://doi.org/10.1016/j.jclepro.2017.09.190
- Gereffi, G. (2019). Global value chains and international development policy: Bringing firms, networks and policy-engaged scholarship back in. Journal of International Business Policy, 2(3), 195–210. https://doi.org/https://doi.org/10.1057/s42214-019-00028-7
- González, A., Ortigoza, E., Llamosas, C., Blanco, G., & Amarilla, R. (2019). Multi-criteria analysis of economic complexity transition in emerging economies: The case of Paraguay. Socio-Economic Planning Sciences, 68, 100617. https://doi.org/https://doi.org/10.1016/j.seps.2018.02.004
- Hartmann, D., Guevara, M. R., Jara-Figueroa, C., Aristarán, M., & Hidalgo, C. A. (2017). Linking Economic Complexity, institutions, and income inequality. World Development, 93, 75–93. https://doi.org/https://doi.org/10.1016/j.worlddev.2016.12.020
- Hausmann, R., Klinger, B. (2006). Structural transformation and patterns of comparative advantage in the product space. No. RWP06-041. KSG Working Paper.
- Hausmann, R., Hidalgo, C. A., Bustos, S., Coscia, M., Chung, S., Jimenez, J., Simoes, A., Yıldırım, M. A. (2011). The Atlas of Economic Complexity: Mapping Paths to Prosperity. (2nd ed.). Cambridge, MA: MIT Press. http://www.tinyurl.com/y67m6n72
- Hidalgo, C. A., & Hausmann, R. (2009). The building blocks of economic complexity. Proceedings of the National Academy of Sciences of the United States of America, 106(26), 10570–10575. https://doi.org/https://doi.org/10.1073/pnas.0900943106
- Hidalgo, C. A., Klinger, B., Barabasi, A.-L., & Hausmann, R. (2007). The product space conditions the development of nations. Science, 317(5837), 482–487. https://doi.org/https://doi.org/10.1126/science.1144581
- Humphreys, D. (2013). New mercantilism: A perspective on how politics is shaping world metal supply. Resources Policy, 38(3), 341–349. https://doi.org/https://doi.org/10.1016/j.resourpol.2013.05.003
- Kano, L., Tsang, E. W. K., & Yeung, H. W. (2020). Global value chains: A review of the multi-disciplinary literature. Journal of International Business Studies, 51(4), 577–622. https://doi.org/https://doi.org/10.1057/s41267-020-00304-2
- Mealy, P., & Teytelboym, A. (in press). Economic complexity and the Green economy. Research Policy. Retrieved from https://doi.org/https://doi.org/10.1016/j.respol.2020.103948
- Salo, A. A., & Hämäläinen, R. P. (1997). On the measurement of preferences in the analytic hierarchy process. Journal of Multi-Criteria Decision Analysis, 6(6), 309–319. https://doi.org/https://doi.org/10.1002/(SICI)1099-1360(199711)6:6<309::AID-MCDA163>3.0.CO;2-2
- Singh, R. K., & Gupta, U. (2018). Social life cycle assessment in Indian steel sector: A case study. International Journal of Life Cycle Assessment, 23(4), 921–939. https://doi.org/https://doi.org/10.1007/s11367-017-1427-3
- Tacchella, A., Cristelli, M., Caldarelli, G., Gabrielli, A., & Pietronero, L. (2012). A new metrics for countries’ fitness and products’ complexity. Scientific Reports, 2(723). https://doi.org/https://doi.org/10.1038/srep00723
- Tralac. (2018). Southern African Customs Union (SACU)’s trade and tariff profile. https://www.tralac.org/blog/article/13807-southern-african-customs-union-sacu-s-trade-and-tariff-profile.html
- UNIDO. (2021). Industrial analytics platform. https://iap.unido.org/data/?p=ZAF
- United Nations. (2015). Transforming our world: The 2030 Agenda for Sustainable development. A/RES/70/1. General Assembley, October, 1–35. https://doi.org/https://doi.org/10.1007/s13398-014-0173-7.2.
- US Geological Survey. (2021). US Geological Survey. https://pubs.usgs.gov/periodicals/mcs2021/mcs2021-iron-ore.pdf
- Weber, M. (1997). Short note on ‘on the measurement of preferences in the analytic hierarchy process’ by A. A. Salo and R. P. Hämäläinen. Journal of Multi-Criteria Decision Analysis, 6(6), 338–339. https://doi.org/https://doi.org/10.1002/(SICI)1099-1360(199711)6:6<338::AID-MCDA169>3.0.CO;2-D.
- World Bank. (2021a). Database GDP. https://data.worldbank.org/indicator/NY.GDP.PCAP.KD?locations=ZA
- World Bank. (2021b). Database Gini. https://data.worldbank.org/indicator/SI.POV.GINI?most_recent_value_desc=true
- World Bank. (2021c). Global database of shared prosperity (8th edition, circa 2013–18). https://www.worldbank.org/en/topic/poverty/brief/global-database-of-shared-prosperity
Appendix 1. Product space metrics and sustainability considerations
Distance
To capture the intuition of distance, the product space (PS) makes use of the concept of proximity (), which itself relies on the concept of revealed comparative advantage (RCA). The seminal work of Hidalgo et al. (Citation2007) used the Balassa (Citation1965) definition to calculate an initial real RCA value. If
represents the exports of product i from country c, the RCA can be stated as (Hidalgo et al. (Citation2007)):
A country c “has an RCA” for a product i (denoted as = 1) if the product constitutes a larger share of its export basket than for the average country, i.e.,
. Otherwise, it “does not have an RCA” for the product (hence
= 0). The proximity of two products can then be calculated by evaluating the minimum pairwise probability that a country will “have an RCA” for both products. Mathematically, this is shown as:
(Hidalgo et al., Citation2007).
The metric distance can then be used to express how proximate a particular “unobtained product” j (a product with RCA < 1) is in the PS to the collection of products which a country already exports “with an RCA”, compared to all products in the PS. This can be expressed as:
(Hausmann et al., Citation2011).
It can be expected to be easier for a country to obtain an RCA for an unobtained product with a lower distance value (Hausmann et al., Citation2011).
Complexity
Hausmann et al. (Citation2011) applied the dimension reducing method of reflections to calculate the Product Complexity Index (PCI) for each product, and the Economic Complexity Index (ECI) for each country. This involves constructing an initial ranking of products according to their ubiquity (based on how many countries export each product) and of countries according to their export diversity (based on the number of different products exported by each). Then, an iterative process is followed, by which products are weighted by the average export diversity of the countries that export them and countries are weighted by the average ubiquity of their exports. This process is repeated until the rankings stabilize, at which point the product complexity and the economic complexity indices are normalized to obtain the PCI and ECI of each product and each country, respectively.
Opportunity Gain and Opportunity Value
The opportunity value () of a country c is the product of the complexity of all products j for which the country does not have an RCA and the density of that country in terms of each product. The density of product j (
is the proximity between all products for which a country has an RCA and product j divided by the sum of the proximities between all products and product j. This can mathematically be expressed as:
Opportunity gain then expresses how a country’s opportunity value will change if it were to achieve an RCA for a product for which it does not yet have an RCA. A positive value will mean that by developing the capabilities to export the focal product, the country will reduce its distance to other high complexity goods in the PS. This can then be expected to reduce the difficulty of developing the capabilities to produce these high complexity goods in the future. It thus gives an indication of whether the product unlocks growth opportunities in the longer run.
Product Gini Index
The PGI of a product p is computed by weighting the average Gini coefficient of all countries that export the product by the importance of product p to each country’s total exports:
where Mcp is a matrix of binary values, in which (c,p) equals 1 if country c has an RCA in product p and 0 otherwise. Ginic represents the Gini coefficient of country c and Nc is calculated as:
where Xcp is the value of product p exported by country c.
Appendix 2. Average complexity, % of green products, average PGI, and average distance for all opportunity products (RCA < 1) in each activity of the iron and steel GVC
Table A2 includes (i) the average complexity, (ii) the percentage of green products, (iii) the average PGI, and finally (iv) the average distance for all opportunity products (RCA < 1) within each GVC activity. The opportunity products are those products in the GVC activity for which the country has an RCA < 1 and, therefore, still has an “opportunity” to develop an RCA for. As was clear from , for most iron and steel GVC activities, the SACU has an RCA < 1. The question is whether any – and if so which – of these GVC activities are best to investigate further for development. Table A2 includes three metrics that each address one dimension of sustainable development. It also adds a fourth factor indicating expected difficulty of attainment (and likely investment required) through the metric of distance. Thus, we have four objectives to take into account simultaneously.
From Table A2, it is not immediately obvious which sectors one should target when taking the four metrics simultaneously into account. Generally speaking, the more one moves down the value chain, the higher the required expected investment will be (as the distances to the opportunity products in each activity are higher). As far as our three sustainable development objectives are concerned, GVC activities 6 (Basic stainless steel), 21 (Bearings), 23 (Laboratory related equipment), and 40 (Metal working molds and machines) score high from an economic point of view, while 6 and 40 score poorly from an environmental point of view. Indeed, 68% of the GVC activities score better than these two GVC activities from an environmental (green product) point of view. From the point of view of income inequality, targeting GVC activity 21 (Bearings) appears to be the most promising, followed by 7 (Basic alloy products), and 19 (Large electric machinery).
Table A2. Average complexity, % of green products, average PGI and average distance for all opportunity products (RCA < 1) in each activity of the iron and steel GVC.