
ABSTRACT
This paper explores the historical relationship between the expansion of the UK HE system through sectorial diversification, processes of differentiation/convergence and (in)equalities since the 1960s. It examines the extent to which the connections and tensions between three stories of resource, mission and social differentiations might be influenced (alongside other forces) by the emergence and crisis of successive socio-economic regimes. The empirical analysis of the three types of differentiation compares and contrasts new historical data on funding, enrolment and qualifications for the whole system and its institutional segments. The analysis shows that the ongoing tensions between resource, mission and social differentiations were exacerbated by the effect of the crises of 1973 and 2008 which provoked their misalignment and the destabilisation of the phases of expansion started in the 1960s and the 1990s. This pleads for a new social compromise to overcome the 2008 crisis to which a new HE expansion based on a realignment of, rather than a trade-off between the three dimensions of differentiation might contribute. This realignment requires a reversal of the public/private substitution of funding ensuring that a less unequal resource differentiation reflects and drives fairer processes of mission differentiation or convergence rather than stratifying social inequalities.
Introduction
This paper explores the relationship between the expansion of HE system through sectorial diversification, processes of differentiation/convergence and (in)equalities. In theory, HE systems could expand with or without institutional differentiation. However, the historical trajectories of many countries suggest that the processes of expansion and institutional differentiation of HE are often connected. Complementary and sometimes conflicting social, political, economic and cultural rationales have shaped HE systems around key dichotomies such as elite/mass, public/private, local/global, teaching/research and vocational/academic underlining the role of differentiation. The various positions regarding differentiation in HE systems range from positive accounts of diversity to more critical interpretations of inequalities. These debates have been revived by brewing tensions around HE funding and inequality revealed by the 2008 crisis. This paper offers a historical perspective to those dilemmas by exploring the process of expansion of UK HE since the 1960s through the three interconnected lenses of resource, mission and social differentiations. It examines the extent to which those processes might be time contingent and influenced (alongside other forces) by the emergence and crisis of successive socio-economic models.
Section 1 discusses the three stories of resource, mission and social differentiations – namely how the various groups of HEIs are resourced (funding, status), what they do and who they admit. The literature underlines the interconnections between the three stories and the difficulty of disentangling them. Thus, each story is discussed in the light of its connections and tensions with the two others. Section 2 presents the methodological approach. This interdisciplinary approach combines the history of education to a political economy framework based on long economic cycles explored in conjunction with other political, social and cultural interpretations of the processes of expansion and differentiation in HE. The term ‘story’ recognises that differentiation can be explored through different, complementary and sometimes competing lenses. The empirical analysis draws on new quantitative historical data on funding, enrolment and qualifications of the various sectors of the UK HE system since the 1960s used as proxies for the expansion and differentiation. Section 3–5 present the findings emerging from the trends and patterns of each story of differentiation. The conclusion reflects on the connections and tensions between the three stories and their relation to distinctive socio-economic models.
Three stories of differentiation
Many countries have developed high participation HE systems (Cantwell, Marginson, and Smolentseva Citation2018; Marginson Citation2016a) through a process of aggregation of various types of institutions (Huisman et al. Citation2015). In that sense, Trow’s (Citation1974) model of expansion from elite (up to 15% enrolment rates) to mass (16% to 49%) and universal (50%) HE is as much about the institutional layers of a system as it is about its scale. The exploration of institutional differentiation has received an increasing amount of attention in the literature (Altbach, Reisberg, and de Witt Citation2017; Boliver Citation2011; Bowl, McCaig, and Hughes Citation2018; Reimer and Jacob Citation2011; Shavit, Arum, and Gamoran Citation2007). Differentiation is associated with various drivers such as democratisation, the knowledge economy, the expansion of secondary education and specialisation regarding teaching and research (Varghese and Puttmann Citation2011). According to Van Vught, differentiation
as a response to various students’ needs, response to social mobility, response to the labour market, meets the needs of a variety of political groups within society, a mutual intents for a combination of mass and elite HE, innovations and low risk experimentations. (Citation2009, 4)
This paper explores the historical links between the expansion of HE systems through sectorial diversification, processes of differentiation/convergence (the contrasts or comparisons in the missions, financing and character of different sectors and/or different institutions within the same broad sector) and questions of (in)equalities. These links are examined through the lens of the connections and tensions between the three stories of resource, mission and social differentiations.
Resource differentiation: inequality or trickledown effect?
Resource differentiation refers to the differentials in reputation and wealth between groups of institutions. In a context of declining public funding, increased marketisation (Komljenovic and Robertson Citation2016), greater diversification of income and autonomy, the origins and consequences of resource differentials have been fiercely debated, even leading to question the relevance of thinking in terms of HE system (Boliver Citation2015; Scott Citation1995; Shattock Citation1996). The idea that a concentration of resources within an elite sector benefits to the whole system contrasts with the view that ‘in highly stratified systems there is no downward trickle but, rather, an upward spiral of resources and status’ (Naidoo Citation2018, 612). This debate on distribution has become even more polarised as institutions are increasingly challenged by scarce resources and involved in an intense national and international competition framed by the discourses and policies around excellence and the world-class university driven by the growing influence of league tables (Hazelkorn Citation2015).
Although the forms of resource differentiation vary according to countries and time periods (elite institutions might be universities or other HE institutions, public or private although this latter distinction is increasingly blurred) (Enders and Jongbloed Citation2007), the concentration of resources in elite institutions is widespread. Interestingly, resource concentration raises similar tensions in very distinctive contexts such as, for instance, the French Republican system (universities/Grandes Ecoles) (Carpentier and Courtois Citation2020), the highly differentiated US State systems (community colleges/public/private universities) (Marginson Citation2016b) and the UK binary (public/university sectors) and unified systems (old/new universities) (Parry Citation2009; Scott Citation1984; Shattock Citation2012). Those tensions are also historically contingent questioning whether specific periods or socioeconomic contexts might be more or less favourable to resource differentiation. Those long-term evolutions matter as ‘the inter-institutional inequalities in the amount of available resources’ (Goastellec Citation2010, xiii) affect the two other stories of mission and social differentiation discussed next.
Mission differentiation/convergence: possibilities of level playing field and genuine division of labour?
Processes of mission differentiation/convergence of HE systems refer here to the activities of institutions including teaching and research, vocational and academic orientations as well as local, national and international outlooks. Those processes vary across countries and times ranging from horizontal differentiation (a diversity of institutions based on knowledge, activities and missions) and vertical differentiation (a hierarchy between similar institutions based on quality or reputation) (Marginson Citation2016a). It is worth noting that formal mission differentiation may differ in practice due to institutional isomorphism (DiMaggio and Powell Citation1984) characterised by non-elite institutions aspiring to emulate elite institutions. A good illustration of this is the process of academic mission drift within binary systems, by which non-university institutions shift from vocational to academic HE (Neave Citation1979; Pratt Citation1997; Tight Citation2015). Thus an academic drift, implying that at least one type of institution changes to align with another type, does not necessarily mean convergence which suggests that all institutions change towards a common model.
Historical and spatial contingency of mission convergence/differentiation are acknowledged by Teichler when arguing that ‘in the 1980s, attention shifted gradually towards “vertical” differences among institutions of formally the same type (Citation2008, 1) which became amplified by globalisation in the 1990s and the emergence of the world-class university’ (Citation2008, 349). This strengthened association between geographical engagement (local/global), prestige and mission is symbolised by the global research university topping the influential league tables (Musselin Citation2018). This dominant model suggests further stratification of universities at national and global levels (Unterhalter and Carpentier Citation2010) although the construction of a global academic ecosystem (Barnett Citation2017) remains an open process as institutions and HE systems are shaped and transformed by complex and evolving interconnections between local, national and global forces (Marginson and Rhoades Citation2002). For instance, contextualised responses to globalisation have produced both institutional convergence (homogenisation) and divergence (local specificities) (Vaira Citation2004).
A key question (strongly connected to resource distribution) is whether mission convergence or differentiation respectively reflect a level playing field and a genuine division of labour (Birnbaum Citation1983) between institutions or hide more problematic inequalities in resources and status leading to a stratification of access.
Social differentiation: widening participation or stratification of inequalities?
The key distinction between ‘increasing participation’ in the sense of massification and ‘widening participation’ for under-represented groups questions the extent to which institutional diversity might explain advances and setbacks in the inclusion of those groups. The fact that social reproduction through stratification starts at school does not exempt HE from its responsibility in perpetuating intersectional inequalities related to gender, class and ethnicity (Burke Citation2012; Unterhalter and Carpentier Citation2010). The spectre of a ‘stratification of student opportunity’ (Bastedo and Gumport Citation2013, 355) raises a dilemma on whether institutional differentiation might be reinforcing rather than eliminating such inequalities. One strand of interpretation considers differentiation as a process of inclusion arguing that although it ‘is commonly viewed as a consequence of expansion, it may also contribute to expansion, as new places become available in new segments of the education system’ (Shavit, Arum, and Gamoran Citation2007, 4). Another strand interprets differentiation as a process of diversion reproducing social distinction by isolating underrepresented groups in specific segments of the system, (Boliver Citation2015; Bourdieu and Passeron Citation1964; Gallacher Citation2014; Lucas Citation2001; Reay, David, and Ball Citation2005; Scott Citation1995). Interestingly, the debates on inclusion/diversion cover many countries and distinct HE systems. This is, according to Marginson, unsurprising because HE is a positional good and that consequently ‘the tendency to stratification of institutions on the basis of unequal value is inevitable where there is inequality of wealth and status and social competition for a limited number of well-paid professionals’ (Citation2016b, 81). The shift in the debates from access to ‘what kinds of higher education are accessed by what kind of students for what kind of outcomes’ (Parry Citation2015, 15) has led to complement the questions of availability and accessibility to HE to discussion of ‘horizontality’ characterised as diversity with ‘even prestige and quality across the system’ (McCowan Citation2016, 659; Citation2019) or attainability dependent on the problematic link between social origins and reputational stratification (Carpentier, Lebeau, and Välimaa Citation2018).
From an historical perspective, the tendency towards social stratification incites to explore whether, and under which conditions, some periods might be more or less conducive to unequal (vertical or horizontal) processes of differentiation. This requires connecting the three stories of differentiation. For instance, social differentiation is not only connected to resource differentiation (whether the best-resourced segments of a system necessarily welcome the most privileged students) but also to mission differentiation/convergence (for instance whether an academic drift of non-elite institutions might lead to exclude the traditionally underrepresented social groups they were supposed to welcome or to offer them access to academic knowledge previously denied to them).
Those connections and tensions plead for contextualisation. For instance, although Kogan considers differentiation as irresistible and functionally right, he warns that it must ‘be handled with more thought than has hitherto been exercised about the conditions under which it is fostered’ (Citation1997, 62). Based on the UK context since the 1960s, this paper examines the extent to which some of those socio-economic conditions might explain the ways in which the expansion of the HE system might be driven or constrained by the interconnections or tensions between resource, mission and social differentiations.
Approach and methodology
The multifaceted relationship between socio-economic changes and the expansion and differentiation of HE is explored through an interdisciplinary approach combining the history of education and political economy. The empirical exploration of the relationship is based on the comparison of historical data on funding and enrolment of the whole HE system and its various institutional segments in the UK since the 1960s.
An interdisciplinary lens: political economy and history of education
According to Clark ‘much can be learned about the differentiation of academic systems by analysing the historical origins and especially the persistence over long periods of time of the major forms that comprise existing structure’ (Citation1978, 251). Those structures were influenced by competing or complementary economic, political, social and cultural rationales which have led to the emergence and transformation of various types of institutions, periodically reshaping HE systems since the medieval universities (Carpentier Citation2019). The understanding of past and present variations in differentiation can benefit from the dialogue between the history of education and social sciences (Aldrich Citation2003; Lowe Citation1988; McCulloch Citation2011; Sanderson Citation2007). The political economy lens adopted here considers socioeconomic change as one of the drivers of the processes of expansion and differentiation of HE systems, acting complementarily, and sometimes in tension, with other political, social, cultural forces.
The Regulation theory used here, which considers the long waves of the economy (or Kondratiev cycles) as the illustration of the dialectical relationship between economic and human development, offers a useful conceptual and historical lens (Boyer and Saillard Citation2002; Jessop Citation2007) to examine the relationship between the development of HE systems and socio-economic fluctuations. The Regulation theory emerged during the 1970s downturn to which it proposed an original interpretation based on the historical analysis of the emergence and crisis of successive accumulation regimes. Those regimes shared a tendency to become increasingly unequal, generating tensions between wealth creation and distribution which eventually derailed both productivity and demand, leading to socio-economic crises. Those crises were also turning points during which combined social, economic and political pressures created the conditions for key social transformations from which emerged a new regime of accumulation. For instance, the First Depression (1830–1848) and the Long Depression (1873–1897) coincided with increased public funding of the social sphere (including educational systems) which were decisive to revive economic development by operating what neoschumpeterians defined as a realignment of the social and technological systems (Freeman and Louçã Citation2001; Perez Citation2002). The severity of the Great Depression (1921–1939) and World-War-Two engendered even more fundamental transformations crystallising into what the regulation theory called (following Gramsci Citation1971) the Fordist regime of accumulation. This new regime was based on the co-development of organisational and social transformations under a new labour/capital compromise producing a dynamic equilibrium between mass production and consumption. Despite national specificities, this compromise was generally driven by procyclical Keynesian policies turning productivity gains into higher wages and social spending generating in returns new sources of productivity. Under this Fordist regime, the expansion of the social activities driving human development (such as educational systems) became a condition of post-war economic development rather than a corrector of crisis (Fontvieille and Michel Citation2002).
The Long Stagnation (1973–?) characterised by stagflation (low growth and high inflation) marked the crisis of the Fordist accumulation regime, disrupting the social compromise linking productivity and demand. Post-Fordism has taken many forms according to countries but has been often associated with a rolling back of the Keynesian welfare state and the neoliberal turn of the 1970s from which eventually emerged a finance-dominated accumulation regime (Labrousse and Michel Citation2017) which fuelled a new phase of growth in the 1990s. Within this new regime, (re)concentration of income at the top (Piketty Citation2020), reduced taxation (Saez and Zucman Citation2019), deregulation and financialisation of the global economy coincided with control of wages and public spending leading to an increasingly marketisation of the social sphere (Van der Zwan Citation2014, 111) including educational systems (Carpentier Citation2015). The Great Recession (2008–?) marked the inability of this finance-led accumulation regime to address the issues of inequalities and private debt. The failure of austerity policies has raised the prospect of the necessary emergence of a new regime of accumulation (or a sixth Kondratiev cycle) jointly addressing those key socio-economic issues and the crucial question of environmental sustainability. The distinctive social transformations that characterised the overcoming of the crises preceding those of 1973 and 2008 suggest that this is an open process.
As will be shown in detail later, an understanding of the emergence of both Fordist and post-Fordist regimes and their crises offers a useful contextualisation of the long-term evolutions of the connections and tensions between the funding, expansion and differentiation of HE systems. However, the Fordist/Post-Fordist framework should be seen as complementary to other social, political, demographic and cultural interpretations in order to capture the complexity of emergence and crisis of the post-war welfare states (Lowe Citation1994) and their implications for HE systems. The socio-political lens is particularly useful. For instance, Esping-Andersen’s (Citation1990) distinction between liberal (the UK), conservative and socio-democratic welfare states (Citation1990) explains key features of national HE systems. Olssen and Peters’ (Citation2005) analysis of the formation of the post-war ‘welfare liberal consensus’ offers a useful nuancing of policy variations adopted since it entered into crisis in 1973. This provides a critical basis for assessing the shift to marketisation and ‘neo-liberalism’ in HE. This leads to distinguish the neoclassical free market consensus from the 1980s from a more ambivalent period in the late 1990s characterised by backlash to aspects of both of the previous narratives and attempts to synthesise the State and market (Deem, Reed, and Hillyard Citation2007), before the post-2008 era marked a change towards a crisis ridden nature of policy and politics and the emergence of neo-austerity (Farnsworth and Irving Citation2018).
A quantitative history of HE expansion and differentiation
Empirically, the paper develops a quantitative history exploring the trends and patterns of the expansion and the three types of differentiation of UK HE since the 1960s. This is based on the construction of a dataset gathering historical statistics on funding, undergraduate and postgraduate enrolment and qualifications of the various institutional segments of the system. These data were extracted from the key HE funding bodies in the UK and its four nations, (see the statistical references). The dataset complements existing data on the university sector (Carpentier Citation2004) and polytechnics (Pratt Citation1997) with new data on the public sector of HE.
The structure of the dataset reflects the historical construction of the UK HE system through the co-development of the university and non-university sectors until their unification in 1992. The university sector (self-governing private corporations with charity status) can be traced back to the medieval universities of Oxford and Cambridge, the first universities in Scotland and Dublin. The next phase only started in 1826 with the creation of the secular London University which became University College London in 1836 and joined the new federal University of London alongside Kings College (1829). The first university in the north was created in Durham (1832). The mid-nineteenth century saw the creation of university colleges and civic universities across England responding to the middle classes’ quest for higher social status and a curriculum addressing industrial needs (Anderson Citation1992) as well as new universities in Ireland and the first Welsh universities. Most institutions eventually became Chartered universities. The sector continued to grow, especially during the 1960s with the creation of new universities (Filippakou and Tapper Citation2019) (including the Open University) and the granting of university status to colleges of advanced technology (CATs). The university sector developed massively after the Further and Higher Education Act 1992 granted the university status to many other HE institutions.
HE outside the university sector started with early forms of adult and HE (some of them vocational) such as the mechanics’ institutes, teacher education and higher technical colleges which became driven by local government after the 1889 Technical Instruction Act (Matterson Citation1981; Sharp Citation1987, 3). This public sector of advanced further education (FE) included various types of vocationally orientated institutions such as teacher training colleges, local technical colleges and CATs. It expanded considerably in the 1960s with the development of a binary system of HE based on the expansion, alongside universities, of local colleges of HE and polytechnics (offering degrees accredited by the Council for National Academic Awards). Many of those institutions became independent from local governments in 1988 and gained university status after the 1992 Act ended the binary system, while others remained in the local public sector providing HE in FE. This historical legacy remains strong today with the frequent use of terms such as Oxbridge, Russell Group, pre-/post-1992 universities, revealing and reinforcing explicit or tacit understandings of resource, mission and social differentiations.
The dataset illustrates this long story of institutional differentiation distinguishing the autonomous university sector and the public sector of HE until unification in 1992. Thereafter, it distinguishes pre-92 and post-92 universities and HE provision in FE colleges remaining in the public sector. When relevant, data on pre-92 universities distinguish the Open University (due to its size (5% of HE enrolment) and specificity as a distance learning provider) and the Russell Group (representing since 1994 the (currently 24) elite research universities).
Long-term comparisons of data raise challenges regarding their collection, process and interpretation. These are mitigated by the methodology of quantitative history which offers an exhaustive and coherent system of collecting and processing of data and provides homogenous statistical series that are comparable across time (Marczewski Citation1961) and space offering promising perspectives of international comparisons of HE systems (Carpentier Citation2012, Citation2018; Pietsch Citation2020).
The quantitative analysis of the three stories of differentiation are based on proxy indicators. Resource differentiation is estimated by the comparison of levels and structures of funding and enrolment by type of institution. Mission differentiation is approached by vocational/academic education, teaching/research activities and the degree of internationalisation of institutions approximated by the structure of qualifications awarded by levels (sub-bachelor, bachelor, postgraduate levels), the distribution of enrolment by mode (full-time/part-time), level (undergraduate/postgraduate), discipline (social science, science, engineering …) and geographical origins (UK/international) as well as the income structure (including research and fees). It is important to acknowledge some of the limitations of these proxies. For instance, the estimation of the vocational-academic divide by levels or modes of attendance should be interpreted cautiously. Although the majority of sub-degrees were vocational, some first degrees are vocational. Moreover, many but not all part-time studies are vocational. These limitations are discussed in more details on the findings sections. Social differentiation is estimated by the various institutions’ enrolment composition by gender, socio-economic groups (disaggregated by socio-economic categories, low/high participation neighbourhood, independent/state schools or colleges) and ethnicity.
Other advantages and limitations must be acknowledged. Firstly, although the chosen institutional classification makes sense in terms of differentiation, it is important to recognise that each institution is singular. Indeed, the institutions which became post-92 universities were different before getting their charters and probably even more thereafter. Moreover, sharp distinctions exist between pre-92 universities and between Russell Group universities with the specificity of Oxbridge (reputation, endowments) (Boliver Citation2015). Secondly, the dataset focuses on the UK and does not fully reflect the specific forms and trajectories of differentiation of the four nations (Raffe and Croxford Citation2013). Although HE enrolment is logically concentrated in England (82%) compared to Scotland (11%), Wales (5%) and Northern Ireland (2%) (HESAb Citation1995–current), it is important to consider the specific cultural traditions and effects of devolution since 1992 (fees, governance …) alongside the prevalence of the UK level in relation to research funding, admissions, university associations (Shattock and Horvath Citation2020, 170).
The analysis compares and contrasts historical trends on resource, mission and social differentiations of the various groups of institution and those of the whole HE system and matches them with key historical socioeconomic data. The difference between correlation and causality invites to resist an automatic synchronisation of the (systemic or sectorial) shifts in funding, study patterns and origins of students and to recognise that they are the products of various, and at times interconnected social, economic, political and cultural forces.
Resource differentiation: socio-economic regimes, funding models and number control
The story of resource differentiation is influenced by various interconnected political, economic, social, demographic and cultural factors. The following explores these interconnections through the lens of the emergence and crises of successive socio-economic regimes.
The Fordist financial commitment to the expansion of the binary system under controlled resource differentiation (1959–1973)
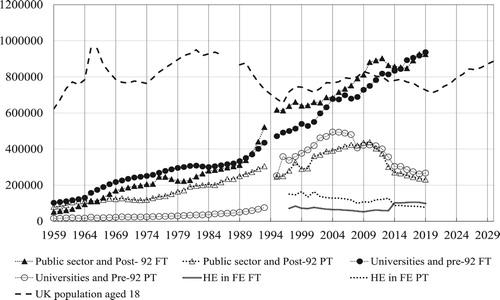
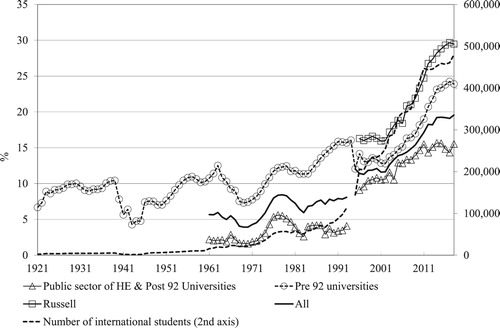
The strong post-war expansion of HE () responded to a mix of interrelated economic, political, cultural and demographic factors (Lowe Citation1988). Wars (including the cold war) have reinforced the technological and ideological role of education while the human and physical destructions they caused boosted progressive social attitudes and the acceptation of taxation to fund the social sphere. Those factors contributed to place education as a key social and economic investment of the Fordist agenda. This required to drive the democratisation of secondary education and absorb the baby boom generation, another (demographic) result from the war (), which was at the doorstep of HE in the early 1960s.
However, this post-war consensus on the expansion of HE contrasted with strong dilemmas regarding institutional differentiation. This tension was reflected by the reception of the 1963 Robbins Report which recommended an increase in the number and size of universities but was more equivocal about non-university institutions (Scott Citation2014). In 1965, Anthony Crosland, Labour Minister for HE, confirmed in his Woolwich speech his support for expansion but, unlike Robbins, opted for a binary system in which universities (funded centrally by the University Grants Committee (UGC) since 1919) would expand alongside an alternative public sector of HE (funded and run by local governments). Crosland had mixed feelings about the binary divide (Godwin Citation1998) which, on the one hand, contradicted his credentials on comprehensive secondary education but, on the other, had the potential to develop a more progressive public sector of HE. Such dilemmas mirror the multiple (and potentially competing) rationales for the binary system raising key questions at the interface of the three stories of differentiation. Is the binary system about developing a public sector susceptible of political direction, a sector of vocational HE, a widening participation sector? Can and should it be about all three?
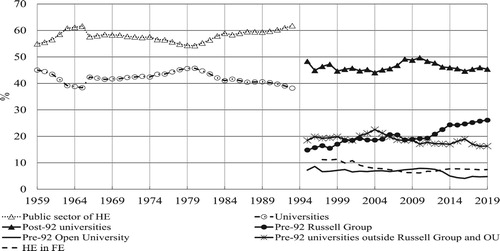
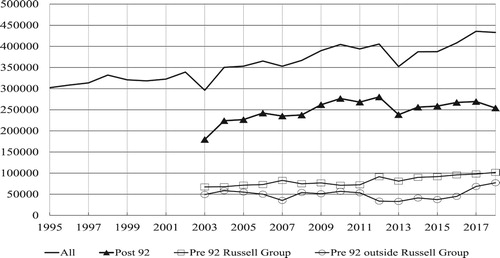
and show that the binary expansion was driven by the combined growth of both sectors. However, the public sector dominates (55%) and experienced the stronger growth driven by the rise in colleges of HE and the creation of CATs in 1956 and of 30 polytechnics from the mergers of colleges after 1965 (Pratt Citation1997). Importantly, the sudden decrease in the share of students in the public sector that same year was not due to its slower enrolment but to the transfer of the CATs to the university sector.
Figure 1. Enrolment by type of higher education institutions UK, 1921–2019. Sources: Carpentier (Citation2004); DESa (Citation1961–1982); DESb (Citation1983); DESc (Citation1984–90); DESd (Citation1988–93); HESAb (Citation1995–current); Woodfield (Citation2014) for private providers.
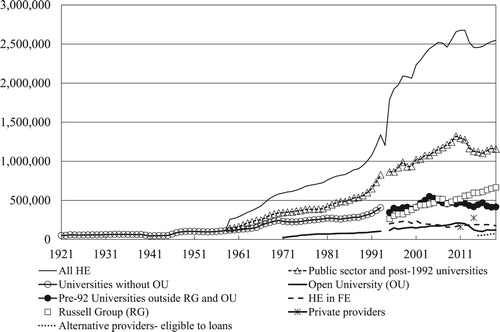
Figure 2. Share of enrolment by type of higher education institutions UK, 1959–2019. Sources: See .
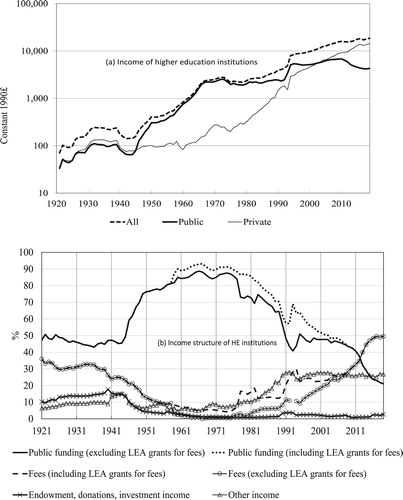
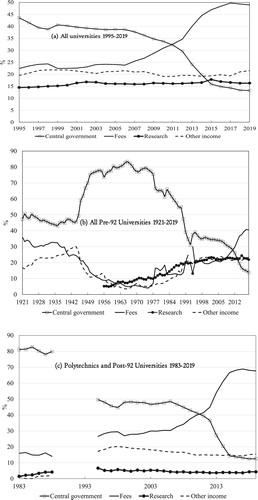
(a and b) examines HE income which grew in both sectors under a strong Fordist public financial commitment to institutions and students with the introduction in 1962 of grants for fees and maintenance. b distinguishes two ways of looking at the share of public funding and fees. One offers a more functional consideration of income aggregating all sources of funding of tuition fees received by institutions (whether paid directly by students or by public grants). The other distinguishes the source of funding and only records as fees the amount effectively paid by students while the amount paid for by local authorities is included in public funding (dotted line). a (which uses the second calculation) shows that the increasing resources in the university sector were driven by a huge rise in the level of public funding whose share of overall funding reached 85% in 1973 (b). Although comparable data for public sector colleges are unavailable, the rising share of local education authorities’ spending devoted to HE from 10% to 20% (Carpentier Citation2015) indicates a strengthened financial commitment in the public sector, further accelerated by the set up in 1959 of the Advanced FE Pool, a funding system based on solidarity between local education authorities.
Figure 3. Income of higher education institutions (universities only before 1992) UK 1920–2019. Sources: Data for Universities (Carpentier Citation2004). Data for polytechnics before 1995 (Pratt Citation1997, 244–245). Data for HE after 1992 (HESAa Citation1995–current).
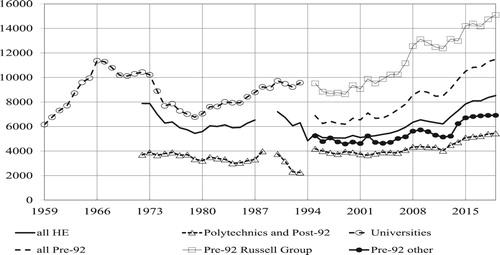
This financial support of the public sector was vital to absorb the rising number of school leavers as places in the university sector were capped and centrally managed by the UGC under pressure from the treasury (Shattock Citation2012). However, these differences in the number of places available in the two sectors combined with their different ability to attract additional public and private resources created a persistent unequal resource differentiation within the binary system. shows that although funding per student available to universities decreased during the 1960s, it was still twice as much as the one available to polytechnics in the early 1970s.
Figure 4. Resource (income) per Student at £1990 Prices, UK, 1921–2019. Sources: See for enrolment and for income.
The Fordist crisis and the clashes between funding and access policies: towards an unstable resource differentiation (1973–1988)
The long stagnation of the economy, triggered by the 1973 oil crisis, disrupted the Fordist socio-economic consensus by shifting policy towards lower taxation and control of public spending. Consequently, the share of HE income from public funding sharply decreased from 80% to 60% during that period (b). This shift had substantial implications for resource differentiation, although it is important to distinguish the 1970s from the 1980s due to policy variations regarding funding and student number control in both sectors.
From 1973 to 1979, the demographic upward pressure () was met by the binary system. The university sector continued to expand despite substantial cuts in public funding provoking a decline in spending per student (a and ). Meanwhile, the public sector also continued to grow (albeit at a slower rate) but with its resources per student protected () by the Advanced FE Pool (Ross Citation2003, 56). Noteworthily, the 1970s was the only period during which universities drove the expansion. However, this ended with the large cuts in the UGC budget imposed by the Conservative treasury in the early 1980s which led universities to limit their student numbers (despite a reduction in the size of the 18-year-old age group), restoring in the process the expenditure per student in the university sector. Polytechnics took advantage of the reduction of university places (Parry Citation2009, 4) to increase their enrolments (). However, this coincided with the capping of the local authorities’ advanced FE Pool in 1980 (Brown and Carasso Citation2013, 34), leading to a decline in funding per student. Expansion became once again driven by the economical growth of the public sector during hard times.
Thus, the weakened public funding commitment after the 1970s crisis eventually contributed not only to slowdown expansion but also to shift its dynamics after the 1980s driven by a restricted well-funded university sector and an expanding under-resourced public sector. Those gaps in resources were magnified by the higher reliance of the public sector on (declining) public funding and the university sector’s higher capacity to generate additional research and third-stream income (b and c).
Figure 5. Income structure by type of institutions UK, 1921–2019. Sources: see .
The austerity response to the Fordist crisis had not only progressively aggravated the slowdown of the overall expansion of the binary system in the 1980s (initiated by a demographic decline []) but had also further stretched the unequal resource differentiation (), undermining the possibility of developing a public sector as an alternative to university, moving further away from horizontality (McCowan Citation2016).
The post-Fordist expansion of a unified, cost-shared HE system without resource convergence (1988–2008)
The second phase of expansion in the late 1980s was, like the first one, initiated by the public sector () welcoming a large proportion of the increasing number of school leavers with the necessary qualifications to access HE (Bolton Citation2010, 12). This increase was not driven by demography as the number of 18-year-old continued to fall until 1995 () but rather by the expansion of comprehensive education and changes regarding exams (the creation of the General Certificate for Secondary Education (GCSE) and the reform of Scottish Highers improved both results and retention). However, this second expansion of HE occurred in a different context characterised by a post-Fordist regime hostile to public funding while (perhaps paradoxically) encouraging centralisation. This was symbolised by the 1988 Education Act which settled the ‘long-running dispute between central and local government’ (Pratt Citation1997, 306) by creating new funding Councils ‘more directly accountable to the government than their predecessors’ (Brown and Carasso Citation2013, 79). Polytechnics and colleges became corporations, independent from local governments and directly funded by a new Polytechnics and Colleges Funding Council (PCFC). The UGC, considered too accommodating to universities, was also replaced by the University Funding Council (UFC). suggests that attempts by both councils to reduce costs by making funding to institutions conditional on a bidding process for students have contributed to widened resource differentiation. Indeed, spending per student stabilised in the university sector (then in restricted expansion) and declined sharply in the public sector which continued to accept additional students on a fee basis without extra subsidies. This perceived affordability strengthened the case for polytechnics and some other colleges to be given university status. This, alongside the centralisation of funding and the similarities between the two new councils (Salter and Tapper Citation1994), paved the way for the shift towards a unified system in 1992. Overall, one of the key rationales behind a binary system which was to ensure political direction seemed no longer relevant after the 1988 Act had already increased the centralisation of the public sector and reduced the autonomy of universities. This increased centralisation justified unification and was also reinforced by it after the merger of the two councils into HEFCE, considered as a funding agency implementing government policy rather than a planning body (Scott Citation1995, 27).
and show that the new arrangements brought about by the unified system significantly boosted enrolment in a context marked by the rise of the 18-year-old age group () and despite the introduction of a student number control in 1993 (relaxed after 2002) by which universities could be fined for overrecruiting but could bid for extra students. However, the dynamics of expansion characterising the binary system remained similar. Only 10% of overall HE enrolment remained in the colleges of the public sector. Post-92 universities (ex-Polytechnics and colleges) continued to drive expansion (50% of overall enrolment), still at a lower (although increasing) cost per student than pre-92 universities (maintaining their 40% share of enrolment). The slight reduction in funding differential between pre- and post-92 universities () confirms that a motive behind unification was to develop competition and limit the cost per student of pre-92 universities (Collini Citation2012; Shattock Citation2012, 82). Importantly, the data also points to substantial resource differentiation between Russell group and other pre-92 universities. Thus, the early period of unification did not reduce but rather stabilised the pre-existing unequal resource differentiation. In a context marked by a stagnating share of public funding (b and c), unification did not alter the variable capacity of the groups of institutions to generate additional competitive public and private resources. Indeed, significant differences remained in attracting private research funding, competitive public funding (from research councils and from the Quality-Related (QR) research funding associated to Research Assessment Exercises since 1986), as well as higher international tuition fees.
More substantial changes in resource differentiation followed the gradual implementation of cost-sharing- where a greater share of the costs of HE are born by students and their family rather than the government and taxpayers. This key funding policy of the post-Fordist expansion started with the introduction of tuition fees for all international students in 1967 followed by full-cost fees for non-EU students in 1981, and all postgraduate students. In 1990, Cost-sharing was extended to domestic undergraduate students with the gradual replacement of means-tested maintenance grants by loans. A turning point was the introduction by the Labour Government of the 1998 Higher Education Act which increased the undergraduate student contributions with an upfront means-tested tuition fee of £1K per annum (with total and partial exemptions for students whose family’s income was less than £23K per annum and up to £35K). In addition, means-tested maintenance grants aimed at students from low-income backgrounds were abolished and all students became eligible for maintenance loans repaid via income-contingent repayments (contradicting the 1997 Dearing Report’s recommendation to keep grants and introduce deferred fees funded by income contingent loans). points to a limited impact of the 1998 reform on expansion and differentiation. Higher fees had a brief negative effect on undergraduate enrolment () and spared Russell Group universities whose students’ social background made them less likely to be affected by the abolition of grants (). Moreover, the fee increase was not substantial enough to affect institutions’ income structure (c) and only slightly increased the overall spending per student () without affecting the existing differentials of resource between institutions.
Figure 6. Total Full-time undergraduate entrants, UK, 1959–2018. Sources: HESAb (Citation1995–current).
By contrast, the introduction in 2006 of variable fees of up to £3K a year (except in Scotland which reverted to free HE for Scottish and EU students), significantly impacted resource differentiation (although most institutions charged the maximum fee permitted). Under this contested funding model (the 2004 HE Act was narrowly passed by Parliament with opposition outside and within the Labour party), undergraduate tuition fees became deferred, repaid via income-contingent loans by graduates earning above a certain income threshold (£15K in 2006). Graduates paid 9% of their income above this threshold with any outstanding debt written off after 25 years. Mean-tested grants were reintroduced for students from families earning less than £15K, and those studying more than 50% full-time equivalent. All students continued to be eligible for maintenance loans.
The implementation of the 2006 reform coincided with a slowdown in overall enrolment which cannot only be explained by the declining demography after 2008 () as the sectors and forms of enrolment were differently affected. A closer look shows that the slowdown was the result of a stagnation of full-time undergraduate entrants () and a more consistent and durable fall in the number of part-time students in pre-92 universities (especially those outside the Russell Group with the Open university particularly affected) (). This contrasted with the resilience of post-92 universities (whose students’ social background were more likely to benefit from widening participation policies and the reinstated grants []) which became the main drivers of overall enrolment and full-time undergraduate entrants until 2012 () while stabilising their part-time provision (part-time students did not benefit from maintenance grant). This underlines the distinctive impacts of the different student loan systems (Barr et al. Citation2019; Wyness, Murphy, and Scott Clayton Citation2019) and ‘the importance of government commitment to non-repayable forms of upfront support such as maintenance grants for undergraduate degree participation’ (Dearden, Fitzsimons, and Wyness Citation2014, 77). The 2006 reform did, unlike in 1998, boost the overall income per student due to a sustained public investment (the monies HEIs received from tuition fees did not affect the monies they received from government). However, this masked an increasingly unequal resource differentiation as rising enrolment in post-92 universities were not matched by resources due to their limited capacity compared to pre-92 universities to generate additional income from research, commercial activities and endowments (b and c). 2006 was the moment when pre-92 universities, and especially those from the Russell Group, significantly widened the existing gap in funding per student with post-92 universities which has never been closed since ().
Figure 7. Number of students by mode of enrolment (Full-time/Part-time) 1959–2019 and UK population aged 18, Numbers and projections. 1959–2030. Sources: Carpentier (Citation2004); DESa (Citation1961–1982); DESb (Citation1983); DESc (Citation1984–90); DESd (Citation1988–93); HESAb (Citation1995–current); ONS (various years).
Importantly, this trend of increasing unequal resources characterising the expansion of the 1990s and first half of the 2000s took place in a context where, despite increasing private funding, HE remains overwhelmingly funded by public expenditure. This will change after the 2008 crisis provoked a shift from cost-sharing to public/private substitution of funding () with strong implications for unequal resource differentiation.
The Great Recession and the shift to public/private substitution: an increased and transformed resource differentiation challenging the post-Fordist expansion (2008–?)
The 2008 Great Recession was a turning point for the post-Fordist socioeconomic regime (equivalent to what 1973 represented for the Fordist regime) and its model of HE expansion and resource differentiation for a number of reasons. Firstly, the recession led to cuts in public funding, initiated by the Labour government and brought to a next level by the austerity programme of the Conservative-/Liberal Democrat coalition government. This resulted in reductions in the government teaching grant in 2010 so drastic that they instantly provoked a decline in funding per student across the whole system () (despite stable enrolment due to a stagnating 18-year-old age group []). Secondly, the 2012 tuition fee rise which followed stood out not only due to its intensity (trebling to £9K per annum) but also because it was (unlike in 2006) contemporaneous with (or arguably linked to) further cuts in public funding. Undergraduate fees became entirely funded by income-contingent loans (the repayment threshold rose from £15K to £21K) totally replacing the government’s teaching grant (except for some subsidised STEM subjects). This marked a shift from cost-sharing to public-private substitution in the sense that private funding substituted for public funding rather than providing additional resources (). However, recent developments suggest that substitution might be temporary as the rising proportion of the value of loans subsidised by the government, estimated at currently 47% (DfE Citation2019) means that deferred fees are increasingly turning into deferred public funding. This led the Office of National Statistics to reclassify a proportion of loans as public spending contributing to the public deficit. This trend can be interpreted as the normal activation of planned student support mechanisms caused by the deteriorating levels of graduate income and employment (which Covid-19 might intensify) but might also be questioned as a socialisation of debt caused by a spiralling inflationary effects of marketisation. Beyond this key question of long-term sustainability and equity, the replacement of upfront public spending by deferred higher fees has contributed to reshape the behaviour of individuals and institutions (Olssen and Peters Citation2005, 324) and has affected resource differentiation. Indeed, shows that the overall rise in resources per student has not reversed unequal resource differentiation and should be seen in a context of slower enrolment. A closer look suggests that rising resources per student in post-92 and pre-92 universities outside the Russell Group was less the result of an increase in funding than a contraction of the system (). This stagnation of overall enrolment after 2008 was not the sole result of the reduction of the 18-year-old age group but also the collateral damage of the experiment in imposing a high-fee regime on HE (except in Scotland) which beyond the stagnation of full-timers provoked above all a sharp decrease in part-timers in all sectors (). This trend started with the decision in 2009 to increase tuition fees for part-time students enrolled for an equivalent or lower degree. This was aggravated by the 2012 fee rise which impacted all students but particularly part-timers (), traditionally more debt adverse and often not eligible to loans due to the nature of their course or the fact that many already had a degree (Callender and Thompson Citation2018).
Figure 8. Proportion of part-time students per type of Institution- 1959–2019. Sources: see .
However, the post-2008 legacy was not limited to the stagnation in overall enrolment (already driven by a demographic downtrend []) but also, and crucially, to the unequal absorption of that decline across the system under a new market model characterised by a progressive withdrawal of student number controls (as expansion was now funded by loans (at least in theory) rather than public spending) in which universities compete for market share. In other words, the combined impact of austerity and marketisation on enrolment was highly differentiated. The Russell Group became the new driver of expansion () benefiting from the partial removal of the cap on admissions for students with higher grades in 2013/14 (AAB) and 2014/15 (ABB) and its complete removal in 2015/16. Russell Group institutions were also favoured by other factors such as the socio-economic background of their students (less affected by fees), a weaker reliance on part-time provision () and a stronger capacity to attract postgraduate and international students ( and ). This made them better positioned than others to compensate for the loss of public funding through domestic and international fees alongside other private resources such as endowment or commercial services (b). This explains why they maintained both income and enrolment and even increased their spending per student after 2012.
By contrast, enrolment in pre-92 universities outside the Russell Group declined significantly. This cannot only be explained by the sole inclusion of new institutions in the Russell group in 2012 as the downward trend continued afterwards. More structural drivers were at work as shown by the slowdown of their full-time undergraduate entrants (), but more fundamentally by the drop in their part-time (especially in the Open University), postgraduate and international enrolments ( and ). Noteworthily, the slower enrolment in pre-92 universities outside the Russell group coincided with a stagnation of their income per student after 2015 (). This underlines a growing gap in resource differentiation between Russell Group and other pre-92 universities reflecting an unequal capacity to diversify and scale up income, only momentarily narrowed by the fee hike of 2012.
However, the post-1992 universities remained the institutions (unlike in 2006) the most affected by the 2008 crisis, with their share of enrolment dropping after 2010. The 2012 fee rise hit their full-time new entrants disproportionally suggesting that their students () demonstrated a higher propensity for debt aversion regarding loans (Callender and Mason Citation2017), further aggravated by the abolition of maintenance grants in 2017. The 2012 reform also strongly impacted part-time enrolment in post-92 universities () and to a certain extent, their postgraduate and international enrolments ( and ). This is important as post-92 universities, which have not experienced the same degree of funding diversification as other institutions, became, in a context of declining public funding, increasingly dependent on fees to up to 70% (c). This explained why the 2012 fee increase contributed to momentarily stabilise or even increase their income per student but also revealed their vulnerability in a context of stagnating enrolment (due to declining demography []) and increased competition for students. This dependence on fees combined with the limited capacity to generate other income made the likelihood of a reduction of unequal resource differentiation even more remote.
This offers a cautionary tale about the interpretation of the overall revival of spending per student after 2012 and its meaning for resource differentiation. Such revival is the result of a contraction of enrolment coinciding with stagnating resources in all sectors, except in the Russell Group which managed to increase both. Growing enrolment in elite institutions might be seen as a positive opening up of the system. However, the fact that this happens in a context of slower expansion and increased competition for resources and students suggests that the Russell Group grew at the expense of other universities ( and ). Although resource differentiation predated league tables, they further entrenched differential in resources by intensifying the link between status and wealth (a virtuous circle between reputation and the capacity to attract more students and research funding).
Those tensions explain recent attempts to revive expansion of HE or even tertiary education through revisited forms of diversification which all seemed constrained by unequal resource differentiation. Revisited Fordist forms of differentiation typical of the binary system such as HE in FE colleges or projects to (re)create Institutes of Technology resembling the polytechnics have been so far hampered by austerity. This has led to the intensification of post-Fordist forms of differentiation by creating a level playing field between public and private institutions which was a key feature of the 2017 Higher Education and Research Act. However, the decision in 2014 to restore the student cap of eligibility for loans of the private sector (only removed in 2011) shows quality and sustainability concerns (Hunt and Boliver Citation2020; Temple Citation2015).
The story of resource differentiation has many facets. Firstly, the fluctuations in income per student of the various groups of institutions have never erased the consistent gap between them across the whole period. This reflects discrepancies between their respective contribution to the expansion of the system and their wealth and reputation (). However, it is important to interpret the expenditures per student cautiously because, by definition, they compare trends in resources and enrolment (and not all resources go into teaching [Wolf and Jenkins Citation2018]) and therefore can mean different things for different groups of institutions. For instance, declining resources per student might reflect insufficient funding to sustain a steady expansion (the university sector in the 1970s, the polytechnics in the early 1980s; all sectors in the 1990s and mid-2000s). Increasing funding per student might reflect sufficient resources to sustain expansion (both sectors in the 1960s, all universities in the early 2000s; some in the Russell group since 2012) or stagnating resources of a restricted expansion (the university sector in the 1980s; most universities and outside the Russell Group since 2012). Overall, what emerges from this is the consistent underfunding of the public sector and post-92 universities (and HE in FE) over the whole period and the emergence of a new resource differentiation between pre-92 universities inside and outside the Russell Group.
Secondly, the crises of 1973 and 2008 exacerbated rather than created unequal resource differentiation. Enrolment in the public sector launched the Fordist expansion but also shielded it from the economic crisis at a heavy price, further widening the existing gap in resources per student in the 1980s as universities were restricting recruitment. This effectively ended the possibility of addressing the unequal resource differentiation within the binary system. Similarly, the newly centralised public sector kick-started the post-Fordist expansion of the late 1980s without sufficient resources, further widening the funding gap with universities. Unification was not followed by resource convergence with post-92 universities remaining relatively underfunded compared to pre-92 universities. The gap further widened after the 2008 crisis provoked a shift from cost-sharing to public/private substitution in funding which, further connecting with the removal of student number controls, ultimately transferred the driving role of expansion from post-92 to Russell Group universities without reducing their differentials in funding per student (). Meanwhile, the funding gap between Russell group and other pre-92 universities further increased.
Thirdly, the post-Fordist trend marked by a structural decline of the share of HE public funding since 1973 (b and ) was also driven by significant socio-political inflexions (1973, 1980, 1998 and 2008) which have recurrently reshaped the level and form of resource differentiation. This suggests that the concerns about the current model of expansion and resource differentiation (connected to the impact of debt [McGettigan Citation2013] on financial sustainability and participation in a context of an anticipated demographic rise after 2020 []) might crystallise into another policy inflexion. Positions have shifted with Labour’s stance to abolish fees or the recommendations from the Augar Post-18 Review, commissioned by the conservative government, to lower them to a maximum of £7.5K and to reintroduce maintenance grants (Augar Citation2019). However, it is uncertain whether these recommendations will be introduced (and this was before Covid-19 brought further uncertainty). In any case, the story of resource differentiation suggests that a policy seeking to reduce or abolish fees must be articulated to higher public funding in order to reverse public-private substitution and ensure a sustainable expansion which does not aggravate unequal resource differentiation.
Mission differentiation: division of labour or convergence and the quest for horizontality
The following explores the connections and tensions between resource differentiation and processes of mission differentiation/convergence. This questions the extent to which the distribution of resources might have driven or constrained the horizontal division of labour of the binary system and the vertical hierarchy of the unified system.
The binary system and the contested (horizontal) Fordist division of labour: vocational HE or academic drift? (1959–1973)
The evolution of the structures of enrolment and qualification awarded (used as proxy for missions and activities) of each sector reflects both the strength and the erosion of the division of labour within the binary system over this period. Before going further, it is worth being cautious about the use of proxies, especially regarding the academic/vocational dimensions. Firstly, vocational education is difficult to define (Bathmaker Citation2017) and its translation into the HE world involves various forms and levels ranging from a broad association with an occupation to a specific link to jobs and career skills. Secondly, although the academic/vocational divide broadly matches the degree/sub-degree divide because most sub-degrees were vocational, it neither fully reflected the binary divide. This is because universities have trained doctors, lawyers and clergymen since Medieval times and many others, such as the civic universities, had since developed largely from vocational and academic programmes (Carpentier Citation2019). By contrast, short vocational courses associated to mass HE were traditionally located in the non-university sector. Those caveats confirm the importance of not reducing the creation of the binary system to the sole motive of developing a vocational HE sector. Other rationales must be considered such as the expansion of a public sector more politically responsive than the autonomous universities and the development of a widening participation sector. These complementary rationales mirror the interconnections between the three stories of differentiation and should be kept in mind when exploring the data.
The structure of enrolment and qualifications awarded in the mid-1960s reflects a division of labour within the early UK binary system. The academic and research focus of the university sector is reflected by its high proportions of full-time and postgraduate students (respectively 90% and 9%) ( and ) and a dominance of academic subjects (b) and qualifications awarded at Bachelor (77%) and postgraduate levels (15%) compared to sub-bachelor level (8%) (a). This contrasts with the vocational orientation of the public sector illustrated by a far higher proportion of qualifications awarded at the sub-Bachelor level (80%) compared to bachelor (16%) and postgraduate levels (5%) (b). b shows the dominance of subjects such as engineering and education. Moreover, 40% of students in the public sector were enrolled part-time and less than 5% in postgraduate courses ( and ). shows that using the proportion of part-timers as a proxy actually underestimates the vocational focus of the public sector where half of full-time students were in teacher training colleges before they became colleges of education (a third of students of the public sector) and eventually integrated in polytechnics after teaching became a graduate profession following the 1972 James Report (Robinson Citation2014).
Figure 9. Distribution of enrolment in the non-university sector UK- 1959–1994. Sources: DESa (Citation1961–1982); DESb (Citation1983); DESc (Citation1984–90);DESd (Citation1988–93).
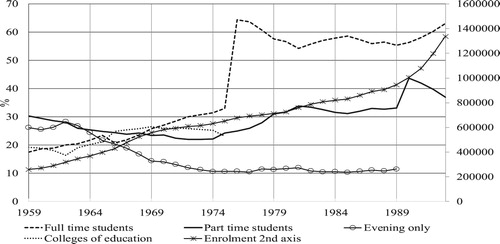
The data reveals a change in the mid-1960s. Although still significant, this institutional division of labour between academic and vocational HE within the binary system became increasingly less clear-cut. This was because the public sector complemented its key role of driver of the Fordist vocational agenda with an academic mission drift by the polytechnics seeking to imitate universities (Pratt and Burgess Citation1974). The clearer sign of this drift was the significant growth in the number of Bachelor qualifications awarded by the public sector to the point of matching the (stagnating) number of sub-bachelor qualifications in 1974. Other signs included the rising number of postgraduate students ( and b), the shifting share of enrolment away from vocational subjects such as engineering and education towards social science (b). The academic drift was also evidenced by a declining proportion of part-timers (from 62% in 1959 to 45% in 1974 []) driven as much by the slowdown in the numbers of part-time and evening students as the rise in the number of full-time students (). This isomorphic move from polytechnics to extend their role beyond the sole provision of vocational HE of the binary system were encouraged by funding mechanisms such as the further advanced education pool which ‘gave the polytechnics and colleges a strong incentive to recruit full-time honours degree students rather those who wanted to study part-time or to take non-degree courses’ (Williams Citation1988, 64).
Figure 10. Number of postgraduate students per type of Institution- 1921–2019. Sources: Carpentier (Citation2004); DESa (Citation1961–1982); DESb (Citation1983); DESc (Citation1984–90); DESd (Citation1988–93); HESAb (Citation1995–current).
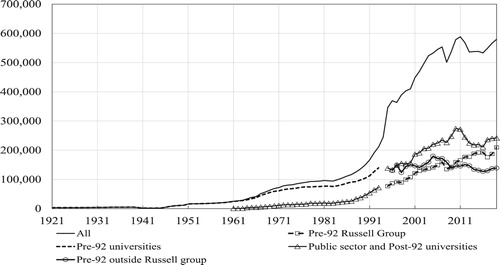
Figure 11. HE qualifications obtained by type of Institution. UK- 1921–2018. Sources: Carpentier (Citation2004); GCS (Citation1967–1998); HESAb (Citation1995–current).
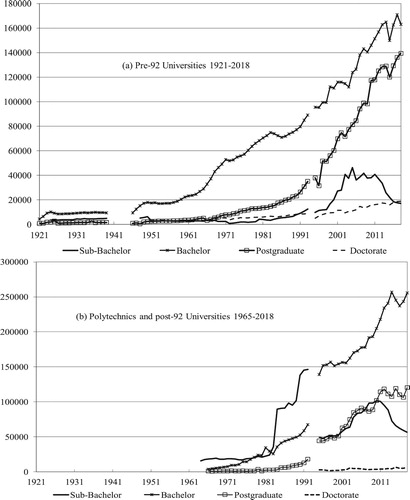
Figure 12. Enrolment (full-time UG and PG) distributed by subjects in the HE public sector (1966–1992) and the university sector (1966–2019). Sources: DESa (Citation1961–1982); DESb (Citation1983); DESc (Citation1984–90);DESd (Citation1988–93); UGCa (Citation1920–1965); UGCb (Citation1966–1979); UGCc (Citation1980–1988); UFC (Citation1989–1994); HESAb (Citation1995–current).
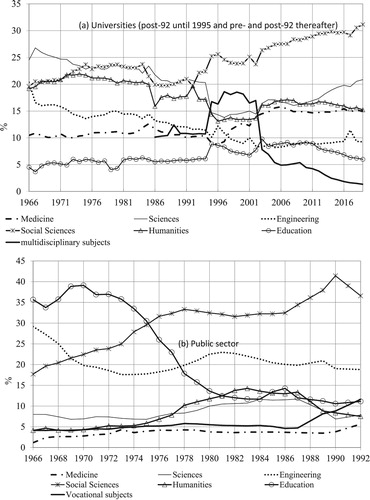
By contrast, the university sector kept its academic focus with a persistent dominance of Bachelor qualifications (from 77% to 78% from 1966 to 1973) and academic subjects (a), an increase in postgraduate qualifications (from 15% to 20%) and a substantial drop in sub-bachelor qualifications (from 8% to 2%) (a). Signs of retreating vocationalisation of the university sector are also marked by a decreasing share of enrolment of students in engineering (a) and a resilience of part-time provision mainly sustained by the Open University.
Thus, the expansion of the binary system until the mid-1970s is increasingly driven by full-time provision in the public sector () reflecting its emerging academic ambition alongside its traditional vocational mission. However, stagnating resources per student in the public sector questioned its capacity to sustain both missions jointly. By contrast, the university sector is characterised by the resilience of its academic and high-status professional education and the retreat of sub-bachelor vocational HE (a) underlining a refocus on its traditional missions with implications for social differentiation (see next section).
The combined persistent division of labour and mission drift illustrate the complementary and sometimes competing motives behind the development of the binary system. This questions whether sufficient (and less unequal) funding and a cultural change might have led to develop simultaneously an alternative vocational HE (Bailey and Unwin Citation2014) as part of an academic/vocational interface facilitated by (and facilitating) transfers within the public sector and towards the university sector. Achieving such a goal will look even more remote after the crisis of the Fordist economy.
The economic crisis and redifferentiation: the reversion to original missions (1973–1988)
The 1973 crisis has inflected the mission differentiation of the binary system with notable distinctions between the 1970s and 1980s. The attempts during the fiscal crisis to restore political and funding control by scaling back what some considered as a costly academic mission drift of the public sector were mildly successful and short-lived. Indeed, b shows the revivals of Bachelor and postgraduate qualifications awarded respectively in the early and mid-1980s. This suggests that initiatives interpreted as controlling the growth of advanced courses (such as the capping of the advanced FE financial pool or the creation in 1981 of the National Advisory Body whose ‘principal function of advising on the allocation of the advanced further education’ [Williams Citation1988, 64]) paused rather than reversed the academic drift. By contrast, a clearer consequence of the crisis on the public sector was a refocus on its original vocational mission to address rising levels of unemployment. This is evidenced by its rising enrolment in part-time mode in the 1970s and the massive expansion of its sub-bachelor qualifications (Higher National Certificates and Diplomas HNC/HND) and vocational subjects in the 1980s (, b and b). Thus, overall, the public sector emerged from the crisis with a resilient academic dimension and a revived vocational dimension. However, shows that this maintained diversification of mission was not matched by resources.
Meanwhile, the university sector only slowly increased its existing sub-bachelor qualifications while experiencing a sharp increase in its Bachelor and (especially) postgraduate qualifications (a) and multidisciplinary subjects (a). Those trends as well as the rising share of research funding (b) suggest that the Fordist crisis was the turning point when universities significantly strengthened their original academic missions and became overwhelmingly postgraduate, research orientated and also international. The crisis also coincided with a twofold increase in the numbers of international students from 1973 to 1979 in both sectors (led by the university sector), contrasting with the stagnation in the number of domestic students (). This shift from the traditionally inward-looking Fordist expansion might be explained by various social, political and economic factors including the search for income generation in a context of declining public funding (b). The growth of international students plateaued in the 1980s. Although the introduction of full-cost fees for non-EU international students in 1981 only temporarily affected their numbers, it durably changed their destinations with the university sector dominating internationalisation.
Figure 13. Proportion of international students in each type of institution, UK, 1921–2019 (Only Full-time until 1981). Sources: DESa (Citation1961–1982); DESb (Citation1983); DESc (Citation1984–90);DESd (Citation1988–93); UGCa (Citation1920–1965); UGCb (Citation1966–1979); UGCc (Citation1980–1988); UFC (Citation1989–1994); HESAb (Citation1995–current).
The crisis of the Fordist economy did not only (alongside other factors) contribute to slowdown the first expansion of HE but also inflected its mission differentiation. Both sectors reinforced their traditional missions without abandoning their new ones. The crisis at first restored a division of labour with the public sector reviving vocationalisation while pausing its academic drift. The sector rebalanced the two missions in the 1980s which in an austerity context further increased resource differentiation () as the university sector was refocusing its activities towards a more lucrative traditional research mission, postgraduate education and internationalisation.
The Post-Fordist expansion: mission convergence towards a lifelong learning system (1988–2006)
The beginning of the second phase of expansion reflects a genuine mission convergence driven by the progression of all forms of enrolments in both sectors. The first driver of expansion and convergence was the increase in full-time undergraduate and postgraduate students and qualifications awarded at both Bachelor and postgraduate levels in the public sector (, and b). This illustrates a second academic drift of the polytechnics freshly autonomous from local government control after 1988 which, by contrast with the first drift, coincided with substantial increases in part-time enrolment and sub-bachelor qualifications. This suggests that this academic drift did not substitute for vocational HE (b) but strengthened the mission diversification of the public sector. This confirms Pratt’s idea that polytechnics were seen as sufficiently alike to universities to be unified (Citation1997). After unification, post-92 universities continued to diversify by substantially increasing their full-time and postgraduate provisions ( and ) and their sub-bachelor qualifications (b). By contrast, HE provision which remained in the public FE colleges remained highly vocational with 70% of part-timers (). Another key driver of expansion was the dramatic increase in part-time provision (in vocational and postgraduate studies) and sub-bachelor qualifications offered by pre-92 universities after unification ( and a), reflecting what Watson considered as a reverse academic drift (Citation2015). Overall, unification has changed the disciplinary dynamics of expansion with the key role of social science (rising from 20% to 30% of enrolment in pre 92-universities from 1992 to 2001) and a decline in engineering (dropping from 20% to 9% in post-92 universities) (HESAb Citation1995–current).
Thus, unification led to mission convergence rather than only unilateral transformations of the public sector as in the past. Post-and pre-92 universities increasingly influenced each other by both broadening their missions. This confirms Pratt’s claim that ‘it was less that the polytechnics became universities than that the universities had become polytechnics’ (1999, 261) although part-timers in pre-92 universities were overrepresented in the Open University and underrepresented in the Russell Group (). Ultimately, mission convergence explains the rise in the overall proportion of part-timers up from 30% to 42% and sub-bachelor qualifications awarded from 15% to 20% (driven by HND, HNC and the new Foundation degree (a flagship of new labour policy) as a well as other professional qualifications) from 1998 to 2006. This contributed to create a more vocational, lifelong learning-orientated system, so far unaffected by cost-sharing as the 1998 fee rise included a discretionary fee waiver for part-time students. Convergence through increased vocationalisation was driven by the certification of key professions such as health workers, nurses and teachers (mainly associated with the public sector during the first expansion and with the whole system during the second one after nursing became an all-graduate profession). The rising number and proportion of international students across the whole system was another sign of convergence although this remained stratified with lower proportions in post-92 universities compared to pre-92 universities and especially the Russell Group ().
A key question is whether mission convergence since 1988 was matched by resource convergence. a showed that unification coincided with a rising share of non-public income of the post-92 universities (compared to when they were polytechnics). Nevertheless, they remained much more reliant on (declining) public funding than pre-92 universities due to a lower propensity to raise income from fees (especially international), research, endowment and commercial activities. Thus, the idea that awarding the university title might drive a fair mission convergence regarding teaching and research contrasted with persistent variations in funding and status magnified by the league tables. For instance, the successive research assessment exercises distributing QR research across the sector have not rebalanced the allocation of public research funding between universities (McNay Citation2016) and the proportion of income from research contracts ranges from 10% in post-92 universities to 25% in the Russell Group (). Overall, the idea of the post-Fordist unified model ‘ensuring diversity within commonality’ (Taylor Citation2003, 290) was constrained in practice by a persistent dynamics of unequal resource differentiation () reinforcing the enduring ‘pyramid of prestige’ (Palfreyman and Tapper Citation2014, 29).
Post-Fordist crisis, second marketisation and the increasingly unequal vertical differentiation: towards mission redifferentiation (2006–?)
The data suggest that the combination of austerity and increased marketisation which followed the 2008 Great Recession culminated in a retreat from mission convergence reversing the trends towards a lifelong learning system. This is illustrated by the collapse of the numbers and proportions of part-timers (from 42% in 2006 to 23% today) and sub-bachelor qualifications awarded (from 19% in 2005 to 9% today). These trends are linked as many students enrolled in Foundation Degree, HND and HNC were part-timers (a and b). Importantly, these declining numbers and ratios coincided with a stagnation of the number of full-time and postgraduate students and a slow progression of post-bachelor qualifications. There were therefore not the result of an academic drift (as in the 1960s or late 1980s) but rather the consequence of a perfect storm of policies including the new high fee regime which particularly affected part-time and sub-bachelor provisions (see previous section).
This reversal of the dynamics of vocationalisation which affected all groups of institutions with different intensity was arguably not the objective of the reforms although it reflected a lack of consideration in its design of some forms of enrolment related to vocational HE with more serious consequences for some institutions and potentially for some underrepresented groups (see next section). and show that although the decline of part-time enrolment impacted the whole sector (except in FE colleges), much of what remains of part-time provision in the HE sector today (back to its 1980s level) has retreated to where it originally started in post-92 universities and the (pre-92) Open University (even if both have also been affected, the latter particularly hard [Callender and Thompson Citation2018]). Similarly, the falling numbers and proportions of sub-bachelor qualifications awarded is more pronounced in pre-92 (from 14% to 5%) than in post-92 universities (from 24% to 13%). This can be explained by a variety of factors. Firstly, the value placed on degrees as against sub-degrees reflects broader societal/economic attitudes. Moreover, the development of more accessible degree courses (via BTEC or access courses) after the 2004 Act has also shifted demand away from sub-degrees (many HNDs) first used as platforms towards degree courses. This decline was accelerated by the exclusion of part-time students from the 2006 new (fees/loans) funding system, the adoption of student number controls in 2009 and the impact of the fee rise in 2012 on part-timers. Professional certificates also significantly declined after 2004. The Foundation degrees remained resilient until being subjected to diminishing political and funding support after 2010. Both on the supply and demand side, student loan incentivised the provision and take-up of full-time degree courses compared to part-time, modularised, vocational study.
Those trends raise concerns about the future of lifelong learning. This seems to have been acknowledged by new developments such as degree apprenticeships (limited numbers but growing) and the Post-18 Review’s recommendation (not yet implemented) to reform part-time student finance including lifelong learning loans and maintenance grants and support for sub-degree studies in HE and FE colleges (Augar Citation2019).
Retreating mission convergence is also confirmed by the sharp increase in the numbers and proportions of postgraduate qualifications in pre-92 universities and its stagnation in post-92 universities (a and b) as well as the increasingly differentiated trajectories of internationalisation. Stricter immigration policies since 2010 (including limitations to post-study work [recently revised] and a point-based system requiring minimum financial means) have led to declining numbers of international students across the system except within the Russell Group (). Those trends combined with higher international fees (and diminishing scholarships) raise questions about the social composition of international students in the overall system and its various groups of institutions with implications for resource differentiation and global social justice. The impact of those tensions between the rationales behind internationalisation differs according to the various positions of institutions and their dependence on or vulnerability to the global space. This issue is increasingly important in a post-2008 world marked by a crisis of globalisation, the implementation of Brexit and the rise of global environmental and health challenges such as Covid-19.
The effect of the post-2008 austerity on declining public funding made (both international and domestic) fees more crucial for all institutions. Could this rebalancing of funding be an opportunity to drive mission convergence by revaluing teaching alongside research or even developing the teaching/research nexus? The Teaching Excellence Framework (TEF) created in 2017 to assess ‘teaching quality’ was presented as a way to revalue teaching across the sector and reward teaching institutions through its impact on fees and profile. However, the TEF’s methodology has been criticised for using proxies (including employability) reflecting as much status as teaching quality (Ashwin Citation2020) questioning their potential to reduce the reputational effect which partly explains elite institutions’ attractiveness not only to undergraduate, but also to postgraduate (domestic and international) students. This, combined with the persistent variations in the institutions’ capacity to attract not only public QR research funding from the REF (which is not solely a cause of differentiation but a consequence of it) but also other public and private research funding (b and c) made it difficult to remove the sharp division between teaching and research universities.
The story of mission differentiation reveals a tendency towards drifts or convergence (during both phases of expansion), constantly challenged by unequal resource differentiation and eventually reversed by economic crises. The cultural prejudice towards vocational HE and unequal resources challenged the public sector’s role in the horizontal mission differentiation while also making it difficult to develop its academic mission. Those tensions intensified after the 1973 crisis which revived redifferentiation. Convergence under the unified system was led by academic drifts from post-92 universities and vocational drifts from pre-92 universities (responding to pressure on employability generated by higher fees as well as some professions becoming degree level). These drifts meant that mission differentiation was increasingly operated within each institution rather than divided by institutional sub-sectors. They were in tension with the inequalities in funding and status exacerbated by league tables and metrics which favoured the research mission of traditional universities over teaching or established a problematic association between institutional prestige and education quality (Ashwin Citation2020). The 2008 crisis stretched further the tensions between mission convergence and unequal resource differentiation leading to mission redifferentiation and a challenge to the lifelong learning model. Those tensions between resource and mission questions the democratisation of knowledge. Does mission differentiation/convergence between institutions reflect or drive the social compositions of their student body?
Social differentiation: inclusion or diversion?
Social differentiation focuses here on gender, socio-economic categories and ethnicity while recognising other types of underrepresentation and intersectional effects (Burke Citation2012; Morley and Lugg Citation2009). The historical lens shows that both phases of expansion can, to a large extent, be explained by the drive towards gender parity, alongside the inclusion of underrepresented socio-economic and ethnic groups. However, this democratisation masks persistent inequalities including a highly stratified social differentiation.
The Fordist binary system and the tension between massification and democratisation (1959–1988)
and point to the rise in women’s participation (from 25% to 40% from 1959 to 1974) as the main driver of the Fordist expansion. They also signal that this was highly differentiated with a key role played by the public sector, where the proportion of women students was 10 points higher than in the university sector.
Figure 14. Gender Participation per type of Institutions 1959–2019. Sources: DESa (Citation1961–1982); DESb (Citation1983); DESc (Citation1984–90); DESd (Citation1988–93); UGCa (Citation1920–1965); UGCb (Citation1966–1979); UGCc (Citation1980–1988); UFC (Citation1989–1994); HESAb (Citation1995–current).
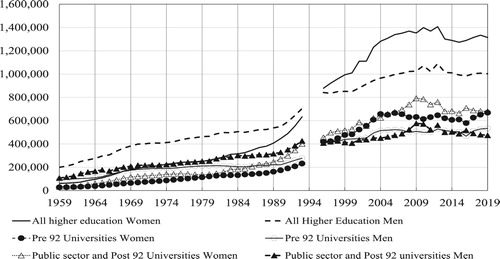
Figure 15. Gender participation per type of Institutions UK 1959–2019. Sources: DESa (Citation1961–1982); DESb (Citation1983); DESc (Citation1984–90); DESd (Citation1988–93); UGCa (Citation1920–1965); UGCb (Citation1966–1979); UGCc (Citation1980–1988); UFC (Citation1989–1994); HESAb (Citation1995–current).
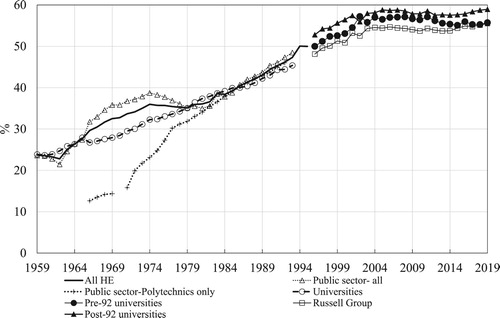
The regular but slow progression of women’s participation in university during this period contrasts with the steady and continuous feminisation of the HE public sector. However, women’s participation in the public sector was also highly differentiated as shown by their overrepresentation in full-time mode in colleges of education and their underrepresentation (although progressing) in other modes of enrolment associated with male orientated work typical of the gendered segmentation of the Fordist labour market (Arestis and Palignis Citation1995) ( and ). This explains the lower women participation in polytechnics which only increased significantly in the early 1970s driven by social changes in careers and the opening up of new subjects and degree courses in social science associated with the academic drift (b) and the professionalisation of female dominated areas of work. Thus, driven by cultural, social and economic changes, the institutional differentiation of the Fordist expansion combined a process of inclusion of women in HE with a process of diversion (Dyhouse Citation2006).
Another key driver of the expansion is the inclusion of underrepresented socio-economic groups. and point to a highly stratified democratisation closely connected to institutional differentiation. Those data were extracted by Egerton and Halsey (Citation1993, 186) from the General Household Survey comparing the education attainment and types of institution attended by the cohorts disaggregated by socio-economic categories (Service, intermediate and manual categories from the occupational classification of the Office of National Statistics are used as a proxy for ‘high-income’ ‘middle-income’ and ‘low- income’) born in the mid-1930s, 1940s and 1950s which would then enter HE during the 1960s, 1970s and 1980s respectively.
Figure 16. Proportions of women students in the public sector UK- 1959–1994. Sources: See Figure .
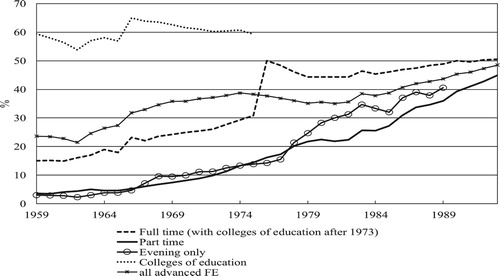
Table 1. Odds ratio Index of representation of social groups in education attainment.
reveals that institutional differentiation reflects social distinction. The high-income group is overrepresented in all forms of HE and FE attainment, especially in university. The middle-income group is well represented in polytechnics and colleges. The low-income group is overrepresented in attainment below FE and comparatively less underrepresented in colleges than in university or polytechnics. Stratified democratisation remains with the university firmly being a high-income group institution and the polytechnics a middle-income group institution, increasingly sought by the high-income group. Only college attainment is equally divided by groups while attainment below FE remains most associated with the low-income group.
The idea that differentiation led to both inclusion and diversion is reinforced by significant and persistent inequalities in the odds of educational attainment by socio-economic categories (). The odds of the high-income group attaining a university or a polytechnic education compared to the other groups have slightly decreased but are still very high at 4.25 and 2.30 compared to those of the middle-income group (0.98 and 1.19). The odds of the low-income group attaining HE are much lower and stagnating for university (0.18) and declining for polytechnics (0.35). By contrast their odds of attaining college education increased but remains low (from 0.3 to 0.53) while the odds of no FE attainment are high and increasing (1.43).
These signs of stratified democratisation underline the persistent elitist position of the universities while also revealing the mixed success of the binary system. Polytechnics and colleges respectively emancipated middle-income and low-income groups with more progressive practices of admissions (although it is unclear whether this limited their odds of respectively accessing polytechnics and universities). Moreover, the rising odds of the high-income group to attain polytechnic education questions whether, as suggested by Ross (Citation2003, 51) the academic drift turned into social drift (Citation2003, 51). Those tensions between mission and social differentiations are illustrated by polytechnics continuing to admit students with vocational qualifications traditionally awarded to underrepresented groups (Pratt Citation1997, 85), while increasingly adopting academic admission requirements similar to universities (Brennan and Williams Citation2008, 233). However, as polytechnics were quite different, it is difficult to assess the strength and spread of this social drift. The fact that colleges continued to lead inclusion ahead of the Polytechnics (where the high-income group maintained its advantage [Egerton and Halsey 1993]) points to an entrenchment of the traditional forms of stratification.
Similarly, the scarce data available at the time shows that the overall increase in participation rates of minority ethnics was also institutionally stratified. For instance, Pratt shows that the proportion of students from minority ethnics was higher in polytechnics (15%) than in universities (8%) in 1990 (Citation1997, 66). Modood cites the example of 5 polytechnics with 40% or more of admission being minority ethnics (Citation1993, 180).
The 1970s Fordist crisis impacted social differentiation in different ways. It first led to a momentary setback in the drive towards gender parity closely linked to institutional differentiation as shown by declining number and proportion of women in the public sector especially in full-time mode ( and ), connected to funding crisis often of colleges of education (Ross Citation2003, 55) and a slower academic drift from which women had previously benefited. As a result, the 1980s represents the only period with a higher proportion of women in universities than in the public sector (). The impact of the crisis on institutional stratification by socio-economic groups was less straightforward. The welcome increase in the odds of the low-income group to attain college education during the 1970s contrasted with higher odds of no FE attainment at all and slightly lower odds to graduate from polytechnics and universities.
Figure 17. Distribution of education attainment by socioeconomic categories by cohorts.
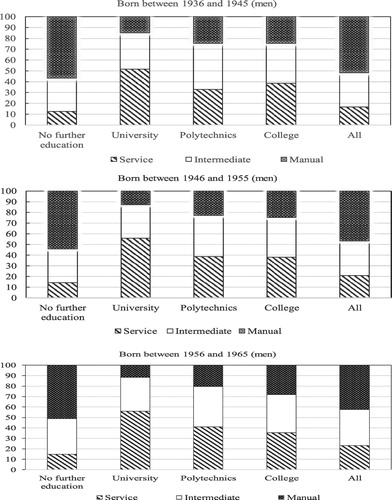
This dynamics of inclusion and diversion is complex and related to mission differentiation. This is well summarised by Scott arguing that
it can be supposed but never proved that the “binary” expansion of HE opportunities in the 1960s and 1970s, by protecting with some success part-time and sub-degree courses and the more populist traditions of FE, did more for social justice that the Robbins expansion … might have done. (Citation1984, 186)
The post-Fordist unified system and the persistent stratified democratisation (1988–?)
The second phase of expansion was also driven by an increased feminisation, and still stratified, led by the (newly centralised) public sector. Gender parity was nearly reached before the two sectors merged in 1992 (). Moreover, gender stratification survived unification with women’s participation consistently higher in post-92 than in pre-92 universities, especially those from the Russell Group. Neither the fee hikes of 1998 nor 2006 had a significant effect on gender distribution. By contrast, the post-2008 reform coincided with the stagnation of the overall gender ratio at 55% (). However. this stagnation affected the various sectors differently (with a notably strong impact on post-92 universities and the Open University) suggesting that it was less the result of a plateau of women’s participation than the impact of the post-2008 funding policy on debt to which young women and part-time students (of which 60% of are women) are more averse (Callender and Thompson Citation2018).
This second expansion is also characterised by a stratified integration of underrepresented social groups. shows a significant inclusion of (young full-time) students from routine and manual occupations in both sectors from 1988 to 1992, although polytechnics remained at the forefront, 10 percentage points above universities. Stratified democratisation continued after unification with the gap between post-92 and pre-92 universities stabilised at 10 percentage points until the marketisation phase coincided with an increase of the gap from 15 to nearly 20 percentage points. The gap is wider with Russell group universities than with other pre-92 universities revealing a new social divide between the two. This confirms a real but deeply institutionally stratified inclusion of the traditionally underrepresented groups () driven by widening participation programme and new short vocational routes such as the Foundation Degree since the 2000s (b). This explains the much higher proportion of students from disadvantaged background in post-92 universities compared to pre-92 universities (except for the Open University) with the Russell Group lagging ().
Figure 18. Percentages of Young full-time undergraduate entrants from National Statistics Socio-economic classes 4, 5, 6 and 7 by type of Institutions, 2003–2015. Sources: Pratt (Citation1997, 79); Ross (Citation2003, 72); HESAd (Citation2003–current).
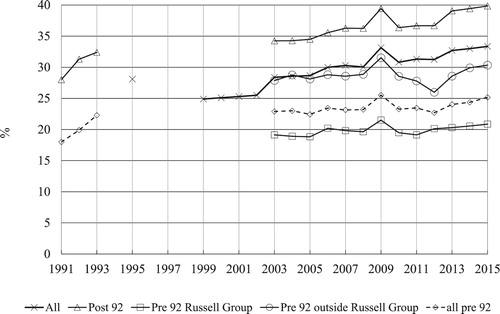
Figure 19. Percentages of young full-time first degree entrants from low participation neighbourhoods (POLAR) by type of Institutions, 2007–2019. Sources: HESAd (Citation2003–current).
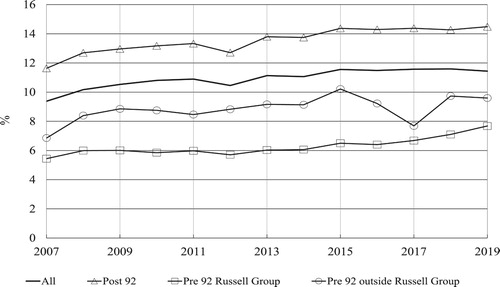
The strong link between social stratification and institutional differentiation starts at schools with the dual academic/vocational track and the differences in exams’ results between schools reflecting social inequalities which are extended to HE (Ball Citation2017; Reay, David, and Ball Citation2005). The proportion of students with 3 or more A* or A required by elite universities is 27.5% in private schools against 20.3% and 10.5% in selective and non-selective State schools respectively (DFE Citation2020). shows that the population privately educated (7% of the total population [Green, Henseke, and Vignoles Citation2017, 8]) represents 10% of enrolment of pre-92 universities and 22% of the Russell Group underlining their crucial role in reproducing elites (Boliver Citation2015; Wakeling and Savage Citation2015).
Figure 20. Percentages of young full-time first degree entrants from private schools, 2003–2019. Sources: HESAd (Citation2003–current).
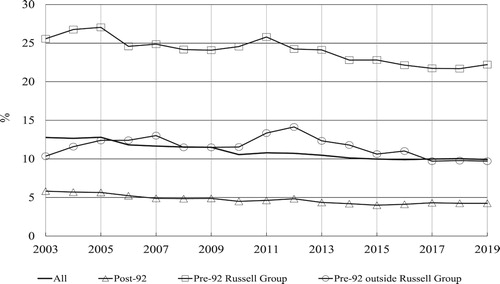
Thus, thewidening participation programmes such as Aim Higher (2004–2011) and compulsory access agreements after the 2006 fee rise as well as the successive funding models adopted since have neither reduced the overall participation gap between socio-economic categories nor altered the social division between recruiting post-92 universities and selecting pre-92 universities (especially those from the Russell group) ( and ). Overall, post-92 universities maintained their role in widening participation although FE institutions remained key drivers (Avis and Orr Citation2016) with a proportion of HE students from disadvantaged background of 20.1% compared to 11% in HE institutions in 2013 (HEFCE Citation2016) which reflects their traditional mission of inclusion and the differential of recognition of vocational qualifications as a route to HE institutions (Rogers and Spours Citation2020). Some of those issues have started to be slowly acknowledged as shown by the increased recognition of vocational BTEC by some elite universities as well as the emergence of contextualised admission (Boliver, Gorard, and Siddiqui Citation2021).
Data on ethnicity (which one should interpret cautiously as statistical categories which are socially constructed [Gillborn, Warmington, and Demack Citation2018]) show that inclusion is also institutionally stratified. points to a lower proportion of minority ethnics (those not identified as white in official statistics) in pre-92 universities (20.4%) than in post-92 universities (24.6%). However, differentials vary across groups with for instance black students (not including those with a mixed heritage) representing 3.7% of enrolment in Russell Group, 6% in other pre-92 and 9.6% in post-92 universities. Noteworthily, the gap between institutions is wider today than in 2008 and would be wider if the most elite institutions were selected (Boliver Citation2016).
Figure 21. Percentages of the UK domiciled HE student enrolments (with known ethnicity) from minority ethnics (HESA classification) by type of Institutions, 2008–2019. Sources: HESAd (Citation2003–current).
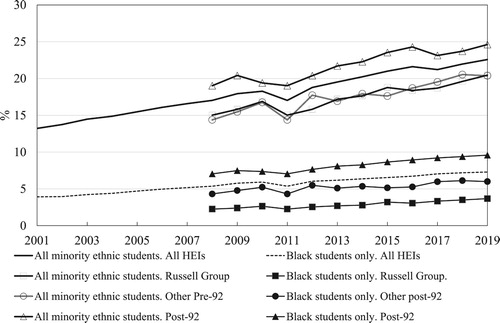
The social story of institutional differentiation combines a mix of clear and subtle signs of inclusion and diversion. Firstly, the binary system simultaneously contributed to inclusion in polytechnics and colleges (universities remaining elitist) and diversion (attainment odds of each group remaining strongly associated with a specific institution). Secondly, stratified democratisation survived unification with persistent social differentiation between post-92 and pre-92 universities especially those from the Russell Group, maintaining what Croxford and Raffe called the ‘iron law of hierarchy’ (Citation2015). Thirdly, the connections or tensions between resource and mission differentiations have in some cases influenced the extent to which institutional differentiation led to social inclusion or diversion. For instance, the acceleration of existing unequal resource differentiation, especially during both Fordist and Post-Fordist economic crises, has particularly affected the participation of traditional underrepresented groups in some institutions and particular modes of enrolment: full-timers and teacher training (particularly women) after 1973 and sub-bachelors and part-timers after 2008. Overall, while the overall progress in terms of increasing participation and even to a large extent in overall widening participation was not reversed per se, relative inequalities persisted due to a variety of factors including a maintained and perhaps intensified social stratification of widening participation by sector.
Conclusion: connecting the stories
All three stories of resources, mission and social differentiations are interconnected and influenced by the emergence and crisis of socio-economic regimes alongside demographic, cultural, political and social forces. offers a timeline synthesising the superposition of lenses, (constructed) periodisations and interpretations of the historical relationship between convergence, differentiation and social inequality.
Table 2. A timeline of the expansion and differentiation of UK HE 1959–2020.
The story of resource differentiation highlights persistent inequalities revealed by the consistent gap between the income per student of the various groups of institutions. The public sector and post-92 universities which respectively drove the expansion of the 1960s binary systems and of the 1990s unified systems ( and ) remained constantly underfunded (). Thus, unequal resource differentiation was exacerbated rather than created by retreating public funding which followed the 1970s Fordist crisis and the 2008 post-Fordist crisis ( and ). However, the acceleration of cost-sharing after 2006 and above all the shift to public-private substitution after the 2012 reform had profound consequences for increased differentiation and greater inequality within the HE system between pre-92 and post-92 universities but also between Russell Group and other pre-1992 universities.
This story of resources connects and at times (especially during economic crises) clashes with the second story of mission differentiation/convergence. The expanding binary system of the 1960s was associated with an academic drift of the polytechnics beyond their traditional provision of vocational HE. The expansion of the unified and marketised system of the 1990s was about mission convergence driven by a second academic drift of post-92 universities and a vocational drift of pre-92 universities. Those trends towards mission dedifferentiation were always challenged in practice by unequal resource differentiation (funding and prestige) and cultural prejudice towards vocational HE and teaching. Crises, by further constraining resources while increasing demands to institutions, led them to revert to their original missions. Unequal resource limited the perspective of a dynamic and fair horizontal diversity of the binary system offering an alternative vocational HE connected with academic education within the same institution or via student transfers to others including universities. Similarly, a dynamic and fair vertical differentiation between post-92, pre-92 and Russell group universities under the unified system was constrained by the disconnect between mission convergence and unequal resource.
The third story shows that institutional differentiation was initially driving social inclusion at the beginning of both phases of expansion before displaying a tendency to shift towards diversion. Unequal distribution of resources (funding and prestige) constrained the potential of both horizontal and vertical differentiations to drive social mobility. During the first expansion, polytechnics clearly emancipated underrepresented groups – although there are debates on the extent to which this closed off their options to go to universities and on whether their academic drift might have represented a threat to widening participation rather than a democratisation of knowledge. The fact that colleges remained the key driver of inclusion also points, despite progress, to a reinforcement of existing stratification of participation. Similarly, the mission convergence characterising the second expansion under the unified system did not alter the social composition of the various types of institutions (). Moreover, the transition from a managed to a market regulation (Bowl, McCaig, and Hughes Citation2018) pushed along by rankings-driven ‘consumerism’ seems to have blended well with the traditional forms of social stratification between post-92/pre-92 universities while initiating new ones between Russell group and other pre-92 universities.
Connecting the three stories of differentiation suggests that both expansions were constrained by insufficient level of funding and its increasingly unequal distribution (aggravated in 1973 and 2008) which challenged both dynamics of horizontal or vertical differentiations and produced a shift from social inclusion to diversion, contributing to what Piketty defined as a regime of inequality (Piketty Citation2020, 256).
The relationship between convergence, differentiation and social inequality points to the detrimental impact of public/private substitution in funding since 2008 on convergence and widening participation. The long-term lens underlines some continuity but also real variations between policymaking in different eras with significant effect on divergences within and between sectors (including those observed today between the post-92 universities, Russell Group and other pre-1992 universities) (). Recent HE reforms are part of a wider policy response to the 2008 crisis which is distinctive but also intensifies patterns regarding lower taxation and marketisation initiated after the 1973 crisis (). This neoliberal version of post-Fordism has left unaddressed key interconnected issues regarding inequalities, productivity, social and political turmoil and the overarching environmental question. Although history does not repeat itself, the resolution of previous crises (1830s, 1870s and 1930s) by the expansion of the social sphere suggests an alternative way to overcome the post-Fordist crisis by the emergence of a new regime of accumulation jointly driving economic development, social equality and environmental sustainability. This places a reshaped HE expansion at the interface of broader transformations of the social contract to which a realignment of, rather than a trade-off between the three types of differentiation might contribute. This realignment requires policy favouring a reversal of the public/private substitution of funding to ensure that resource differentiation reflects and drives mission differentiation or convergence rather than stratifying social inequalities.
Acknowledgments
Many thanks for their comments on earlier versions of this paper to Rachel Brooks, Claire Callender, Yann Lebeau, Roy Lowe, Tristan McCowan, Norbert Pachler and the anonymous reviewers.
Disclosure statement
No potential conflict of interest was reported by the author.
Additional information
Funding
References
- Aldrich, R. 2003. “The Three Duties of the Historian of Education.” History of Education 32 (2): 133–143.
- Altbach, P. G., L. Reisberg, and H. de Witt, eds. 2017. Responding to Massification: Differentiation in Postsecondary Education Worldwide. Dordrecht: Springer.
- Anderson, R. D. 1992. Universities and Elites in Britain Since 1800. London: Macmillan.
- Arestis, P., and E. Palignis. 1995. “Fordism, Post-Fordism and Gender.” Economie Appliquée 48 (1): 89–108.
- Ashwin, P. 2020. Transforming University Education: A Manifesto. London: Bloomsbury.
- Augar, P. 2019. Independent Panel Report to the Review of Post-18 Education and Funding. London: Department for Education.
- Avis, J., and K. Orr. 2016. “HE in FE: Vocationalism, Class and Social Justice.” Research in Post-Compulsory Education 21: 49–65.
- Bailey, B., and L. Unwin. 2014. “Continuity and Change in English Further Education: A Century of Voluntarism and Permissive Adaptability.” British Journal of Educational Studies 62 (4): 449–464.
- Ball, S. J. 2017. The Education Debate. 3rd ed. Bristol: The Policy Press.
- Barnett, R. 2017. The Ecological University. A Feasible Utopia. New York: Routledge.
- Barr, N., B. Chapman, L. Dearden, and S. Dynarski. 2019. “The US College Loans System: Lessons from Australia and England.” Economics of Education Review 71: 32–48.
- Bastedo, M. N., and P. J. Gumport. 2013. “Access to What? Mission Differentiation and Academic Stratification in US Public Higher Education.” Higher Education 46 (3): 341–359.
- Bathmaker, A. M. 2017. “Post-Secondary Education and Training, New Vocational and Hybrid Pathways and Questions of Equity, Inequality and Social Mobility: Introduction to the Special Issue.” Journal of Vocational Education and Training 69 (1): 1–9.
- Birnbaum, R. 1983. Maintaining Diversity in Higher Education. San Francisco, CA: Jossey-Bass.
- Boliver, V. 2011. “Expansion, Differentiation and the Persistence of Social Class Inequalities in British Higher Education.” Higher Education 61 (3): 229–242.
- Boliver, V. 2015. “Are There Distinctive Clusters of Higher and Lower Status Universities in the UK?” Oxford Review of Education 41 (5): 608–627.
- Boliver, V. 2016. “Exploring Ethnic Inequalities in Admission to Russell Group Universities.” Sociology 50 (2): 247–266.
- Boliver, V., S. Gorard, and N. Siddiqui. 2021. “Using Contextual Data to Widen Access to Higher Education.” Perspectives: Policy and Practice in Higher Education 25 (1): 7–13.
- Bolton, P. 2010. “Higher Education and Social Class. House of Commons.” Standard Note, SN00620, June.
- Bourdieu, P., and J. C. Passeron. 1964. Les héritiers, les étudiants et la culture. Paris: Editions de Minuit.
- Bowl, M., C. McCaig, and J. Hughes. 2018. Equality and Differentiation in Marketised Higher Education: A New Level Playing Field? London: Palgrave.
- Boyer, R., and Y. Saillard. 2002. Regulation Theory: The State of the Art. London: Routledge.
- Brennan, J., and R. Williams. 2008. “Higher Education Outside the Universities: The UK Case.” In Non-University Higher Education in Europe, edited by J. S. Taylor, J. B. Ferreira, M. Machado, and R. Santiago, 231–244. Dordrecht: Springer.
- Brown, R., and H. Carasso. 2013. Everything for Sale? The Marketisation of UK Higher Education. London and New York: Routledge.
- Burke, P. J. 2012. The Right to Higher Education: Beyond Widening Participation. Abingdon: Routledge.
- Callender, C., and G. Mason. 2017. “Does Student Loan Debt Deter Higher Education Participation? New Evidence from England.” The ANNALS of the American Academy of Political and Social Science 671 (1): 20–48.
- Callender, C., and J. Thompson. 2018. The Lost Part-Timers: The Decline of Part-Time Undergraduate Higher Education in England. London: The Sutton Trust.
- Cantwell, B., S. Marginson, and A. Smolentseva, eds. 2018. High Participation Systems of Higher Education. Oxford: Oxford University Press.
- Carpentier, V. 2012. “Public-Private Substitution in Higher Education: Has Cost-Sharing Gone Too Far?” Higher Education Quarterly 66 (4): 363–390.
- Carpentier, V. 2015. “State Education, Crisis and Austerity: An Historical Analysis Through the Lens of the Kondratiev Cycles.” In Education and the State: International Perspectives on a Changing Relationship, edited by C. Aubry, M. Geiss, V. Magyar-Haas, and J. Oelkers, 78–102. London: Routledge.
- Carpentier, V. 2018. Expansion and Differentiation in Higher Education: the historical trajectories of the UK, the USA and France. Centre for Global Higher Education, Working Paper 33.
- Carpentier, V. 2019. “Higher Education in Modern Europe.” In The Oxford Handbook of The History of Education, edited by J. L. Rury, and E. H. Tamura, 259–274. New York: Oxford University Press.
- Carpentier, V., and A. Courtois. 2020. “Public Good in French Universities: Principles and Practice of the ‘Republican’ Model.” Compare. doi:10.1080/03057925.2020.1722943.
- Carpentier, V., Y. Lebeau, and J. Välimaa. 2018. “International Perspectives on Equality of Higher Education Opportunities: Models and Strategies for Accessibility and Availability.” In Pathways to the Public Good: Access, Experiences and Outcomes of South African Undergraduate Education, edited by P. Ashwin, and J. Case, 95–111. Cape Town: African Minds.
- Clark, B. 1978. “Academic Differentiation in National Systems of Higher Education.” Comparative Education Review 22 (2): 242–258.
- Collini, S. 2012. What are Universities For? London: Penguin.
- Croxford, L., and D. Raffe. 2015. “The Iron Law of Hierarchy? Institutional Differentiation in UK Higher Education.” Studies in Higher Education 40 (9): 1625–1640.
- Dearden, L., E. Fitzsimons, and G. Wyness. 2014. “Money for Nothing: Estimating the Impact of Student Aid on Participation in Higher Education.” Economics of Education Review 43: 66–78.
- Deem, R., M. Reed, and S. Hillyard. 2007. Knowledge, Higher Education, and the New Managerialism: The Changing Management of UK Universities. Oxford: Oxford University Press.
- DfE. 2019. Student Loan Forecasts, England: 2018 to 2019. London: Department for Education.
- DfE. 2020. Revised A-Level and Other 16 to 18 Results in England. London: Department for Education.
- DiMaggio, P., and W. Powell. 1984. “The Iron Cage Revisited Institutional Isomorphism and Collective Rationality.” American Sociological Review 42: 726–768.
- Dyhouse, C. 2006. Students: a Gendered History. London: Routledge.
- Egerton, M., and Halsey A. H. 1993. “Trends in Social Class and Gender in Access to Higher Education in Britain.” Oxford Review of Education 19 (2): 183–196.
- Enders, J., and B. Jongbloed, eds. 2007. Public-Private Dynamics in Higher Education: Expectations, Developments and Outcomes. Bielefeld: Transcript Verlag.
- Esping-Andersen, G. 1990. The Three Worlds of Welfare Capitalism. Princeton, NJ: Princeton University Press.
- Farnsworth, K., and Z. Irving. 2018. “Austerity: Neoliberal Dreams Come True?” Critical Social Policy 38 (3): 461–481.
- Filippakou, O., and T. Tapper. 2019. Creating the Future? The 1960s New English Universities. Dordrecht: Springer.
- Fontvieille, L., and S. Michel. 2002. “Analysis of the Transition between two Successive Social Orders: Application to the Relation between Education and Growth.” Review 25 (1): 23–46.
- Freeman, C., and F. Louçã. 2001. As Time Goes by, from the Industrial Revolutions to the Information Revolution. Oxford: Oxford University Press.
- Gallacher, J. 2014. “Higher Education in Scotland: Differentiation and Diversion? The Impact of College-University Progression Links.” International Journal of Lifelong Education 33 (1): 96–106.
- Gillborn, D., P. Warmington, and S. Demack. 2018. “QuantCrit: Education, Policy, ‘Big Data’ and Principles for a Critical Race Theory of Statistics.” Race Ethnicity and Education 21 (2): 158–179.
- Goastellec, G. 2010. Understanding Inequalities in, Through and by Higher Education. Rotterdam: Sense Publishers.
- Godwin, C. G. 1998. “The Origin of the Binary System.” History of Education 27 (2): 171–191.
- Gramsci, A. 1971. Prison Notebooks. London: Lawrence and Wishart.
- Green, F., G. Henseke, and A. Vignoles. 2017. “Private Schooling and Labour Market Outcomes.” British Educational Research Journal 43 (1): 7–28.
- Hazelkorn, E. 2015. Rankings and the Reshaping of Higher Education. The Battle for World-Class Excellence. Basingstoke: Palgrave MacMillan.
- HEFCE. 2016. Higher Education Indicators for Further Education Colleges. Bristol: Higher Education Funding Council for England.
- Huisman, J. B., M. Seeber, N. Frølich, and L. Scordato. 2015. “Measuring Institutional Diversity Across Higher Education Systems.” Research Evaluation 24 (4): 369–379.
- Hunt, S. A., and V. Boliver. 2020. “Private Providers and Market Exit in UK Higher Education.” Higher Education. doi:10.1007/s10734-020-00546-x.
- Jessop, B. 2007. State Power, A Strategic-Relational Approach. Cambridge: Polity Press.
- Kogan, M. 1997. “Diversification in Higher Education: Differences and Commonalities.” Minerva 35: 47–62.
- Komljenovic, J., and S. L. Robertson. 2016. “The Dynamics of ‘Market-Making’ in Higher Education.” Journal of Education Policy 31 (5): 622–636.
- Labrousse, A., and S. Michel. 2017. “Accumulation Regimes.” In The Routledge Handbook of Heterodox Economics Theorizing, Analyzing, and Transforming Capitalism, edited by T.-H. Jo, L. Chester, and C. D’Ippoliti, 54–69. London: Routledge.
- Lowe, R. 1988. Education in the Post-War Years: A Social History. London: Routledge & Kegan Paul.
- Lowe, R. 1994. The Welfare State in Britain Since 1945. Houndmills: Macmillan.
- Lucas, S. R. 2001. “Effectively Maintained Inequality: Education Transitions, Track Mobility, and Social Background Effects.” American Journal of Sociology 106: 1642–1690.
- Marczewski, J. 1961. “Histoire quantitative, buts et méthodes.” Cahiers de l'Institut de Sciences Economiques Appliquées Série A.F. 15: 3–54.
- Marginson, S. 2016a. “The Worldwide Trend to High Participation Higher Education: Dynamics of Social Stratification in Inclusive Systems.” Higher Education 72: 413–434.
- Marginson, S. 2016b. The Dream is Over: The Crisis of Clark Kerr’s Californian Idea of Higher Education. Berkeley: University of California Press.
- Marginson, S., and G. Rhoades. 2002. “Beyond National States Markets and Systems of Higher Education: A Glonacal Agency Heuristic.” Higher Education 43: 281–309.
- Matterson, A. 1981. Polytechnics and Colleges. New York: Longman Inc.
- McCowan, T. 2016. “Three Dimensions of Equity of Access to Higher Education.” Compare: A Journal of Comparative and International Education 46 (4): 645–665.
- McCowan, T. 2019. Higher Education for and Beyond the Sustainable Development Goals. London: Palgrave Macmillan.
- McCulloch, G. 2011. The Struggle for the History of Education. Abingdon: Routledge.
- McGettigan, A. 2013. The Great University Gamble: Money, Markets and the Future of Higher Education. London: Pluto Press.
- McNay, I. 2016. “Imbalancing the Academy: the Impact of Research Quality Assessment.” Sociologia Italiana 8 (7): 119–150.
- Modood, T. 1993. “The Number of Ethnic Minority Students in British Higher Education: Some Grounds for Optimism.” Oxford Review of Education 19 (2): 167–182.
- Morley, L., and R. Lugg. 2009. “Mapping Meritocracy: Intersecting Gender, Poverty and Higher Educational Opportunity Structures.” Higher Education Policy 22 (1): 37–60.
- Musselin, C. 2018. “New Forms of Competition in Higher Education.” Socio-Economic Review 16 (3): 657–683.
- Naidoo, R. 2018. “The Competition Fetish in Higher Education: Shamans, Mind Snares and Consequences.” European Educational Research Journal 17 (5): 605–620.
- Neave, G. 1979. “Academic Drift: Some Views from Europe.” Studies in Higher Education 4: 143–159.
- Olssen, M., and M. A. Peters. 2005. “Neoliberalism, Higher Education and the Knowledge Economy: From the Free Market to Knowledge Capitalism.” Journal of Education Policy 20 (3): 313–345.
- Palfreyman, D., and T. Tapper. 2014. Reshaping the University: The Rise of the Regulated Market in Higher Education. Oxford: Oxford University Press.
- Parry, G. 2009. “Higher Education, Further Education and the English Experiment.” Higher Education Quarterly 63 (4): 322–342.
- Parry, G. 2015. “Access, Equity and the Participation of Disadvantaged Groups.” In Access and Expansion Post-Massification: Opportunities and Barriers to Further Growth in Higher Education Participation, edited by B. Jongbloed, and H. Vossensteyn, 13–37. New York: Routledge.
- Perez, C. 2002. Technological Revolutions and Financial Capital: The Dynamics of Bubbles and Golden Ages. Cheltenham: Edward Elgar.
- Pietsch, T. 2020. “A History of University Income in the United Kingdom and Australia, 1922–2017.” History of Education Review. doi:10.1108/HER-06-2020-0040/full/html.
- Piketty, T. 2020. Capital and Ideology. Cambridge, MA: Harvard University Press.
- Pratt, J. 1997. The Polytechnic Experiment. 1965-1992. Buckingham: Open University Press.
- Pratt, J., and T. Burgess. 1974. Polytechnics: A Report. London: Pitmans.
- Raffe, D., and L. Croxford. 2013. “How Stable is the Stratification of Higher Education in England and Scotland?” British Journal of Sociology of Education 36 (2): 313–335.
- Reay, D., M. David, and S. Ball. 2005. Degrees of Choice: Class, Race, Gender and Higher Education. Stoke-on-Trent: Trentham Books.
- Reimer, D., and M. Jacob. 2011. “Differentiation in Higher Education and its Consequences for Social Inequality: Introduction to a Special Issue.” Higher Education 61 (3): 223–227.
- Robinson, W. 2014. A Learning Profession? Teachers and Their Professional Development in England and Wales 1920–2000. Rotterdam: Sense.
- Rogers, L., and K. Spours. 2020. “The Great Stagnation of Upper Secondary Education in England: A Historical and System Perspective.” British Educational Research Journal 46 (6): 1232–1255.
- Ross, A. 2003. “Access to Higher Education: Inclusion for the Masses?.” In Higher Education and Social Class: Issues of Exclusion and Inclusion, edited by L. Archer, M. Hutchings, and A. Ross, 45–74. London: RoutledgeFalmer.
- Saez, E., and G. Zucman. 2019. The Triumph of Injustice: How the Rich Dodge Taxes and How to Make Them Pay. New York: WW Norton.
- Salter, B., and T. Tapper. 1994. The State and Higher Education. London: Woburn Press.
- Sanderson, M. 2007. “Educational and Economic History: The Good Neighbours.” History of Education 36 (4/5): 429–445.
- Scott, P. 1984. The Crisis of the University. London & Sydney: Groom Helm.
- Scott, P. 1995. The Meanings of Mass Higher Education. Buckingham: Open University Press.
- Scott, P. 2014. “Robbins, the Binary Policy and Mass Higher Education.” Higher Education Quarterly 68 (2): 147–163.
- Sharp, P. 1987. The Creation of the Local Authority Sector of Higher Education. Basingtoke: the Falmer Press.
- Shattock, M., ed. 1996. The Creation of a University System. Cambridge, MA: Blackwell Publishers Ltd.
- Shattock, M. 2012. Making Policy in British Higher Education 1945–2011. Maidenhead: Open University Press.
- Shattock, M., and A. Horvath. 2020. “The Decentralisation of the Governance of UK Higher Education: the Effects of Devolution to Scotland, Wales and Northern Ireland, and on England.” Policy Reviews in Higher Education 4 (2): 164–178.
- Shavit, Y., R. Arum, and A. Gamoran, eds. 2007. Stratification in Higher Education: A Comparative Study. Stanford, CA: Stanford University Press.
- Taylor, J. 2003. “Institutional Diversity in UK Higher Education: Policy and Outcomes Since the End of the Binary Divide.” Higher Education Quarterly 57: 266–293.
- Teichler, U. 2008. “Diversification? Trends and Explanations of the Shape and Size of Higher Education.” Higher Education 56: 349–379.
- Temple, P. 2015. “What has the Coalition Government Done for Higher Education?” London Review of Education 13: 174–178.
- Tight, M. 2015. “Theory Development and Application in Higher Education Research: The Case of Academic Drift.” Journal of Educational Administration and History 47 (1): 84–99.
- Trow, M. 1974. Problems in the Transition from Elite to Mass Higher Education. Paris: OECD.
- Unterhalter, E., and V. Carpentier, eds. 2010. Global Inequalities and Higher Education. Houndmills: Palgrave MacMillan.
- Vaira, M. 2004. “Globalization and Higher Education Organisational Change: A Framework for Analysis.” Higher Education 48: 483–510.
- Van der Zwan, N. 2014. “Making Sense of Financialization.” Socio-Economic Review 12: 99–129.
- Van Vught, F., ed. 2009. Mapping the Higher Education Landscape: Towards a European Classification of Higher Education. Dordrecht: Springer.
- Varghese, N., and V. Puttmann. 2011. Trends in Diversification of Post-Secondary Education. Paris: International Institute of Educational Planning.
- Wakeling, P., and M. Savage. 2015. “Entry to Elite Positions and the Stratification of Higher Education in Britain.” The Sociological Review 63 (2): 290–320.
- Watson, D. 2015. “The Coming of Post-Institutional Higher Education.” Oxford Review of Education 41 (5): 549–562.
- Williams, G. 1988. “The Debate about Funding Mechanisms.” Oxford Review of Education 14 (1): 59–68.
- Wolf, A., and A. Jenkins. 2018. “What’s in a Name? The Impact of Reputation and Rankings on the Teaching Income of English Universities.” Higher Education Quarterly 72: 286–303.
- Woodfield, S. 2014. “Private Higher Education in the United Kingdom: Myths and Realities.” International Higher Education 76: 11–12.
- Wyness, G., R. Murphy, and J. Scott Clayton. 2019. “The End of Free College in England: Implications for Enrolments, Equity, and Quality.” Economics of Education Review 71: 7–22.
- Statistical resources
- Public sector of HE before 1992
- DESa. 1961–1982. Statistics of Education Vol. 3: Further Education. Great Britain: Department of Education and Science. London: HMSO.
- DESb. 1983. Statistics of Further Education. England and Wales, London: Department of Education and Science.
- DESc. 1984–90. Statistics of Education: Further Education. Great Britain, London: Department of Education and Science.
- DESd. 1988–93. Statistics of Education: Further Education/Higher Education: In Polytechnics and Colleges. Great Britain, London: Department of Education and Science.
- University sector before 1992
- Carpentier, V. 2004. Historical Statistics on the Funding and Development of the UK University System, 1920–2002. UK Data Archives.
- UGCa (University Grants Committee). 1920–1965. Returns from Universities and University Colleges in Receipt of the Treasury Grants. London: Her Majesty’s Stationery Office.
- UGCb. 1966–1979. Statistics of Education, Vol. 6, University Statistics. London: Universities’ Statistical Records.
- UGCc. 1980–1988. University Statistics. London: Universities’ Statistical Records.
- UFC (University Funding Council). 1989–1994. University Statistics. London: Universities’ Statistical Records.
- HE sector after 1992
- GCS (Government Statistical Service). 1967–1998. Education Statistics for the United Kingdom. London: H.M.S.O.
- HESAa (Higher Education Statistics Agency). 1995–current. Resources for Higher Education Institutions. Cheltenham: Higher Education Statistics Agency Limited.
- HESAb. 1995–current. Students in Higher Education Institutions. Cheltenham: Higher Education Statistics Agency Limited.
- HESAc. 1995–current. Staff in Higher Education Institutions. Cheltenham: Higher Education Statistics Agency Limited.
- HESAd. 2003–current. Widening Participation: UK Performance Indicators. Cheltenham: Higher Education Statistics Agency Limited.