
ABSTRACT
Introduction: In this study we (i) introduced time-motion analysis for assessing the impact of workplace heat on the work shift time spent doing labor (WTL) of grape-picking workers, (ii) examined whether seasonal environmental differences can influence their WTL, and (iii) investigated whether their WTL can be assessed by monitoring productivity or the vineyard manager's estimate of WTL. Methods: Seven grape-picking workers were assessed during the summer and/or autumn via video throughout four work shifts. Results: Air temperature (26.8 ± 4.8°C), wet bulb globe temperature (WBGT; 25.2 ± 4.1°C), universal thermal climate index (UTCI; 35.2 ± 6.7°C), and solar radiation (719.1 ± 187.5 W/m2) were associated with changes in mean skin temperature (1.7 ± 1.8°C) (p < 0.05). Time-motion analysis showed that 12.4% (summer 15.3% vs. autumn 10.0%; p < 0.001) of total work shift time was spent on irregular breaks (WTB). There was a 0.8%, 0.8%, 0.6%, and 2.1% increase in hourly WTB for every degree Celsius increase in temperature, WBGT, UTCI, and mean skin temperature, respectively (p < 0.01). Seasonal changes in UTCI explained 64.0% of the seasonal changes in WTL (p = 0.017). Productivity explained 36.6% of the variance in WTL (p < 0.001), while the vineyard manager's WTL estimate was too optimistic (p < 0.001) and explained only 2.8% of the variance in the true WTL (p = 0.456). Conclusion: Time-motion analysis accurately assesses WTL, evaluating every second spent by each worker during every work shift. The studied grape-picking workers experienced increased workplace heat, leading to significant labor loss. Monitoring productivity or the vineyard manager's estimate of each worker's WTL did not completely reflect the true WTL in these grape-picking workers.
Introduction
Occupational heat stress is a parameter that influences several industries worldwide. In the agriculture sector, occupational heat stress is very relevant because many tasks rely on manual work as the prevailing and, sometimes, only feasible method for gentle handling of vulnerable plants. Workplace heat is difficult to mitigate in agriculture, as artificial cooling or shadowing toward the sun would be detrimental to growth or directly harmful for the plants. The global wine industry is large, comprising ∼0.2% of world gross domestic product (GDP),Citation1 and climate change has increased the areas suitable for growing vines. However, climate change may have also increased the heat exposure in the subtropical areas, where the majority of the wine is produced.Citation1 This is noteworthy, because wine production is still dominated by manual work. Some tasks (e.g., transport of the grapes) have been motorized, but the manual tasks by the grape-picking workers remain similar to those developed 5,500 y ago when the vine cultivation tradition emerged.Citation2 However, given the increase in environmental temperature during the past five millennia in regions such as the Mediterranean,Citation3 the workers who currently pick the grapes carry out their jobs under adverse environmental conditions. In Cyprus, for instance, the mean maximum temperature in August (the main part of the harvest season) is around 36°C.Citation4 These working conditions would be considered a heat-wave in Central European countries such as Germany.Citation5
Laboratory studies have shown that the above-mentioned amount of thermal strain during grape picking can impair the human physiologic function and capacity to perform prolonged exercise and work.Citation6-Citation8 In addition, field studies in real-life occupational settings have shown that workplace heat exposure impairs productivity.Citation9-Citation13 These effects translate to significant financial implications. Specifically, the financial costs due to heat-related work absenteeism and reduced productivity in Germany during 2004 were estimated between 0.7 and 3.1 billion EUR (0.8–3.4 billion USD),Citation14 while similar calculations for Australia during 2013/2014 indicated total losses of 5.6 billion EUR (6.2 billion USD).Citation15 Therefore, it is vital to identify means that will allow employees to be more productive despite using traditional work practices in their natural habitat and – at the same time – will protect their health and safety as well as improve job satisfaction.
To date, there is very limited detailed and evidence-based knowledge on the effects of workplace heat on agriculture workers. Notably, the literature presents no relevant studies conducted in Europe. Previous studies in AmericanCitation9 and IndianCitation10 agriculture workers assessed the effects of workplace heat on productivity by recording the amount of hourly individual-harvested crops. The former study reported a non-significant trend of productivity reduction in fruit harvesters due to increasing wet bulb globe temperature (WBGT), while the latter study found that the productivity of rice harvesters was significantly decreased at WBGT above 26°C. It is important to consider, however, that productivity may not necessarily reflect the true work time spent on labor (WTL, that is, the time that a worker spends toward completing a task, not including breaks or other work-related behaviors) since it does not take into account differences in the yield of farm crops due to geological and/or environmental effects. For instance, factors such as land leveling and soil moisture can locally affect grape production by up to 50% within the same vineyard.Citation16 Thus, productivity at a certain time of the day (e.g., when heat levels are at maximum) also reflects the amount of crop that is available for picking at that time which, as mentioned above, can vary by up to 50% within the same piece of land. This, in turn, can distort the final productivity assessment of the workers, and the conclusion on the effect of workplace heat on productivity. It is important, therefore, to discriminate between productivity and labor.
Time-motion analysis combined with physiologic data can be valuable in assessing the physiologic strain of workers during periods of increased occupational heat stress.Citation17 Time-motion analysis includes analyzing movement and the time spent on each movement through video analysis. This method is very powerful, since the investigator can analyze every second spent by each worker during every work shift, thus accurately assessing WTL without bias. The primary aim of this study was to introduce time-motion analysis for assessing the impact of workplace heat on the WTL during grape-picking. The latter is a moderate-intensity work activity, which is self-paced and, hence, allows for exploring both behavioral responses and changes in work efficiency (time spent on work versus breaks). The secondary aim was to examine if seasonal differences in environmental conditions can influence the WTL of these grape-picking workers. Finally, the third aim was to investigate whether WTL of grape-picking workers can be assessed by the previously-adopted approaches of: (i) monitoring productivity, or (ii) the vineyard manager's estimate of each worker's WTL at the end of the work shift.
Materials and methods
The experimental protocol was approved by the University of Thessaly, School of Exercise Science Ethics Review Board in accordance with the Declaration of Helsinki. The study involved monitoring grape-picking workers on four separate days during the 77-day harvest of 2016 (August 16 to October 31). Specifically, the grape harvest season was divided into two similar time periods as follows: summer (38 days; August 16 to September 22) and autumn (39 days; September 23 to October 31). The 4 days that were selected for monitoring (summer: August 17–18; autumn: October 11–12) were chosen as the prevailing environmental conditions were representative for each time period. Indeed, the average daily WBGT of the two monitored summer days (24.5 ± 0.8°C) and the average daily WBGT of the entire summer period (23.8 ± 1.3°C) were similar (p > 0.05). Similarly, the average daily WBGT of the two monitored autumn days (19.8 ± 0.3°C) was similar (p > 0.05) to the average daily WBGT of the entire autumn period (19.5 ± 0.8°C). The WBGT data used for these comparisons were recorded at the Paphos International Airport, which is located approximately 7 km from the monitored vineyard, and were provided by www.wunderground.com.
Given the above-mentioned difference of 4°C WBGT between the summer and autumn periods, we calculated the minimum required sample based on the productivity of rice harvesters at WBGT of 27–28°C (76.6 ± 2.1 bundles/h) and 31–32°C (56.4 ± 2.9 bundles/h) from the aforementioned study in Indian agriculture workers.Citation10 Using these data, an effect size of 7.67 for the differences between our summer and autumn seasons was expected. Assuming an α of 0.05 and β of 0.95, three participants would provide enough power to detect a statistical difference of a similar magnitude (G*Power Version 3.1.9.2).Citation18 Based on these calculations, a total of seven healthy and heat-acclimatized (i.e., continuously living in the area for the ≥ 90 previous days and performing other agriculture jobs on a daily basis) workers with experience in grape-picking (8–16 y of work experience) volunteered and were recruited for this study. The workers worked in a new vineyard each day. For all recorded shifts during autumn, two workers (one male and one female) were unavailable to participate because they were working in a different vineyard and were replaced by the vineyard manager by one male worker. Therefore, the monitored group comprised of six workers (four males and two females) during the summer and five workers (four males and one female) during the autumn. Given this change, all season-related comparisons included data from workers who were monitored during both summer and autumn. Written informed consent was obtained from all volunteers before their participation in the study.
Two days before the start of data collection, volunteers underwent a familiarization session that included information regarding all data collection procedures. Anthropometric characteristics were also recorded at that time. Moreover, to minimize participant bias (i.e., WTL being affected because the workers were being monitored), sham measurements were performed one day before each seasonal assessment (i.e., on August 16 and October 10). The aim was for the workers to become familiar with the presence of the investigators at the workplace and the video recording. During these sham measurements, all procedures were performed in the same manner as during the actual recording days.
During each recording and sham day, the workers were monitored from the beginning (06:00 during the summer; 07:00 during the autumn) until the end of the work shift, about 8 h later. Specifically, we captured workers' movement via video and we recorded skin temperature and environmental data throughout the work shift. At the end of each work shift, we recorded the vineyard manager's estimation regarding the WTL of each worker. No restrictions were placed on water/food consumption or any other kind of work- or non-work-related behavior. To ensure that we did not influence the workers' normal work routine, the temperature sensors used were miniature, wireless, and were placed on the workers' body during the previous night. Also, to minimize participant bias (i.e., WTL being affected because the workers were being monitored), the true reason for the video recording was hidden from the volunteers. Instead, they were informed that the investigators were creating a video that would describe the process of wine making. Of course, once the data collection was completed, all volunteers were informed about the true purpose of the video recording and gave their permission to analyze and publish these data.
Anthropometric measurements included height, mass, waist-to-hip ratio, and skinfold (abdominal, triceps, thigh, suprailiac) thickness. The latter was used to calculate body fat percentage according to the Jackson and Pollock equation.Citation19 Body surface area was calculated using the Du Bois formula.Citation20 Maximal oxygen uptake was estimated using a non-exercise prediction model.Citation21
Workers' movement was recorded using a video camera (Hero 4 black, GoPro, California, USA). The video camera was positioned in close proximity to the workers (10–40 m) without interrupting their workflow. Temperature at the skin surface was recorded every second at four sites using iBUTTON sensors (type DS1921 H, Maxim/Dallas Semiconductor Corp., USA) to calculate the mean skin temperature [T sk; 0.3 (chest + arm) + 0.2 (thigh + leg)].Citation22 The difference (ΔT sk) between the baseline T sk (i.e., T sk at time 0) and the current T sk (i.e., T sk at time t) was also calculated. Environmental data including air temperature (T air), relative humidity, and wind speed were measured continuously using a portable weather station (WMR200, Oregon, USA). The weather station was positioned within the vineyard, 20–100 m away from the workers and was installed according to the manufacturer's instructions. Solar radiation (sol R) data were collected from the official website of the European Union's Joint Research Center.Citation23 The obtained environmental data were used to calculate WBGT, and the universal thermal climate index (UTCI) using the Excel Heat Stress Calculator downloaded from www.ClimateCHIP.org.Citation24 This calculator uses the recommended method of Liljegren to calculate the outdoor WBGT from meteorological data,Citation25,Citation26 as well as information from the official UTCI webpageCitation27,Citation28 to estimate the UTCI.
Time-motion analysis
The video recordings were used to identify work-related behaviors. Work time spent on irregular work breaks (WTB) was defined as any unprescribed work cessation determined by workers' own judgment, and not based on specific time intervals or instructions. Lunch time was not considered as WTB because it was prescribed by management. We also recorded the duration of uninterrupted WTL (i.e., continuous work without break) to delineate the impact of workplace heat on the frequency of breaks, which is different from the duration of WTB. It should be noted that the workers had constant access to shade either from the vine trees themselves or from other trees that, in some areas, surrounded the vineyard. Thus, the WTB was divided into two categories: the WTB during which the workers decided to rest in the shade (WTBshade) and the WTB during which the workers chose to stay under the sun (WTBsun). Based on these definitions, the following five work-related behaviors were identified in the time-motion analysis: (i) WTL, (ii) uninterrupted WTL, (iii) WTBshade, (iv) WTBsun, and (v) lunch (always taken outdoors). In addition, the video recordings were used to calculate productivity using previous methodology [i.e., the number of boxes full of grapes picked by the entire group in each hour divided by the number of workers (six workers during the summer and five workers during the autumn)].Citation10
Work-related behaviors were determined for each worker individually through time-motion analysis that was conducted off site by two trained analysts. The video recordings (60 min × 8-h work shift × 4 days = 1,920 min total recorded over the four monitored days) were analyzed within a 2-week period. To minimize the risk of errors due to fatigue, each analyst analyzed 6 h of video per day, while taking a 1-h break every 2 h of time-motion analysis. Due to the necessary pauses to record work-related behavior, the overall ratio of video recording to time-motion analyzing was 1:1.33 (i.e., for every 1 h of video recording, 80 min were required for analysis). Experimenter bias was minimized via training the analysts to rate using the same short video to ensure adequate agreement. For the same reason, the two analysts worked in the same room and they were instructed to seek each other's advice in cases where they could not make a firm decision on their own. They were, thus, encouraged to give consensus group ratings of work-related behaviors.
Data analysis
The T air, WBGT, and UTCI were grouped into 5-degree categories (< 15°C, 15–20°C, 20–25°C, 25–30°C, 30–35°C, 35–40°C, 40–45°C, and >45°C), while the ΔTsk was grouped into ten 1-degree categories (<−2°C, −2 to −1°C, −1 to 0°C, 0 to 1°C, 1 to 2°C, 2 to 3°C, 3 to 4°C, 4 to 5°C, 5 to 6°C, and >6°C). Finally, sol R was divided into groups of 200 W/m2 (0–200 W/m2, 200–400 W/m2, 400–600 W/m2, 600–800 W/m2, and >800 W/m2).
To address the primary aim of the study, Pearson's correlations were used to detect whether the hourly WTB and productivity were associated with the hourly T air, WBGT, UTCI, sol R, ΔT sk, and T sk. One-way χ2 was conducted to detect prevalence differences among the four (i.e., excluding lunch) work-related behaviors. Moreover, two-way χ2 analysis was used to detect prevalence differences of the four work-related behaviors among the afore-mentioned categories of T air, WBGT, UTCI, and sol R.
To address the secondary aim of the study, independent samples t-tests were used to assess differences in hourly T air, WBGT, UTCI, ΔT sk, T sk, and WTB between summer and autumn. A two-way χ2 was used to detect prevalence differences between the types of WTB (WTBshade and WTBsun) across the two seasons. Furthermore, two stepwise multiple linear regression analyses incorporating backward elimination at the 0.051 level were used to examine if seasonal differences in environmental conditions (T air, sol R), heat stress indices (WBGT, UTCI), T sk, and ΔT sk (all independent variables) can predict seasonal changes in WTL or WTB (dependent variables). This stepwise procedure allows for careful assessment of each independent variable through the change in the coefficient of determination (R2).
To address the third aim of the study, simultaneous linear regression analysis was used to predict WTL during the previous work hour (dependent variable) based on hourly productivity or the vineyard manager's estimate of each worker's WTL (independent variables). Finally, a paired samples t-test was used to investigate whether the vineyard manager's estimate of each worker's WTL was similar to the actual WTL (as assessed via time-motion analysis). The level of significance for all analyses was set at p < 0.05. All statistical analyses were conducted using SPSS 22.0 for Windows (IBM, Armonk, NY, USA). All results are presented as mean ± sd, unless otherwise stated.
Results
The physical characteristics of all volunteers are shown in . The slight differences between the workers monitored in the summer and in autumn resulted in no significant differences in any of the physical characteristics recorded (all p's > 0.05). There were no relationships between the physical characteristics of the workers and the hourly WTB (all p's > 0.05). During the studied work shifts, the workers harvested a total of 9,600 kg of grapes. The crop yield per m2 of land was 281 ± 4 g of grapes. Productivity (2.2 ± 1.0 boxes) fluctuated from 0.0 to 4.0 boxes of grapes (each box weighed 25 kg), depending on the type of work done at a given time.
Table 1. Physical characteristics (mean ± sd) of the studied grape-picking workers.
The T air (mean: 26.8 ± 4.8°C; range: 15.2–33.9°C), WBGT (mean: 25.2 ± 4.1°C; range: 14.0–32.8°C), UTCI (mean: 35.2 ± 6.7°C; range: 10.6–45.7°C), and sol R (mean: 719.1 ± 187.5 W/m2; range: 0–906 W/m2) fluctuated considerably throughout the study period. Large fluctuations were also observed in T sk (mean: 33.7 ± 1.6°C; range: 28.2–37.5°C) and ΔT sk (mean: 1.7 ± 1.8°C; range: −2.6 to 6.9°C). The percentage of work shift time spent in each category of environmental factors, heat stress indices, and ΔT sk is shown in . As suspected, the majority of the work shift time during the summer period was spent under conditions of high heat stress. Specifically, 56.4% of work shift time during the summer was spent at T air >30°C, 87.3% of time was spent at WBGT >25°C, 80.4% of time was spent at UTCI >35°C, and 63.5% was spent at sol R >800 W/m2. These results may explain the fact that the workers spent 57.7% of the work shift time during the summer having ΔT sk >2°C. During autumn, the environment was much more temperate. Only 1.1% of the work shift time was spent at T air >30°C, 8.2% of time was spent at WBGT >25°C, 19.2% of time was spent at UTCI >35°C, and no time was spent at sol R >800 W/m2. During both seasons, T sk (T air: r = 0.90; WBGT: r = 0.76; UTCI: r = 0.83; sol R: r = 0.81) and ΔT sk (T air: r = 0.93; WBGT: r = 0.76; UTCI: r = 0.84; sol R: r = 0.87) were positively correlated with the recorded environmental factors and heat stress indices (all p's < 0.05).
Table 2. Percentage of work shift time spent in each category of environmental factors, heat stress indices, and ΔT sk.
Analyses conducted to address the first aim of the study demonstrated that, across the entire study period, 12.4% of the total work shift time was lost on WTB (WTBsun: 8.1%; WTBshade: 4.3%). The hourly percentage of work shift time spent on WTB ranged from 0% to 76.1%. The majority of WTB was observed in the middle 4-h period of the work shift (p < 0.001; ). The mean duration of WTB [01:10 ± 05:11 (min:sec)] significantly increased, while the mean duration of uninterrupted labor [05:23 ± 09:43 (min:sec)] significantly decreased at higher levels of WBGT, UTCI, sol R, and ΔT sk (all p's <0.05; and ), suggesting that workplace heat stress leads to increased frequency and duration of work breaks. This was also confirmed via Pearson's correlation where the hourly WTB was positively associated with the recorded environmental factors and the ΔT sk (T air: r = 0.38; WBGT: r = 0.39; UTCI: r = 0.40; sol R: r = 0.32; ΔT sk: r = 0.29; all p's < 0.01). Furthermore, the total work shift time lost due to WTB was significantly increased at higher levels of T air, WBGT, UTCI, sol R, and ΔT sk (all p's < 0.01; ). Simultaneous linear regression analyses demonstrated that there is a 0.8%, 0.8%, 0.6%, and 2.1% increase in WTB for every 1°C increase in T air (R2 = 0.47; F (1,18) = 14.97, p = 0.001), WBGT (R2 = 0.37; F (1,18) = 10.01, p = 0.006), UTCI (R2 = 0.69; F (1,34) = 74.18, p < 0.001), and ΔT sk (R2 = 0.91; F (1,9) = 83.36, p < 0.001), respectively.
Figure 1. Hourly percentage (mean ± sd) of work time spent on irregular work breaks (WTB) during each hour (local Cyprus time) of the recorded work shifts. Blue bars show results from all the studied work shifts. Red and green bars show results from all the summer and autumn work shifts, respectively. Asterisks indicate significant (p < 0.05) differences from the work hour to the left. The lunch break (which is not included in the WTB) was always taken at 11:00 and lasted for 30 min.
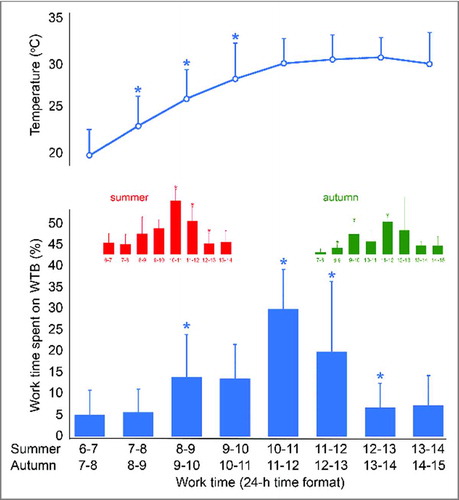
Figure 2. Mean duration of uninterrupted labor (dotted lines corresponding to the left vertical axis) and mean work time spent on irregular breaks (WTB; bars corresponding to the right vertical axis) based on the UTCI (blue color) and WBGT (green color) categories. Asterisks indicate significant (p <0.05) differences from the UTCI or WBGT category to the left. The reference values for UTCI are as follows: 9–26°C: no thermal stress; 26–32°C: moderate heat stress; 32–38°C: strong heat stress; 38–46°C: very strong heat stress; > 46°C: extreme heat stress. The reference values for WBGT are as follows: ≤ 25.6–27.7°C: no heat stress; 27.8–29.4°C: low heat stress; 29.4–31.0°C: moderate heat stress; 31.0–32.1°C: high heat stress; ≥ 32.2°C: extreme heat stress.
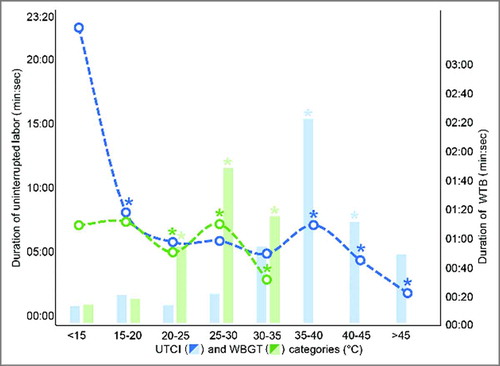
Figure 3. Mean duration of uninterrupted labor (dotted lines corresponding to the left vertical axis) and mean work time spent on irregular breaks (WTB; bars corresponding to the right vertical axis) based on the ΔT sk (beige color) and the solar radiation (red color) categories. Asterisks indicate significant (p < 0.05) differences from the ΔT sk or solar radiation category to the left. Note: ΔT sk = difference between the baseline mean skin temperature and the current mean skin temperature.
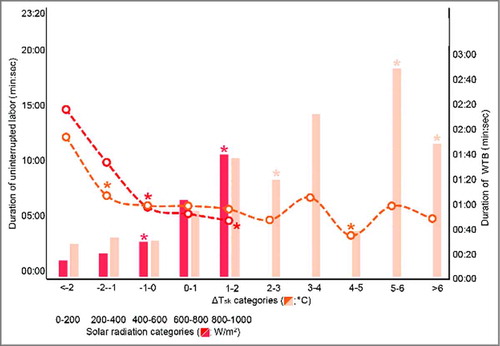
Figure 4. Loss of labor for each category of environmental factors, heat stress indices, and ΔT sk. Each full gray body figure represents one work shift lost per ten work shifts due to work time spent on irregular breaks (WTB). Note: T air = air temperature; WBGT = wet bulb globe temperature; UTCI = universal thermal climate index; sol R = solar radiation; ΔT sk = difference between the baseline mean skin temperature and the current mean skin temperature.
Analyses conducted to address the second aim confirmed the existence of significant seasonal differences in environmental conditions (). Indeed, all environmental parameters and heat stress indices were significantly increased during the summer compared with the autumn (T air: 28.9 ± 4.2°C versus 24.3 ± 4.2°C; WBGT: 27.9 ± 2.5°C versus 21.9 ± 3.0°C; UTCI: 38.8 ± 4.9°C versus 30.8 ± 5.8°C; sol R: 773.7 ± 177.0 W/m2 versus 653 ± 178.6 W/m2; all p's<0.05). It is logical to assume that these differences generated the observed significantly increased summer mean hourly T sk (34.3 ± 1.4°C versus 32.7 ± 1.5°C) and ΔT sk (2.3 ± 1.7°C versus 0.7 ± 1.4°C) compared with the autumn (all p's < 0.01; ). During the summer, 15.3% of the total work shift time was lost on WTB, while only 10% of work shift time was lost on WTB during the autumn (p = 0.004). This was despite the fact that the crop yield per m2 of land was similar in the two seasons (summer: 279 g; autumn: 285 g). The majority of WTB was observed in the middle 4-h period of the work shift during both summer (08:00–12:00) and autumn (09:00–13:00) (p > 0.05; ). Interestingly, while the majority of WTB was spent under the sun during both the summer (56.2%) and the autumn (75.3%) (both p's <0.001), the time spent in WTBshade was nearly twice as large during the summer (43.8%) compared with the autumn (24.7%) (p < 0.001). Also, we found no significant differences in productivity between the summer (2.3 ± 1.2 boxes) and the autumn (2.0 ± 0.8 boxes) (p > 0.05). Backward linear regression analysis demonstrated that seasonal changes in UTCI account for 64% of the seasonal changes in WTL [F (1,7) = 10.63, p = 0.017].
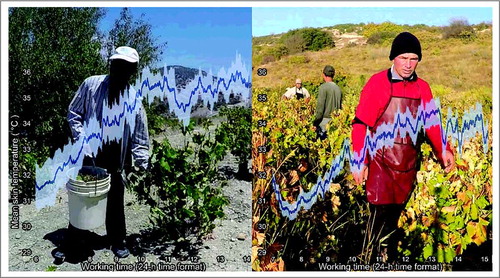
Figure 5. Fluctuation in mean skin temperature (mean ± sd) of the studied workers across the 8-h work shifts (local Cyprus time) during the summer (left pane) and the autumn (right pane) study periods. The background images illustrate the same worker picking grapes during the summer (left) and the autumn (right). Seasonal comparisons demonstrated significant differences (p < 0.05) during the majority of the work shift time.
Our analyses addressing the third aim showed no significant association between productivity and either the recorded environmental factors, or the heat stress indices, or the ΔT sk (both p's > 0.05). Productivity was positively correlated with the WTL during the previous work hour (r = 0.61, p < 0.001; ). A simultaneous linear regression analysis showed that productivity accounts for 36.6% of the variance in WTL during the previous work hour [F (1,31) = 17.34, p < 0.001]. Finally, the vineyard manager felt that the workers performed their jobs correctly, at the usual pace, and at a level that was acceptable throughout the monitored work shifts. This is indicated by his estimate for each worker's WTL which was 95.0 ± 5.1%. However, this estimate was significantly higher (p < 0.001) than the actual WTL assessed via time-motion analysis (87.4 ± 4.5%). A simultaneous linear regression analysis demonstrated that the manager's estimate of WTL predicted 2.8% of the variance in the actual WTL [between workers or between work shifts for the same worker; F (1,21) = 0.577, p = 0.456].
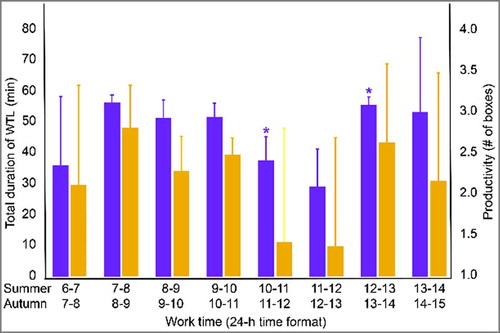
Figure 6. Fluctuation (mean ± sd) in the true work time spent on labor (WTL) during the previous hour (left vertical axis; purple bars) and the hourly productivity (right vertical axis; orange bars) of the studied workers across the 8-h work shift (local Cyprus time). Asterisks indicate significant differences (p < 0.05) from work hour to the left.
Discussion
To our knowledge, this is the first study to use time-motion analysis to discriminate between productivity and labor when assessing the impacts of workplace heat. Time-motion analysis is a qualitative method that has been used for some time for the assessment of physical performance and work intensity in elite team sports.Citation29,Citation30 In occupational settings, it is one of the recommended methods by the American Conference of Governmental Industrial Hygienists to assess hand activity level threshold limit values,Citation31 and has been adopted to determine the degree of correlation between hand activity/force ratings in various jobs.Citation32 Moreover, we recently used this technique to assess the physiologic strain of electrical utilities workers in hot regions of North America.Citation17 In the present study, we extended this approach to labor assessment, and we strengthened the methodology by applying stricter rules and minimizing participant and experimenter bias. Introducing time-motion analysis as a tool to assess the effects of workplace heat on productivity and labor effort in agriculture workers was the main aspect of this study. As such, this paper should be considered as a method developing paper rather than an exhaustive (large scale) study of agriculture workers which would require a broader study (more workers and, possibly, different locations). Though time consuming, time-motion analysis is very powerful, since the investigator can analyze every second spent by each worker during every work shift, thus accurately assessing labor and productivity without bias. This is supported by the fact that the present WTL and WTB results were sensitive enough to detect differences between workers, days, as well as seasons despite the relatively small number of workers assessed.
To the best of our knowledge, this is the first study to investigate the impact of workplace heat on a group of European agriculture workers. We chose to study grape-picking workers because wine is one of the most important European agricultural productsCitation33 and because these workers carry out manual laborCitation2 under adverse environmental conditions. Indeed, our study shows that most of the work shift time during the summer—the main part of the grape-picking period—was spent under conditions of increased heat (T air >30°C, or WBGT >25°C, or UTCI >35°C, or sol R >800 W/m2) and was accompanied by significant changes in T sk. Our study also showed that WTB comprised 12.4% of the total work time during the recorded grape-picking shifts. This loss of labor time was increased (i.e., longer and more frequent work breaks) at higher levels of WBGT, UTCI, sol R, and ΔT sk, with as much as 26.7% of the work shift time spent on breaks at the highest recorded levels of heat stress (i.e., ΔT sk of 6–7°C). Overall, we found that there is a 0.8%, 0.8%, 0.6%, and 2.1% increase in WTB for every one degree Celsius increase in T air, WBGT, UTCI, and ΔTsk, respectively. It is important to also note that, following recent suggestions,Citation34 we evaluated heat stress using several parameters and different indices to ensure a comprehensive and systematic approach.
We found significant seasonal differences in environmental conditions, heat stress indices, T sk, and ΔT sk. Importantly, we also detected notable labor differences between seasons, as more than 15% of the total work shift time was lost on WTB during the summer, while this loss was restricted to 10% during the autumn. Overall, seasonal changes in UTCI accounted for 64% of the seasonal changes in WTL. Also, we observed that the WTBshade was nearly twice as large during the summer compared with the autumn, indicating that workers were behaviorally thermoregulating. This was anticipated, given the significant changes seen in T sk, which is the main driver of behavioral thermoregulation.Citation6,Citation35 Indeed, environmental and metabolic heat gain lead to increased T sk, which augments thermal perception and/or cardiovascular strain. In turn, this leads to increased perceived exertion that, eventually, causes reductions in work rate.Citation6
Our results demonstrating that workplace heat is accompanied by significant labor loss in the studied agriculture workers are in line with previous larger occupational studies in the literature reporting similar effects on the productivity of workers in the agriculture industry.Citation9,Citation10 Agricultural workers, and especially grape-picking workers, cannot avoid workplace heat exposure. Based on our calculations, our workers performed moderate-intensity work with an average work rate of ∼330 W for men and ∼260 W for women (calculation based on known energy expenditure for “farming, fishing, and forestry”).Citation36 As such, work-rest ratios should be 3:1, 1:1, and 1:3 at WBGT ≥ 29°C, ≥ 30.5°C, and ≥ 32°C, respectively.Citation37 This would have important implications for the studied grape-picking workers who spent 35.7%, 7.9%, and 1.6% of their work time at WBGT ≥ 29°C, ≥ 30.5°C, and ≥ 32°C, respectively, but were officially not provided with any breaks other than the lunch break.
The results of the present study suggest that monitoring productivity or the vineyard manager's estimate of each worker's WTL at the end of the work shift does not completely reflect the workers' true labor effort during grape-picking. Indeed, productivity explained ∼37% of the variance in WTL during the previous work hour (or vice versa), while the vineyard manager's estimate of WTL was too optimistic and explained only ∼3% of the variance in the true WTL assessed via time-motion analysis. The differences between productivity, the manager's estimate of WTL, and the true WTL assessed via time-motion analysis may reflect the impact of geological factors that are known to influence the grape yield by up to 50%, within the same vineyard.Citation16 It is possible that these factors may be less important in other agricultural jobs such as riceCitation10 or tree fruitCitation9 harvesting. Nevertheless, we recommend that future studies should discriminate between productivity and labor, possibly by using the time-motion analysis technique used in the present study or other similar methods.
The present results would be strengthened by assessing a larger sample of workers and/or separate groups of workers in different European countries, and by recording also core temperature and heart rate. Studies in this direction should be planned in the coming years aiming to protect workers' health and to preserve their labor capacity and productivity despite the projected increased frequency of heat waves due to climate change. Moreover, it is important to note that we did not control workers' clothing to ensure that we did not influence their normal work routine and to minimize participant bias.
Based on the present results, it is concluded that time-motion analysis accurately assesses labor effort, evaluating every second spent by each worker during every work shift. Moreover, the studied grape-picking workers experienced high levels of workplace heat which was associated with significant loss of labor effort reaching as high as 27%. Finally, monitoring productivity or the vineyard manager's estimate of each worker's labor effort at the end of the work shift did not completely reflect the studied workers' true labor effort during grape-picking.
Abbreviations
| ΔTsk | = | difference between the baseline mean skin temperature (i.e., at time 0) and the current mean skin temperature (°C) |
| solR | = | solar radiation (W/m2) |
| Tair | = | air temperature (°C) |
| Tsk | = | mean skin temperature (°C) |
| UTCI | = | universal thermal climate index (°C) |
| WBGT | = | wet bulb globe temperature (°C) |
| WTL | = | work time spent on labor (time, min:sec) |
| WTB | = | work time spent on irregular work breaks (time, min:sec) |
| WTBshade | = | work time spent on irregular breaks in the shade (time, min:sec) |
| WTBsun | = | work time spent on irregular work breaks under the sun (time, min:sec) |
Disclosure of potential conflicts of interest
There are no relevant financial or other relationships that might be perceived as leading to a conflict of interest in relation to this work. The funders had no role in study design, data collection and analysis, decision to publish, or preparation of the manuscript.
Acknowledgments
The authors are grateful to the volunteers and the vineyard management for their participation in this study.
Funding
The study has received funding from the European Union's Horizon 2020 research and innovation programme under the Grant agreement no. 668786.
Related Research Data
References
- Anderson K, Nelgen S. Global wine markets, 1961 to 2009: a statistical compendium. Adelaide, Australia: The University of Adelaide Press, 2011.
- Falcone G, De Luca AI, Stillitano T, Strano A, Romeo G, Gulisano G. Assessment of environmental and economic impacts of vine-growing combining life cycle assessment, life cycle costing and multicriterial analysis. Sustainability. 2016;8(8):793. PMID:28008371; doi:10.3390/Su8080793
- Finne M, Holmgren K, Sundqvist HS, Weiberg E, Lindblom M. Climate in the eastern Mediterranean, and adjacent regions, during the past 6000 years – a review. J Archaeol Sci. 2011;38(12):3153-3173. doi:10.1016/j.jas.2011.05.007
- Price C, Michaelides S, Pashiardis S, Alpert P. Long term changes in diurnal temperature range in Cyprus. Atmos Res. 1999;51(2):85-98. doi:10.1016/S0169-8095(99)00022-8
- Heudorf U, Schade M. Heat waves and mortality in Frankfurt am Main, Germany, 2003–2013: what effect do heat-health action plans and the heat warning system have? Z Gerontol Geriatr. 2014;47(6):475-482. PMID:25119702; doi:10.1007/s00391-014-0673-2
- Flouris AD, Schlader ZJ. Human behavioral thermoregulation during exercise in the heat. Scand J Med Sci Sports. 2015;25(Suppl 1):52-64. PMID:25943656; doi:10.1111/sms.12349
- Nybo L, Rasmussen P, Sawka MN. Performance in the heat-physiological factors of importance for hyperthermia-induced fatigue. Compr Physiol. 2014;4(2):657-689. PMID:24715563; doi:10.1002/cphy.c130012
- Junge N, Jorgensen R, Flouris AD, Nybo L. Prolonged self-paced exercise in the heat – environmental factors affecting performance. Temperature. 2016;3(4):539-548. PMID:28090557; doi:10.1080/23328940.2016.1216257
- Quiller G, Krenz J, Ebi K, Hess JJ, Fenske RA, Sampson PD, Pan M, Spector JT. Heat exposure and productivity in orchards: Implications for climate change research. Arch Environ Occup Health. 2017:1–4. PMID:28139172; doi:10.1080/19338244.2017.1288077
- Sahu S, Sett M, Kjellstrom T. Heat exposure, cardiovascular stress and work productivity in rice harvesters in India: implications for a climate change future. Ind Health. 2013;51(4):424-431. PMID:23685851; doi:10.2486/indhealth.2013-0006
- Lundgren K, Kuklane K, Gao CS, Holmer I. Effects of heat stress on working populations when facing climate change. Ind Health. 2013;51(1):3-15. PMID:23411752; doi:10.2486/indhealth.2012-0089
- Kjellstrom T, Holmer I, Lemke B. Workplace heat stress, health and productivity – an increasing challenge for low and middle-income countries during climate change. Glob Health Action. 2009;2. PMID:20052422; doi:10.3402/gha.v2i0.2047
- Jay O, Brotherhood JR. Occupational heat stress in Australian workplaces. Temperature. 2016;3(3):394-411. PMID:28349081; doi:10.1080/23328940.2016.1216256
- Hubler M, Klepper G, Peterson S. Costs of climate change: the effects of rising temperatures on health and productivity in Germany. Ecol Econ. 2008;68(1–2):381-393. doi:10.1016/j.ecolecon.2008.04.010
- Zander KK, Botzen WJW, Oppermann E, Kjellstrom T, Garnett ST. Heat stress causes substantial labour productivity loss in Australia. Nat Clim Change. 2015;5(7):647. doi:10.1038/Nclimate2623
- Ramos MC, Martı´nez-Casasnovas JA. Impact of land levelling on soil moisture and runoff variability in vineyards under different rainfall distributions in a Mediterranean climate and its influence on crop productivity. J Hydrol. 2006;321:131-146. doi:10.1016/j.jhydrol.2005.07.055
- Meade RD, Lauzon M, Poirier MP, Flouris AD, Kenny GP. The physical demands of electrical utilities work in North America. J Occup Environ Hyg. 2016;13(1):60-70. PMID:26317802; doi:10.1080/15459624.2015.1077966
- Faul F, Erdfelder E, Lang AG, Buchner A. G*Power 3: a flexible statistical power analysis program for the social, behavioral, and biomedical sciences. Behav Res Methods. 2007;39(2):175-191. PMID:17695343; doi:10.3758/BF03193146
- Jackson AS, Pollock ML. Practical assessment of body composition. Phys Sportsmed. 1985;13(5):76-90. PMID:27463295; doi:10.1080/00913847.1985.11708790
- Du Bois D, Du Bois EF. A formula to estimate the approximate surface area if height and weight be known. Arch Int Med. 1916;17(6):863-871. doi:10.1001/archinte.1916.00080130010002
- Jackson AS, Blair SN, Mahar MT, Wier LT, Ross RM, Stuteville JE. Prediction of functional aerobic capacity without exercise testing. Med Sci Sports Exerc. 1990;22(6):863-870. PMID:2287267; doi:10.1249/00005768-199012000-00021
- Ramanathan NL. A New Weighting system for mean surface temperature of the human body. J Appl Physiol. 1964;19:531-533. PMID:14173555
- European Commission. Solar radiation. European Commission, 2017. [accessed 2017 Feb 02]. http://re.jrc.ec.europa.eu/pvgis/apps4/pvest.php.
- Ruby Coast Research Centre Team. Excel heat stress calculator. www.ClimateCHIP.org (accessed 2017 Feb 4)
- Lemke B, Kjellstrom T. Calculating workplace WBGT from meteorological data: a tool for climate change assessment. Ind Health. 2012;50(4):267-278. PMID:22673363; doi:10.2486/indhealth.MS1352
- Liljegren JC, Carhart RA, Lawday P, Tschopp S, Sharp R. Modeling the wet bulb globe temperature using standard meteorological measurements. J Occup Environ Hyg. 2008;5(10):645-655. PMID:18668404; doi:10.1080/15459620802310770
- Bröde P, Fiala D, Błażejczyk K, Holmér I, Jendritzky G, Kampmann B, Tinz B, Havenith G. Deriving the operational procedure for the Universal Thermal Climate Index (UTCI). Int J Biometeorol 2012; 56(3):481–94; PMID:21626294; https://doi.org/10.1007/s00484-011-0454-1
- Universal Thermal Climate Index calculator. [accessed 2017 Feb 04]. Available at: http://www.utci.org/
- da Silva AI, Fernandes LC, Fernandez R. Energy expenditure and intensity of physical activity in soccer referees during match-play. J Sports Sci Med. 2008;7(3):327-334. PMID:24149899
- Osgnach C, Poser S, Bernardini R, Rinaldo R, di Prampero PE. Energy cost and metabolic power in elite soccer: a new match analysis approach. Med Sci Sports Exerc. 2010;42(1):170-178. PMID:20010116; doi:10.1249/MSS.0b013e3181ae5cfd
- ACGIH. Hand activity level. In: 2001 TLVs and BEIs. Cincinnati (OH): ACGIH; 2001.
- Wurzelbacher S, Burt S, Crombie K, Ramsey J, Luo L, Allee S, Jin Y. A comparison of assessment methods of hand activity and force for use in calculating the ACGIH(R) hand activity level (HAL) TLV(R). J Occup Environ Hyg. 2010;7(7):407-416. PMID:20446152; doi:10.1080/15459624.2010.481171
- Food and Agriculture Organization of the United Nations. FAO Statistical Yearbook 2014. Europe and Central Asia. Budapest, Hungary: FAO Regional Office for Europe and Central Asia; 2014.
- Budd GM How should we measure occupational heat stress? Temperature. 2016;3(3):369-370. PMID:28352143; doi:10.1080/23328940.2016.1218992
- Flouris AD, Piantoni C. Links between thermoregulation and aging in endotherms and ectotherms. Temperature. 2015;2(1):73-85. PMID:27226994; doi:10.4161/23328940.2014.989793
- Tudor-Locke C, Ainsworth BE, Washington TL, Troiano R. Assigning metabolic equivalent values to the 2002 census occupational classification system. J Phys Act Health. 2011;8(4):581-586. PMID:21597131. https://doi.org/10.1123/jpah.8.4.581
- International Organization for Standardization. ISO standard 7243: hot environments – estimation of heat stress on working man based on the WBGT index (wet bulb globe temperature). Geneva: International Organization for Standardization; 1989.