
ABSTRACT
Accumulating comparative and interdisciplinary research supports a brain cooling function to yawning. In particular, previous research has shown significant decreases in both brain and skull temperature following yawning in mammals. In a recent study using a thermal imaging camera, significant reductions in both the cornea and concha temperature were observed following yawns in the high-yawning subline of Sprague-Dawley rats. Here, we performed a similar experiment to investigate shifts in facial temperature surrounding yawning in an avian species with more typical yawning patterns: budgerigars (Melopsittacus undulatus). In particular, we took maximal surface temperature recordings from the face (cere or eye) from 13 birds over a one-hour period to track changes before and after yawns. Similar to previous findings in high-yawning rats, we identified significant cooling (−0.36°C) of the face 10–20 seconds following yawning in budgerigars. Consistent with the hypothesis that yawns serve a thermoregulatory function, facial temperatures were slightly elevated just prior to yawning and then decreased significantly below baseline levels immediately thereafter. Similarly, birds that yawned during the trials had consistently higher facial temperatures compared to those that did not yawn. Moreover, yawn latency and overall yawn frequency were strongly correlated with the highest facial temperature recorded from each bird across trials. These results provide convergent evidence in support of a brain cooling function to yawning, and further validate the use of thermal imaging to monitor changes in skull temperature surrounding yawning events.
Introduction
Yawning or yawn-like mandibular gaping patterns have been documented across vertebrate classes,Citation1 but it remains unknown whether the jaw stretching of fish, amphibians and reptiles is congruent with yawns observed in birds and mammals.Citation2 Nonetheless, the ubiquitous nature of this reflexive behavior supports the view that it is an evolved adaptation. Many researchers have proposed hypotheses to explain the functional significance of yawning,Citation3 but few have garnered empirical support (for a review, see Citationref. 4). Comparatively, yawns appear to serve a role in promoting arousal and state change.Citation5-6 The muscular contractions of the jaw and accompanying deep inhalation of air that characterize yawning produce significant changes in intracranial circulation,Citation7 and recently it was posited that yawns function as a brain cooling mechanism.Citation8
Brain temperature of homeotherms is determined by the rate of arterial blood flow, the temperature of arterial blood flow, and any metabolic heat production within the brain.Citation9 In particular, the physiological consequences of yawning, i.e., enhanced blood flow to the skull and direct heat exchange with the ambient air, are predicted to alter the first two of these variables by cooling brain temperature through convective heat transfer.Citation10-11 In addition, yawning could lead to ventilation of the sinus system, which would promote evaporative cooling of the sinus mucosa.Citation12 The increases in localized circulation and changes in ventilation, which are associated with yawning, are well known mechanisms that cool brain temperature.Citation13-14
Since its conception, a growing number of reports have tested and confirmed the specific predictions derived from the brain cooling hypothesis (reviewed by Citationref. 11; but for critiques see Citationrefs. 15-16). In particular, a growing number of studies have linked brain and/or body temperature changes to yawning events and shown that yawns can be effectively altered (i.e., selectively increased or decreased) through the manipulation of ambient temperature.Citation17-23 According to this hypothesis, the onset of yawning should be preceded by rising brain temperature, and that once triggered yawns should produce a measurable cooling effect. Using thermocoupled temperature probes, Shoup-Knox et al.Citation24 aimed to directly capture this association among freely moving Sprague-Dawley rats. Consistent with the brain cooling hypothesis, yawning events in rats were triggered during rapid increases in the temperature of the prelimbic cortex tissue (+0.11°C), and following the execution of this response brain temperatures dropped precipitously down to baseline levels. Comparable temperature shifts, monitored through the use of an oral thermometer, have also been documented surrounding excessive yawning attacks in humans.Citation25
Recently, Eguibar et al.Citation26 examined the extent to which the aforementioned reductions in intracranial temperature associated with yawning produced cooling at the surface of the skull. Using a high-yawning subline of Sprague-Dawley rats,Citation27 thermographic images of the eye cornea and ear concha were captured before and after yawning events. Consistent with the brain cooling hypothesis, both cornea and concha temperatures significantly decreased (−0.32°C and −0.48°C, respectively) during and 10 seconds following yawns. These findings support the view that the physiological consequences of yawns provide a widespread cooling effect to the brain/skull, and not just internal tissues, and validate the use of thermal imaging to track changes in thermoregulation surrounding such events. While the use of high-yawning rats offered an effective model to initially assess this relationship, i.e., yawning frequency in high-yawning rats (20 yawns/h) is an order of magnitude higher than normal Sprague-Dawley rats (2 yawns/h)Citation28 as well as after pharmacologically- and neuropeptide-induced yawning,Citation27,29,30 similar studies are needed to replicate these findings in animals with more typical yawning patterns.
Here, we investigated skull surface temperature changes as a function of yawning in an avian species: budgerigars (Melopsittacus undulatus). These birds served as an appropriate non-mammalian model to explore this relationship because much is known about their naturalistic and experimentally-induced yawn frequency,Citation31-33 and yawning has previously been implicated in thermoregulation in this species.Citation17,34 Following a similar methodology to Eguibar et al.,Citation26 thermographic images were continuously captured at 10 second intervals to track immediate shifts in facial temperature before and after yawns. In addition, based on previous research showing a strong correlation between body temperature and yawning following stress within this species,Citation34 correlations were run to assess the relationship between both yawn latency and frequency and the maximum facial temperature measured across the trials.
Methods
The budgerigars in this study were from a captive non-breeding population maintained within the vivarium at the State University of New York at Oneonta, Oneonta, NY, U.S.A. The temperature of this indoor facility is maintained between 20–21°C, the light:dark cycle is set to 12:12 h (0700; 1900), and food, water and supplements are provided ad libitum. A total of 13 birds (11 male; 2 female) were tested during this experiment, which was approved by the local Institutional Animal Care and Use Committee (# 2014-05). All birds were the same age (1.5–2 years old at time of testing), and were housed socially in aviaries comprised of 10–13 individuals.
Each testing day, a single bird was captured at 1300h from the main aviary (1.626 m × 0.533 m × 1.575 m) and transported to a solitary testing room within the same facility also maintained between 20–21°C. Here, the bird was moved to a testing cage (0.305 m × 0.254 m × 0.279 m) that was modified to provide the placement of a FLIR E6 thermal imaging camera with an unobstructed view along the perch (∼0.2 m from the bird). Handling of the bird was kept to a minimum during capture and transport, but a 15-minute acclimation period was provided following relocation to the testing cage before recordings began. Following this, a trained researcher positioned the camera and manually took thermographic images of the skull at 10 second intervals for a period of roughly one hour (59.65 ± 1.53 minutes), totaling 4653 data points across the entire sample. The researcher was careful to sit as still and quietly as possible during the length of each trial.
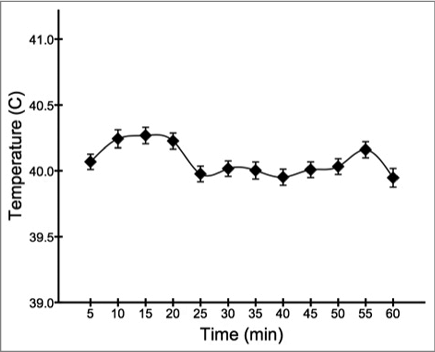
The FLIR E6 camera was set to the “hot spot” feature to obtain the maximum surface temperature to the nearest 0.1°C within the focal point of each image. Based on pilot data, maximum temperatures from the skull were primarily observed from the cere or eye region of the face (). Following each trial, a separate researcher checked all images to ensure that maximum facial temperature was recorded. Due to continuous head movements and natural repositioning of the animals, i.e., the bird turning slightly away from the camera or subtly moving along the perch, 8.9% of the images did not meet this criterion and were removed from the analysis. depicts the pattern of overall temperature across the remaining recordings, broken down into 5 minute intervals.
Figure 1. Representative thermographic image depicting the maximum facial temperature (from the cere) of a budgerigar. The cross indicates the “hot spot” within the focal bracket at the center of the image. The temperature scale is depicted on the right.
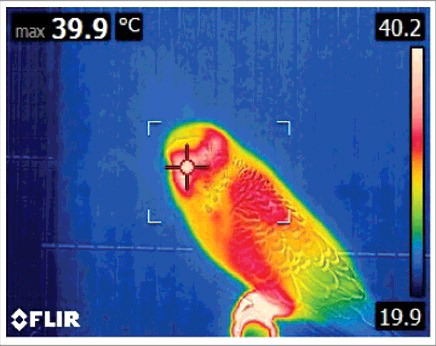
Figure 2. Overall facial temperature (mean ± s.e.m.) across the testing period, broken down into 5 minute intervals.
The researchers that ran these trials (N = 3) all had at least 1 year of experience working within the laboratory and identifying yawns from this species. These individuals were instructed to pay close attention to the yawning behavior of the birds during testing. Budgerigar yawning is characterized by a wide opening of the beak with slight closure of the eyes, followed by a brief pause with stretching of the neck (see Citationref. 31 and Citation32). After a bird yawned, the researcher would immediately take a thermographic image that was intentionally not focused on the animal. Because these post-yawn recordings were the only ones not centered on the skull of the bird, they were easily identified in the collection of time stamped images from each trial and used to mark the presence of a yawn within the sequence. No other associated behaviors were observed during the trials, which is consistent with previous research showing that stretching, for example, is very uncommon among captive budgerigars that have been isolated from conspecifics.Citation35,36
Only six of the 13 birds yawned during testing, for a total of 36 yawns. depicts the average yawning rate across the trials, broken down into 5 minute intervals. To stay consistent with Eguibar et al.,Citation26 data were analyzed from 20 seconds both preceding and following each yawn. Two sets of yawns were excluded because they were too closely spaced, whereby pre and post data overlapped. shows the descriptive statistics for all temperature measurements across the four 10 second intervals (−20 sec, −10 sec, 10 sec, 20 sec). To avoid reducing the sample size further by eliminating yawns that lacked maximum temperature measures at each of the four intervals due to movement artifacts, the 10 and 20 second data points were averaged to single pre and post measures. The remaining sample consisted of 30 yawns for comparison.
Figure 3. Overall yawn frequency (mean ± s.e.m.) during the testing period, broken down into 5 minute intervals. The horizontal line represents the mean yawn rate across intervals.
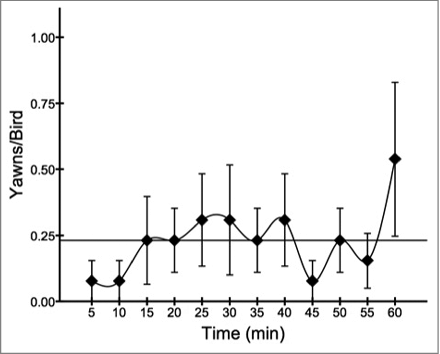
Table 1. Descriptive statistics (mean ± s.e.m.) for temperature intervals surrounding yawns.
A Generalized Linear Mixed Model was used to examine whether maximum facial temperature differed before and after yawning events. Since a repeated measures design was used, yawn number and bird ID were included as random factors. Based on the predictions of the brain cooling hypothesis,Citation8 and the recent thermographic findings from Eguibar et al.,Citation26 it was hypothesized that facial temperatures would be significantly lower following yawns. In addition, independent samples t-tests were run to compare the average and highest temperature measures recorded from birds that yawned with those that did not yawn during the trials. Correlations were also run to assess the linear relationships between yawn latency (i.e., time to first yawn, in minutes, following the first image captured) and frequency with the maximum facial temperature recorded during each trial. Based on previous research linking yawning with body temperature in this species following a prolonged handling restraint,Citation34 it was hypothesized that birds with higher facial temperature would yawn sooner and more frequently across the experiment. Due to a small sample size, a Kendall's tau non-parametric correlation was used (one-tailed test). All analyses were conducted in SPSS v.22. The mean and standard error of the mean (s.e.m.) are reported below.
Results
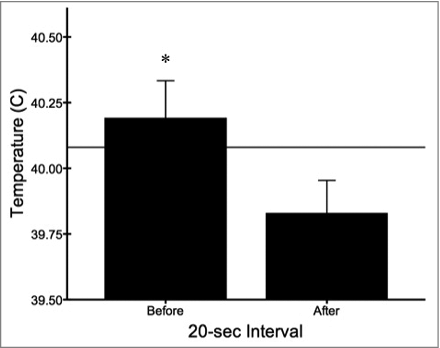
Across all trials and recordings, the baseline maximum facial temperature of birds outside of all yawning events (i.e., excluding measures 20 seconds preceding and following yawns) was 40.08°C. As predicted, the maximum facial temperature of budgerigars differed significantly when comparing measures before and after yawning (F1,58 = 6.370, p = 0.014). In particular, facial temperature dropped from 40.19 ± 0.14°C just before yawning to 39.83 ± 0.13°C immediately following these events (). Thus, consistent with the predictions of the brain cooling hypothesis, facial temperatures were slightly elevated prior to the onset of yawning (+0.11°C) before dropping below baseline levels (−0.25°C) immediately following the execution of this response.
Figure 4. Facial temperature (mean ± s.e.m.) became slightly elevated prior to yawning and decreased significantly thereafter (*p < 0.05). The horizontal line represents the baseline temperature outside of all yawning events.
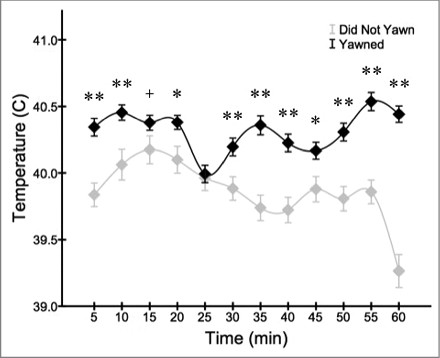
When comparing the average and highest overall facial temperature recordings captured from each bird during the trials, individuals that yawned at least once showed higher measures compared to birds that did not yawn during testing. This difference was significant across all temperature recordings (t4235 = 12.547, p < 0.001; ), and approached significance for the highest recording captured during each trial (t11 = 1.936, p = 0.079). When examining the time course of temperature changes across trials, yawning birds showed consistently higher facial recordings compared to those that did not yawn (). The pairwise comparisons at 5 minute intervals were all significant (p < 0.05) except for 10–15 minutes and 20–25 minutes post recording.
Figure 5. Across all recordings, birds that yawned at least once showed higher facial temperatures (mean ± s.e.m) than birds that did not yawn during testing (**p <0.01).
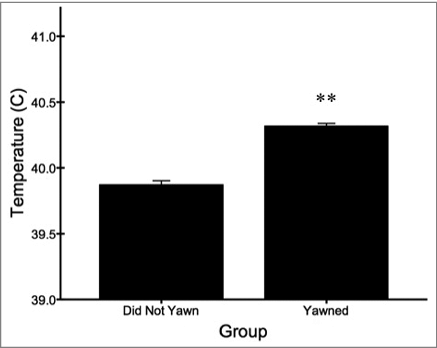
Figure 6. Birds that yawned at least once showed consistently higher facial recordings (mean ± s.e.m.) across the testing period (+p < 0.1; *p < 0.05; **p < 0.01).
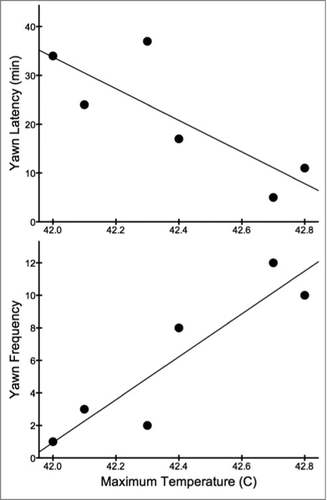
Furthermore, as predicted by the brain cooling hypothesis, both yawn latency and overall yawn frequency across trials were significantly correlated with the highest facial temperature recorded from each bird during the experiment (latency: τ13 = −0.465, p = 0.019; frequency: τ13 = 0.495, p = 0.014). Among only birds that yawned, these correlations were even more robust (latency: τ6 = −0.600, p = 0.045; frequency: τ6 = 0.773, p = 0.019; ). That is, budgerigars with the most elevated temperatures yawned earlier on and more frequently across trials.
Figure 7. Maximum facial temperature was strongly correlated with both yawn latency (top) and yawn frequency (bottom) across trials. Data from birds that yawned are shown above (N = 6).
Discussion
The motor action pattern of yawning produces profound changes in localized (i.e., intracranial) circulation and ventilation, which now have well documented thermoregulatory effects.Citation10,11 As a follow-up to a recent report in which decreases in skull temperature were documented following yawns in a subline of high-yawning Sprague-Dawley rats,Citation26 we show that yawning produces very similar reductions in the facial temperature of an avian species with more typical yawning patterns. In particular, budgerigars experienced an average temperature reduction of −0.36°C in the cere/eye region 10–20 seconds after yawns, which is consistent with the temperature decrements detected at the eye cornea (−0.32°C) and ear concha (−0.48°C) within the high-yawning rats.
In accord with the brain cooling hypothesis, facial temperatures differed considerably between birds that yawned compared to those that did not yawn during the experiment. Moreover, budgerigars with the highest facial temperature recordings yawned sooner following the onset of the recordings and more frequently across trials. These results are consistent with a previous study investigating stress-induced hyperthermia in this species, whereby a similar negative correlation was observed between body temperature and yawn latency.Citation34 Given that the birds in the current study were briefly handled and placed in isolation for testing, we cannot rule out the possibility that the yawning and associated temperature changes reported here were also stress-induced.Citation37,38
Overall, these findings suggest that yawning is a thermoregulatory behavior in this species,Citation25 and generally support previous research indicating a selective brain cooling function to the opening and closing of the beak in birds through the ventilation of the sinus system.Citation39,40 In budgerigars, the sinus walls contribute to dissipation of heat through convection, conduction and heat loss by evaporation.Citation41 Importantly, in birds the beak and surrounding tissue is an important dissipater of heat (as illustrated in ),Citation42,43 because other areas are covered by plumage. Other mechanisms used in thermoregulation around this area include panting and gular fluttering, which are also closely related to yawning.Citation17
In summary, the current study provides convergent evidence supporting a widespread brain cooling function to yawning that can be captured through the use of thermographic images of the skull. We suggest that future research employ the use of thermal imaging to investigate the relationship between yawning and thermoregulation in other species, including poikilotherms.
Disclosure of potential conflicts of interest
No potential conflicts of interest are disclosed.
Additional information
Funding
References
- Baenninger R. Some comparative aspects of yawning in Betta splendens, Homo sapiens, Panthera leo, and Papio sphinx. J. Comp. Psychol. 1987;101(4):349-354. https://doi.org/10.1037/0735-7036.101.4.349
- Gallup AC Why do we yawn? Primitive versus derived features. Neurosci. Biobehav. Rev. 2011;35(3):765-769. https://doi.org/10.1016/j.neubiorev.2010.09.009. PMID:20883719
- Smith EO. Yawning: an evolutionary perspective. Hum. Evol. 1999;14(3):191-198. https://doi.org/10.1007/BF02440156
- Guggisberg AG, Mathis J, Schnider A, Hess CW Why do we yawn?. Neurosci. Biobehav. Rev. 2010;34(8):1267-1276. https://doi.org/10.1016/j.neubiorev.2010.03.008. PMID:20382180
- Baenninger R. On yawning and its functions. Psychon. Bull. Rev. 1997;4(2):198-207. https://doi.org/10.3758/BF03209394. PMID:21331826
- Provine RR. Yawning: the yawn is primal, unstoppable and contagious, revealing the evolutionary and neural basis of empathy and unconscious behavior. Am. Sci. 2005;93(6):532-539. https://doi.org/10.1511/2005.56.980
- Walusinski O. How yawning switches the default‐mode network to the attentional network by activating the cerebrospinal fluid flow. Clin. Anat. 2014;27(2):201-209. https://doi.org/10.1002/ca.22280. PMID:23813685
- Gallup AC, Gallup Jr GG. Yawning as a brain cooling mechanism: nasal breathing and forehead cooling diminish the incidence of contagious yawning. Evol. Psychol. 2007;5(1):92-101. https://doi.org/10.1177/147470490700500109
- Baker MA. Brain cooling in endotherms in heat and exercise. Ann. Rev. Physiol. 1982;44(1):85-85. https://doi.org/10.1146/annurev.ph.44.030182.000505
- Gallup AC, Gallup Jr GG. Yawning and thermoregulation. Physiol. Behav. 2008;95(1):10-16. https://doi.org/10.1016/j.physbeh.2008.05.003. PMID:18550130
- Gallup AC, Eldakar OT. The thermoregulatory theory of yawning: what we know from over 5 years of research. Front. Neurosci. 2012;6:188. PMID:23293583
- Gallup AC, Hack GD. Human paranasal sinuses and selective brain cooling: a ventilation system activated by yawning?. Med. Hypoth. 2011;77(6):970-973. https://doi.org/10.1016/j.mehy.2011.08.022
- Cabanac M, Brinnel H. Blood flow in the emissary veins of the human head during hyperthermia. Euro. J. Appl. Physiol. Occup. Physiol. 1985;54(2):172-176. https://doi.org/10.1007/BF02335925
- Zenker W, Kubik S. Brain cooling in humans—anatomical considerations. Anat. Embryol. 1996;193(1):1-13. https://doi.org/10.1007/BF00186829. PMID:8838492
- Elo H. Yawning and thermoregulation. Sleep Breath. 2010;14(4):391-392. https://doi.org/10.1007/s11325-010-0364-1. PMID:20508992
- Guggisberg AG, Mathis J, Schnider A, Hess CW. Why do we yawn? The importance of evidence for specific yawn-induced effects. Neurosci. Biobehav. Rev. 2011;35(5):1302-1304. https://doi.org/10.1016/j.neubiorev.2010.12.004. PMID:21168437
- Gallup AC, Miller ML, Clark AB. Yawning and thermoregulation in budgerigars, Melopsittacus undulatus. Anim. Behav. 2009;77(1):109-113. https://doi.org/10.1016/j.anbehav.2008.09.014
- Gallup AC, Miller ML, Clark AB. The direction and range of ambient temperature change influences yawning in budgerigars (Melopsittacus undulatus). J. Comp. Psychol. 2010;124(2):133-138. https://doi.org/10.1037/a0018006. PMID:20476812
- Gallup AC, Miller RR, Clark AB. Changes in ambient temperature trigger yawning but not stretching in rats. Ethol. 2011;117:14s5-153. https://doi.org/10.1111/j.1439-0310.2010.01854.x
- Gallup AC, Eldakar OT. Contagious yawning and seasonal climate variation. Front. Evol. Neurosci. 2011;3:3. https://doi.org/10.3389/fnevo.2011.00003. PMID:21960970
- Massen JJM, Dusch K, Eldakar OT, Gallup AC. A thermal window for yawning in humans: yawning as a brain cooling mechanism. Physiol. Behav. 2014;130:145-148. https://doi.org/10.1016/j.physbeh.2014.03.032. PMID:24721675
- Eldakar OT, Dauzonne M, Prilutzkaya Y, Garcia D, Thadal C, Gallup AC. Temperature-dependent variation in self-reported contagious yawning. Adapt. Hum. Behav. Physiol. 2015;1(4):460-466. https://doi.org/10.1007/s40750-015-0024-6
- Gallup AC. Ambient temperature modulates yawning. Temperature. 2016;3(1):23-24. https://doi.org/10.1080/23328940.2015.1066925
- Shoup-Knox ML, Gallup AC, Gallup Jr GG, McNay EC. Yawning and stretching predict brain temperature changes in rats: support for the thermoregulatory hypothesis. Front. Evol. Neurosci. 2010;2:108. https://doi.org/10.3389/fnevo.2010.00108. PMID:21031034
- Gallup AC, Gallup Jr GG. Excessive yawning and thermoregulation: two case histories of chronic, debilitating bouts of yawning. Sleep Breath. 2010;14(2):157-159. https://doi.org/10.1007/s11325-009-0287-x. PMID:19657685
- Eguibar JR, Uribe CA, Cortes C, Bautista A, Gallup AC. Yawning reduces facial temperature in the high-yawning subline of Sprague-Dawley rats. BMC Neurosci. 2017;18(1):3. https://doi.org/10.1186/s12868-016-0330-3. PMID:28049450
- Eguibar JR, Cortes C, Isidro O, Ugarte A. Central administration of oxytocin differentially increases yawning, penile erections and scratching in high-(HY) and low-yawning (LY) sublines of Sprague–Dawley rats. Pharmacol. Biochem. Behav. 2015;134:6-11. https://doi.org/10.1016/j.pbb.2015.04.009. PMID:25931266
- Urbá-Holmgren R, Trucios N, Holmgren B, Eguibar J, Gavito A, Cruz G, Santos A. Genotypic dependency of spontaneous yawning frequency in the rat. Behav. Brain Res. 1990;40(1):29-35. https://doi.org/10.1016/0166-4328(90)90039-H. PMID:2278654
- Eguibar JR, Romero-Carbente JC, Moyaho A. Behavioral differences between selectively bred rats: D 1 versus D 2 receptors in yawning and grooming. Pharmacol. Biochem. Behav. 2003;74(4):827-832. https://doi.org/10.1016/S0091-3057(02)01082-1. PMID:12667896
- Eguibar JR, Barajas M, Moyaho A. Genotype-dependent effect of ACTH 1–24 on grooming and yawning in two inbred strains of rats. Neuropeptides. 2004;38(5):283-288. https://doi.org/10.1016/j.npep.2004.05.003. PMID:15464193
- Gallup AC, Militello J, Swartwood L, Sackett S. Experimental evidence of contagious yawning in budgerigars (Melopsittacus undulatus). Anim. Cog. 2015;18(5):1051-1058. https://doi.org/10.1007/s10071-015-0873-1
- Miller ML, Gallup AC, Vogel AR, Vicario SM, Clark AB. Evidence for contagious behaviors in budgerigars (Melopsittacus undulatus): an observational study of yawning and stretching. Behav. Process. 2012a;89(3):264-270. https://doi.org/10.1016/j.beproc.2011.12.012
- Miller ML, Gallup AC, Vogel AR, Vicario SM, Clark AB. Auditory disturbances promote temporal clustering of yawning and stretching in small groups of budgerigars (Melopsittacus undulatus). J. Comp. Psychol. 2012b;126(3):324-328. https://doi.org/10.1037/a0026520
- Miller ML, Gallup AC, Vogel AR, Clark AB. Handling stress initially inhibits, but then potentiates yawning in budgerigars (Melopsittacus undulatus). Anim. Behav. 2010;80(4):615-619. https://doi.org/10.1016/j.anbehav.2010.05.018
- Gallup AC, Militello J, Swartwood L, Sackett S. Experimental evidence of contagious stretching and ingroup bias in budgerigars (Melopsittacus undulatus). J. Comp. Psychol. 2017;131(1):69-72. https://doi.org/10.1037/com0000047. PMID:28182488
- Ikkatai Y, Okanoya K, Seki Y. Observing real-time social interaction via telecommunication methods in budgerigars (Melopsittacus undulatus). Behav. Process. 2016;128:29-36. https://doi.org/10.1016/j.beproc.2016.03.020
- Liang AC, Grace JK, Tompkins EM, Anderson DJ. Yawning, acute stressors, and arousal reduction in Nazca booby adults and nestlings. Physiol. Behav. 2015;140:38-43. https://doi.org/10.1016/j.physbeh.2014.11.029. PMID:25498600
- Eldakar OT, Tartar JL, Garcia D, Ramirez V, Dauzonne M, Armani Y, Gallup AC. Acute physical stress modulates the temporal expression of self-reported contagious yawning in humans. Adapt. Hum. Behav. Physiol. 2017;3(2):156-170. https://doi.org/10.1007/s40750-017-0060-5
- Witmer LM. The evolution of the antorbital cavity of archosaurs: a study in soft-tissue reconstruction in the fossil record with an analysis of the function of pneumaticity. J. Vert. Paleontol. 1997;17(S1):1-76. https://doi.org/10.1080/02724634.1997.10011027
- Sedlmayr JC, Witmer LM. The avian suborbital air sac and its potential role in brain cooling in birds and other dinosaurs. Annual meeting of the Society of Integrative and Comparative Biology, Chicago, Illinois, January. Am. Zool. 2001;40:1206.
- Xue X, Liu J. Mechanism interpretation of the biological brain cooling and its inspiration on bionic engineering. J. Bionic Eng. 2011;8(3):207-222. https://doi.org/10.1016/S1672-6529(11)60030-9
- Tattersall GJ, Andrade DV, Abe AS. Heat exchange from the toucan bill reveals a controllable vascular thermal radiator. Science. 2009;325(5939):468-470. https://doi.org/10.1126/science.1175553. PMID:19628866
- Andrade DV. Thermal windows and heat exchange. Temperature. 2015;2(4):451. https://doi.org/10.1080/23328940.2015.1040945