
 ?Mathematical formulae have been encoded as MathML and are displayed in this HTML version using MathJax in order to improve their display. Uncheck the box to turn MathJax off. This feature requires Javascript. Click on a formula to zoom.
ABSTRACT
Population aging and global warming generate important public health risks, as older adults have increased susceptibility to heat stress (SHS). We defined and validated sex-specific screening criteria for SHS during work and leisure activities in hot environments in individuals aged 31–70 years using age, anthropometry, and cardiorespiratory fitness. A total of 123 males and 44 females [44 ± 14 years; 22.9 ± 7.4% body fat; 40.3 ± 8.6 peak oxygen uptake (mlO2/kg/min)] participated, separated into the Analysis (n = 111) and Validation (n = 56) groups. Within these groups, participants were categorized into YOUNG (19–30 years; n = 47) and OLDER (31–70 years; n = 120). All participants performed exercise in the heat inside a direct calorimeter. Screening criteria for OLDER participants were defined from the Analysis group and were cross-validated in the Validation group. Results showed that 30% of OLDER individuals in the Analysis group were screened as SHS positive. A total of 274 statistically valid (p < 0.05) criteria were identified suggesting that OLDER participants were at risk for SHS when demonstrating two or more of the following (males/females): age ≥ 53.0/55.8 years; body mass index ≥29.5/25.7 kg/m2; body fat percentage ≥ 28.8/34.9; body surface area ≤2.0/1.7 m2; peak oxygen uptake ≤48.3/41.4 mlO2/kg fat free mass/min. In the Validation group, McNemar χ2 comparisons confirmed acceptable validity for the developed criteria. We conclude that the developed criteria can effectively screen individuals 31–70 years who are at risk for SHS during work and leisure activities in hot environments and can provide simple and effective means to mitigate the public health risks caused by heat exposure.
Introduction
Rising environmental temperatures represent a major threat to public health and industrial competitiveness.Citation1 The World Health Organization estimates that heat exposure will cause 38,000 and >100,000 additional deaths per year during the 2030s and the 2050s, respectively.Citation2 Moreover, more than half (56%) of the estimated total economic cost due to climate change in 2030 is expected to be due to heat exposure within the workplace leading to reduced work capacity and productivity.Citation3 To address this growing public health issue, expertsCitation2,Citation4 have urged the development of criteria to identify and, ultimately, protect individuals who are less tolerant of acute exposures to heat stress during work or leisure activities. This is particularly important for those who are still part of the workforce and, thus, are physically active during periods of increased ambient heat.
Over the last 100 years, more than 160 heat stress indices have been proposed,Citation5 the majority of which consider meteorological factors (e.g., temperature, humidity, wind, solar radiation) and elements of the physical environment that can be measured with instruments. Unfortunately, the efficacy of these indices for the management of heat strain imposed upon individuals during work or leisure activities is limited.Citation6-11 Indeed, the fact that heat injuries can occur in a wide range of air temperatures (26–49 °C) and water-vapour pressures (0.8–3.5 kPa, corresponding to 10–100% relative humidity) has been recognized since the early studies aiming to develop heat stress indices.Citation12-14 While these analyses showed that heat injuries were more prevalent in unfit, obese, and unacclimatised individuals, the heat stress indices did not consider these attributes in the guidelines that were developed.Citation6 To date, while some indices do consider human factors (e.g., activity level, clothing, posture),Citation5 this aspect has received much less attention. More importantly, additional intrinsic factors for heat injury prevention that are known to increase an individual's susceptibility to heat stress (SHS) – such as sex,Citation15 age,Citation16 body composition,Citation17 and cardiorespiratory fitnessCitation18 – have not been considered. The aim of the present study was to define and validate sex-specific screening criteria for SHS during work and leisure activities in hot environments in individuals aged 31–70 years using age, anthropometry, and cardiorespiratory fitness.
Materials and methods
Study setting and participants
The study was conducted according to the principles expressed in the Declaration of Helsinki and was approved by the University of Ottawa Health Sciences and Science Research Ethics Board. Exclusion criteria included age (<18 or >70 years) and history of smoking, hypertension, heart disease, diabetes, or autonomic/thyroid disorders. Participants were informed of all experimental procedures and associated risks before providing written consent. The minimum required sample size was determined using data from previous studiesCitation16,Citation19 where whole-body and local thermal responses of males and females of different ages were recorded during intermittent exercise in the heat. Sample size calculations were conducted using G*Power 3.0.Citation20 The asymptotic relative efficiency method of the “Wilcoxon signed-rank test” was used to calculate the power of the within effect. A two-tailed test was selected. Statistical power and α error probability were set to 0.95 and 0.05, respectively. The minimum required sample size was determined by calculating the effect size d. Using the aforementioned published data,Citation16,Citation19 the resulting minimum required sample size was 14 participants. Given that our study involved not only comparisons among age- and sex-specific age groups but – primarily – the development of screening criteria for age, anthropometry, and cardiorespiratory fitness using Receiver Operating Characteristic (ROC) curves, we recruited a larger sample of participants.
A total of 203 volunteers (151 males; 52 females) were screened for this study, of whom 32 (∼19%) were excluded or lost to follow-up. Thus, a total of 171 individuals (127 males; 44 females) participated from the general community (recruited via posters and word of mouth). A 3-month physical activity recall questionnaireCitation21 revealed that participants were habitually active (average 3–4 days of structured exercise for 30–60 min daily). All females aged ≤40 years were pre-menopausal, were not taking any medications except, in one case, monophasic oral contraceptives (30–35 µg of ethinyl estrogen and low dose progestin for 21 days and placebo for 7 days), and were tested in the early to mid-follicular phase. Five of the females aged >40 years were perimenopausal, while all others were postmenopausal with two being on hormone replacement therapy.
Data collection was conducted between February 2011 and April 2014 at the University of Ottawa. To eliminate the effects of time of year on the results, half of the measurements were performed during the cold part of the year (November-March) and the remaining half of the measurements were performed during the warm part of the year (April-September). Participants were distributed, in a simple randomization order,Citation22 to the Analysis group (87 males; 24 females) and the Validation group (40 males; 20 females).
Experimental design
During a preliminary session, participants received an orientation to the instrumentation and experimental protocol(s), and subsequently completed body composition and fitness assessments. For each experiment, participants arrived at the laboratory in the morning after eating a light meal and having minimized exposure to thermal stimuli. They were instructed to refrain from intense exercise (i.e., causing them to sweat) as well as alcohol and caffeine consumption for 24 hours before the experiment. To ensure euhydration, participants were instructed to drink ∼500 mL of water going to bed, in the morning of each experiment, and within 2 hours of the start of the experiment. No fluid was ingested during the experiment. Pre-experimental session urine specific gravity was determined in duplicate to ensure euhydration using a handheld total solids refractometer (model TS400, Reichter Inc., Depew, NY, USA). Participant hydration level, based on urine specific gravity measurements, was determined and classified as either euhydrated (< 1.020) or dehydrated (≥ 1.020).Citation23 The experiment commenced only if a participant was deemed as euhydrated, according to these guidelines. Clothing was standardized to running shorts and sandals with a sports bra for women.
Experiments were conducted in the Snellen whole-body direct calorimeterCitation24 using intermittent physical activity protocols that followed occupational guidelines for moderate-to-high intensity workCitation25 and workloads representative of daily living (e.g., mowing lawn, drilling hardwood, low impact aerobics dancing)Citation26,Citation27 and work-related (e.g., mining, electrical utilities)Citation28 activities.
All 111 participants of the Analysis group underwent a 2.5-hour experiment in hot-dry conditions (35°C; 20% relative humidity). On a separate day (order determined via simple randomization),Citation22 87 of these participants (70 males, 17 females) completed the same experiment in hot-humid conditions (35°C; 60% relative humidity). In both cases, after resting in an upright semi-recumbent position for a 30-min baseline period, participants performed four 15-min bouts of semi-recumbent cycling at a constant rate of metabolic heat production equal to 400 W (males) or 300 W (females), each separated by 15-min of inactive rest. All 60 participants of the Validation group underwent a 1-hour experiment in hot-dry conditions (40°C; 15% relative humidity). Following a 30-min baseline period, they performed 30-min of cycling in a semi-recumbent position at a constant rate of metabolic heat production equal to 300 W (males) or 250 W (females).
Screening variables
Age and anthropometry
Age, accurate to 0.5 years, was recorded. Body height, accurate to 1 cm, was determined using a stadiometer (Detecto, model 2391, Webb City, MO, USA), while body mass, accurate to 0.1 kg, was measured using a digital high-performance weighing terminal (model CBU150X, Mettler Toledo Inc., Mississauga, ON, CAN). Body surface area was subsequently calculated from the measurements of body height and mass according to DuBois and DuBois.Citation29 Body density was measured using the hydrostatic weighing technique, and results were used to calculate body fat percentage (accurate to 0.1%) using the Siri equation.Citation30
Cardiorespiratory fitness
Peak oxygen uptake [, expressed as absolute values (in L·min−1), relative to body weight (in mlO2·kg−1·min−1), and relative to fat free mass (in mlO2·kg−1·min−1)] was measured on a semi-recumbent cycle ergometer (Corival, Lode B.V., Groningen, Netherlands) during a progressive incremental exercise protocolCitation31 which consisted of a 2-min warm-up at 40 W followed by 20 W increments every minute until the participant could no longer maintain a pedalling cadence of at least 60 rev·min−1. For participants aged >50 years, a continuous 12-lead ECG (Pulse Biomedical Inc., Norristown, PA, USA) was monitored throughout the graded exercise test by a qualified technician to detect any abnormalities in heart activity.
Thermoregulatory variables
A comprehensiveCitation32,Citation33 approach was used to quantify participants’ susceptibility to heat stress (SHS). During each experiment, standardized procedures were used to monitor several thermoregulatory variables grouped in the following three categories:
| ■ | ▪ whole-body thermal responses (rate of whole-body evaporative heat loss, whole-body dry heat exchange, total heat loss, change in body heat content, and whole-body sweat rate) assessed by whole-body direct calorimetryCitation24; | ||||
| ■ | ▪ local thermal responses (rectal/visceral/mean skin temperatures, local sweat rate on the upper back, and the physiological heat strain index); | ||||
| ■ | ▪ perceived strain (rating of perceived exertion,Citation34 thermal comfort and thermal sensation,Citation35 and the perceptual heat strain indexCitation36) at the end of each exercise bout of the experiment. | ||||
Whole body thermal responses
The rates of whole body evaporative heat loss, whole-body sweat rate, and dry heat exchange were measured using the whole-body direct calorimetry technique in the modified Snellen air calorimeter. The measurements of evaporative and dry heat exchange were subtracted from concurrent measures of indirect calorimetry to calculate the change in body heat content as detailed previously.Citation37 These variables were assessed separately for the entire duration of the experiment as well as for each separate exercise bout. The reader is referred to a full technical description of the fundamental principles and performance characteristics of the Snellen calorimeter.Citation24 In summary, direct calorimetry continuously measured whole-body evaporative heat loss and dry heat exchange (radiation, conduction, convection), yielding an accuracy of ± 2.3 W for the measurement of whole-body heat loss. Given that a fundamental characteristic of direct calorimetry is to ensure complete evaporation of the sweat produced, whole-body sweat rate (in g∙min−1) was calculated as: evaporative heat loss (in W) multiplied by 60 s and divided by the latent heat of vaporisation of sweat at 30°C (2426 J . gsweat−1). Metabolic heat production was measured via indirect calorimetry using electrochemical gas analyzers (AMETEK model S-3A/1 and CD 3A, Applied Electrochemistry, Pittsburgh, PA, USA) located outside of the calorimeter which were used to determine the concentration of expired O2 and CO2 during each experimental session and subsequently the respiratory exchange ratio. Using the energy equivalent for the full oxidation of carbohydrates (19.63 kJ per L of O2 consumed) and fats (21.13 kJ per L of O2 consumed), metabolic heat production can be subsequently calculated.Citation37 To account for respiratory heat exchange, expired air was recycled back into the calorimeter. The change in body heat storage was subsequently calculated by subtracting the total amount of heat produced and heat dissipated over the experimental protocol.
Local thermal responses
Given the known limitations of single-point core temperature measurements,Citation33 core temperature was measured in the rectum, the esophagus, and in the visceral organs. Rectal temperature was measured by inserting a thermocouple probe (Mon-a-therm General Purpose Temperature Probe, Mallinckrodt Medical, St. Louis, MO) to a minimum of 12 cm past the anal sphincter. The same type of temperature probe was inserted ∼40 cm past the nostril and into the esophagus for the measurement of esophageal temperature. Visceral temperature was measured using a telemetric pill (VitalSense, Mini Mitter Company Inc., USA) which moves freely and unobstructed through the digestive tract and is typically eliminated within 48 hours of ingestion. Skin temperature was measured at four sites using 0.3-mm diameter T-type thermocouples (Concept Engineering, Old Saybrook, CT, USA) attached to the skin with surgical tape. Mean skin temperature was subsequently calculated using the four skin temperatures weighted to the following regional proportions: upper back, 30%; chest, 30%; quadriceps, 20%; and back calf, 20%. All temperature data were collected continuously using a HP Agilent data acquisition module (model no. 3497A) at a sampling rate of 15 sec and simultaneously displayed and recorded in spreadsheet format on a personal computer with LabVIEW software (version 7.0; National Instruments Corp., Austin, TX, USA). Average values for the baseline period as well as each exercise bout were calculated and used for analysis.
Heart rate was recorded continuously using a Polar coded WearLink and transmitter, Polar RS400 interface, and Polar ProTrainer 5 software (Polar Electro Oy, Kempele, Finland). The physiological heat strain index (PSI) was calculated from the measurements of core temperature and heart rate using the following equationCitation38:where
is the core temperature recorded at a given time point,
is the core temperature recorded at baseline, HRt is the heart rate recorded at a given time point and HR0 is the heart rate recorded at baseline.
The ventilated capsule technique was employed to measure local sweat rate. Sweat production on the upper back was measured from a plastic capsule attached to the skin with adhesive rings and topical skin glue (Collodion HV, Mavidon Medical Products, Lake Worth, FL, USA). Anhydrous compressed air was passed through each capsule at a rate of 1 L·min−1. Water content of the effluent air was measured using high-precision dew point mirrors (model 473; RH Systems, Albuquerque, NM, USA). Subsequently, local sweat rate was determined by calculating the difference in water content between effluent and influent air multiplied by the flow rate and normalized for the skin surface area under the capsule (mg·min−1·cm−2). Average values for each exercise bout were calculated and used for analysis.
Perceived strain
The rating of perceived exertion was assessed with a standardized scale (6 = no exertion at all, and 20 = maximal exertion)Citation34 at the end of each exercise bout. Thermal comfort was measured using the American Society of Heating, Refrigerating and Air Conditioning Engineers 7-point scale (0 = neutral and 7 = extremely hot) at the end of each exercise and recovery period.Citation39 Thermal sensation was measured using a previously described scale.Citation35 The perceptual heat strain index (PeSI) was calculated from the measurements of thermal sensation and perceived exertion using the following equationCitation36:where TSt is the thermal sensation recorded at a given time point and RPEt is the rating of perceived exertion recorded at a given time point.
Data analysis to develop screening criteria for SHS
Definition of SHS limits in the analysis group
As SHS and heat-stress mortality develop progressively during the 4th decade of life,Citation40-42 participants were divided into YOUNG (19–30 years; 47 individuals) and OLDER (31–70 years; 118 individuals) during the data analysis. Data from the YOUNG participants were used to define the limits of SHS using the following logic: mortality during intense heat is typically increased by 15% in young adults aged ≤30 years.Citation42,Citation43 In this light, the value at the 16th percentile (i.e., one standard deviation beyond the mean value) of the YOUNG individuals was used as a demarcation point signifying SHS for each thermoregulatory variable. Consequently, OLDER individuals were defined as SHS positive (SHS+) when their results were below the demarcation point in the following heat dissipation parameters: evaporative/dry/total heat loss, and local/whole-body sweat rate. Similarly, OLDER individuals were defined as SHS+ when their results were above the demarcation point in the following heat dissipation parameters: heat storage, core/skin temperatures, physiological strain index, and perceived strain. This procedure enabled labelling OLDER individuals based on whether their capacity to dissipate heat was within (SHS-) or not (SHS+) the “optimum” 84% (given the above-mentioned 16th percentile criterion) of the YOUNG group's variance in terms of whole-body thermal responses, local thermal responses, and perceived strain. It is important to note that each thermoregulatory variable was evaluated individually. Consequently, an individual could be labelled as SHS- based on one thermoregulatory variable (e.g., rectal temperature) and SHS+ based on another thermoregulatory variable (e.g., PeSI). The process used to select robust screening criteria from this labelling is described in the following section.
Selection of screening criteria for SHS in the analysis group
Data from the hot-dry and the hot-humid experiments were merged and analysed together to maximize accuracy (by increasing data pool) and practicality (by generating a single criterion per thermoregulatory variable). In order to select screening criteria for SHS, it was necessary to first confirm whether OLDER individuals, indeed, demonstrate a reduced capacity to dissipate heat. This was assessed by two-way repeated measures analysis of variance with age group (YOUNG, OLDER) and sex (males, females) used as factors to investigate the changes across time (baseline and exercise bouts 1, 2, 3, and 4) for total heat loss, whole-body sweat rate, and rectal temperature. Post hoc independent samples t-tests were used for pairwise comparisons between age and sex groups. Thereafter, it was necessary to confirm whether SHS+ individuals demonstrated a reduced capacity to dissipate heat. This was assessed via univariate analysis of variance with SHS status (SHS+, SHS-) and sex (males, females) used as factors to investigate the changes across time (baseline and exercise bouts 1, 2, 3, and 4) in total heat loss, whole-body sweat rate, and rectal temperature. Post hoc independent samples t-tests were used for pairwise comparisons between age and sex groups.
The following approach was adopted to select screening criteria that are robust enough to accurately identify individuals who are at risk of SHS, without falsely restricting people's ability to work or perform leisure activities in hot environments. All screening diagnostics were conducted in OLDER participants (the YOUNG were only used to define the SHS demarcation point, as described in the previous sub-section). Chi-square tests were used to compare prevalence rates of SHS+ in males and females. Having labelled individuals as SHS+ and SHS- based on each thermoregulatory variable (see previous section), ROC curve analysis was used to detect screening criteria identifying SHS+ for the following screening variables: age, BMI, height, weight, body surface area, body fat percentage, and . Separate ROC curve analyses in males and females for each thermoregulatory variable were computed for the baseline period and for each exercise bout of the experiment. Cohen's Kappa statistic was used to evaluate the agreement between each screening result and the individual's true SHS status.
Once all statistically significant criteria were identified, mean values were computed for each thermoregulatory category: whole-body thermal responses, local thermal responses, and perceived strain. Based on previous guidelines,Citation44 the screening criteria demonstrating the highest diagnostic odds ratio (DOR) were selected for further analysis. For the , only the highest-DOR format [either absolute values (in L·min−1), or relative to body weight values (in mlO2·kg−1·min−1), or relative to fat free mass values (in mlO2·kg−1·min−1)] was used to select a screening criterion to avoid redundancy. The DOR indicates how much an individual is more likely to be disease-positive if the test is positive, compared to cases where the test is negative (e.g., DOR of 2 means that the chance that the positive event occurs is twice higher if the test is positive than if it is negative). The DOR has been recommended as a single indicator of diagnostic performance, as it is closely linked to sensitivity and specificity, it enables formal meta-analysis, and it is derived from logistic models that allow correcting for heterogeneity between study characteristics (e.g., cohort vs. case-control).Citation44 Once a single criterion was selected for each screening variable (i.e., age, BMI, height, weight, body surface area, body fat percentage, and
), the true SHS prevalence (i.e., the one determined based on the thermoregulatory variables) was used as a guide to determine how many positive screening variables would be needed to bestow a SHS+ diagnosis.
Cross-validation of screening criteria for SHS
Data from the Validation group were used to cross-validate the selected criteria. Once again, the YOUNG participants in this group were used to define the SHS demarcation point for body heat storage, total heat loss, esophageal temperature, the PHSI, and the rating of perceived exertion, as described above. Thereafter, OLDER individuals in the Validation group were labelled as SHS+ or SHS- for each of these thermoregulatory variables based on whether their results were within the limits of SHS. Additionally, OLDER individuals were labelled as SHS+ or SHS- based on the selected criteria (see previous section) for age, BMI, height, weight, body surface area, body fat percentage, and . Cohen's Kappa statistic and McNemar χ2 tests assessed whether the age/anthropometry/fitness screening criteria resulted in the same proportion of SHS+ and SHS- OLDER individuals as measured via the thermoreguatory variables.
Statistics properties
The level of statistical significance for all analyses was set at p ≤ 0.05. The ROC curve analyses and the associated Kappa statistics and p values were computed using FAME Lab Statistics V1 (www.famelab.gr/research/downloads), while all other analyses were conducted using SPSS 21 (IBM, Armonk, NY, USA) statistics software.
Results
Participant characteristics appear in . No differences in age, height, weight, body surface area, body fat percentage, and peak oxygen uptake were detected between the Analysis and Validation groups (effect sizes ranging from 0.04 to 0.13).
Table 1. Participant characteristics [mean ± SD and range (in brackets)] and participant age distribution [sample size and percentage (in brackets)] in the two study groups.
Effects of age and sex
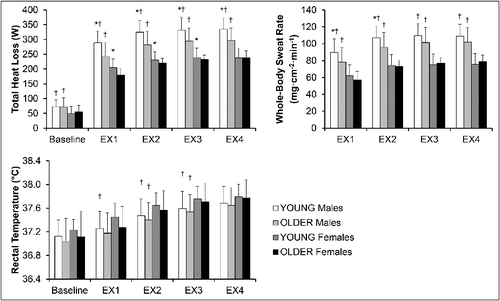
In the Analysis group, OLDER individuals demonstrated a reduced capacity to dissipate heat compared with YOUNG adults (). Specifically, while all variables in each group increased across time (main effect of time; F(9, 2277) = 25.68; p < 0.001), OLDER individuals (main effect of age group; F(3, 757) = 27.98; p < 0.001) and females (main effect of sex; F(3, 757) = 214.35; p < 0.001) demonstrated significantly reduced total heat loss and whole-body sweat rate as well as increased rectal temperature (all p < 0.005). Additionally, an interaction effect of age group*sex was detected on total heat loss whereby the difference between YOUNG and OLDER participants was more evident in males compared to females (p = 0.034).
Figure 1. Selected whole-body and local thermal responses in YOUNG and OLDER males and females of the Analysis group during the experiment. Figure note: YOUNG = individuals aged 19–30 years; OLDER = individuals aged 31–70 years; EX = exercise bout; * = statistically significant difference from OLDER participants of the same sex within the same time period (p < 0.05); † = statistically significant difference from the females of the same age group within the same time period (p < 0.05).
SHS in the analysis group
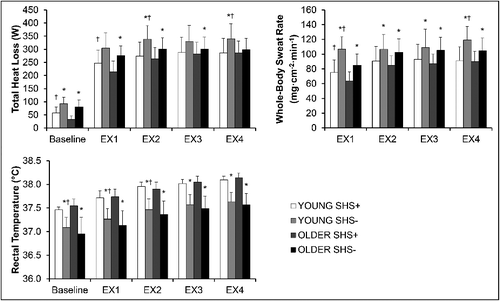
As expected, both YOUNG and OLDER individuals identified as “susceptible to heat stress” (SHS+) had a reduced capacity to dissipate heat [; 25 out of 30 comparisons indicated significant differences (p < 0.05)]. Specifically, although variables in YOUNG and OLDER participants labelled as SHS+ increased across time (main effect of time p < 0.001), values of total heat loss and whole-body sweat rate were significantly reduced, while rectal temperature was significantly increased (all p < 0.001) in SHS+ individuals compared to those labelled as “not susceptible to heat stress” (SHS-).
Figure 2. Selected whole-body and local thermal responses in YOUNG and OLDER participants of the Analysis group at high (SHS+) and low (SHS-) risk for susceptibility to heat stress. Figure note: YOUNG = individuals aged 19–30 years; OLDER = individuals aged 31–70 years; EX = exercise bout; SHS+ = positive screening for susceptibility to heat stress; SHS- = negative screening for susceptibility to heat stress; * = statistically significant difference from SHS+ of the same age group within the same time period (p<0.05); † = statistically significant difference from OLDER participants of the same SHS group within the same time period (p<0.05).
Overall, 30% (95% confidence interval: 24–36%) of OLDER individuals were identified as SHS+ (). Whole-body thermal responses were the most restrictive heat dissipation parameters reporting the highest SHS+ prevalence, while local thermal responses were the least restrictive group of heat dissipation parameters reporting the lowest number of SHS+ individuals (p < 0.05).
Table 2. Prevalence rates (±95% confidence interval) for SHS+ in OLDER participants of the Analysis group across each group of heat dissipation parameters.
Selection of screening criteria for SHS
A total of 274 statistically valid (p < 0.05) screening criteria for SHS were identified via ROC curves in the Analysis group, demonstrating sensitivity, specificity, and DOR equal to 0.75 ± 0.09, 0.69 ± 0.12, and 7.99 ± 8.49, respectively (mean ± 95% confidence interval). Detailed results for each individual criterion are provided in an Online Supplement. Mean results for the statistically significant screening criteria that were finally retained based on the DOR appear in (males) and (females), and were as follows (males/females):
| i) | age ≥53.0/55.8 years; | ||||
| ii) | body mass index ≥29.5/25.7 kg·m−2; | ||||
| iii) | body fat ≥28.8/34.9 percentage; | ||||
| iv) | body surface area ≤2.0/1.7 m2; | ||||
| v) | peak oxygen uptake ≤48.3/41.4 mlO2 · fat free kg−1 · min−1. | ||||
Table 3. Summarized ROC curve results for the statistically significant (p < 0.05) SHS+ screening criteria that were finally retained in the males of the Analysis group.
Table 4. Summarized ROC curve results for the statistically significant (p < 0.05) SHS+ screening criteria that were finally retained in the females of the Analysis group.
Summarized results for all statistically significant screening criteria within each thermoregulatory category (whole-body thermal responses, local thermal responses, and perceived strain) appear in an Online Supplement. The proportion of OLDER individuals in the Analysis group testing positive in one, two, three, or four of these criteria was: 0.40 ± 0.08, 0.28 ± 0.07, 0.06 ± 0.04, and 0.05 ± 0.04 (prevalence ± 95% confidence interval). There was no participant who tested positive in all five screening criteria. Given the above-mentioned overall true SHS+ prevalence (i.e., the one determined based on the thermoregulatory variables) of 0.30 ± 0.06, it was determined that two positive screening variables would be needed to bestow a SHS+ diagnosis. Based on these criteria, healthy individuals aged 31–70 years are at increased risk for SHS if they test positive in two or more of the aforementioned criteria.
Cross-validation of SHS screening criteria
In the independent subgroup of individuals used to cross-validate the developed SHS screening criteria (i.e., the Validation group), all Cohen's Kappa statistic comparisons demonstrated significant agreement between the proportion of OLDER individuals screened as SHS+ by the developed criteria and those measured as SHS+ by the measured thermoregulatory variables during the experiment (p < 0.05; ). The same was indicated by the McNemar χ2 comparisons which showed that the two marginal probabilities (the one from the screening criteria and the one from the measured thermoregulatory variables) were similar (p>0.05). The prevalence of SHS+ in the OLDER adults of the Validation group using the screening criteria was 0.48, while the prevalence of SHS+ using the thermoregulatory variables measured during the experiment was 0.55. Overall, the sensitivity, specificity, and DOR of the developed screening criteria were 0.72 ± 0.07, 0.73 ± 0.05, and 7.51 ± 2.53 (mean ± SD) when applied to this independent subgroup of OLDER adults.
Table 5. Performance of the developed criteria to detect OLDER individuals in the Validation group measured as SHS+ by the measured thermoregulatory variables.
Discussion
Susceptibility to heat stress (SHS) impacts the ability of individuals to perform their daily leisure and work-related activities.Citation2,Citation4,Citation28,Citation45,Citation46 This is particularly evident in older individuals who have a reduced capacity to dissipate heat and are, thus, predisposed to heat-induced pathologies (i.e., heat cramps, heat exhaustion, and heat stroke).Citation2,Citation47–49 In this observational study, we adopted a comprehensiveCitation32,Citation33 approach aimed at detecting heat stress, by assessing a number of thermoregulatory variables covering whole-body thermal responses, local thermal responses, and indices of perceived strain. Thereafter, we identified and validated sex-specific simple and practical screening criteria for SHS during work and leisure activities in hot environments in individuals aged 31–70 years. A total of five screening criteria were developed from simple information derived from age, anthropometry, and cardiorespiratory fitness. Our results demonstrate that men and women aged 31–70 years who test positive in two or more of these screening criteria have a higher risk for being unable to dissipate a sufficient amount of heat to avert marked increases in thermal strain and, therefore, are more likely to succumb to heat-related injuries.
We found that 30% (95% confidence interval: 24–36%) of healthy individuals aged 31–70 years are at risk for SHS. Although our measurements refer to acute heat stress, it is interesting to note that this mirrors epidemiological data for morbidity and mortality during extreme heat events.Citation42,Citation43 The array of indicators [age, sex, anthropometry (i.e., body composition), and cardiorespiratory fitness] used in our study have been very well studied and rigorously identified as risk factors for SHSCitation5,Citation15-18 as well as morbidity and mortality during extreme heat events.Citation6,Citation42,Citation43,Citation50,Citation51 In this study, we used these same risk factors in a more controlled environment and showed, for the first time, that they can be used to reliably detect SHS. Therefore, implementing the proposed screening criteria may help protect a significant proportion of the population, as the success of previously-developed safety criteria for the management of heat strain imposed upon individuals during work or leisure activities is limited.Citation6-11 This may be due to the requirements of previous criteria for sophisticated measurements and/or calculations that are also associated with high costs, requirements for advanced knowledge and training, and need for continuous monitoring. In sharp contrast, the current screening criteria are based on simple metrics. Moreover, the current analysis used the largest dataset ever collected to create screening criteria for work and leisure in hot environments and validated the developed criteria in an independent sample of individuals. Taken together with the high sensitivity and specificity, the developed screening criteria are the first to combine accuracy and validity with feasibility of implementation.
In determining the optimal level for each criterion, we selected a score that retained a low frequency of false-positive and false-negative rates because SHS+ is a serious health threat, but it usually does not require immediate medical attention. Therefore, our screening criteria are robust enough to accurately identify individuals who are at risk of SHS, without falsely restricting people's ability to work or perform leisure activities in hot environments. For example, the SHS prevalence rate suggests that any population of 200 equally distributed healthy men and women aged 31–70 years includes 60 people who are at risk for SHS. The average sensitivity and specificity obtained in the Analysis group indicate that the developed criteria would correctly identify 45 of these SHS+ individuals. These individuals would be referred to a health/occupational specialist for further assessment and education regarding prevention and management strategies. These results demonstrate that implementing the developed screening criteria has a high potential to drastically reduce heat-related morbidity and mortality. It is important to note, however, that 43 SHS- individuals in the aforementioned example would be misdiagnosed (i.e., false-positives: deemed as SHS+ when, in fact, they are SHS-). This means that the result provided by the developed criteria should be considered only as initial screening and that additional tests (e.g., a heat tolerance test) are required to confirm the SHS+ diagnosis. To ensure that the high performance of the proposed screening criteria is not specific to our Analysis group (the individuals used to derive these criteria), we applied them to an independent Validation group. This procedure confirmed that the vast majority of adults who work or perform leisure activities in hot environments and who are SHS+ would be detected by these simple screening criteria.
The SHS criterion detected for age (males: ≥53.0 years; females: ≥55.8 years) is higher compared to the criterion of 40 years reported in laboratory studies assessing age-dependent thermoregulatory deficitsCitation19,Citation52 as well as somewhat lower compared to the rise in excess deaths observed in individuals older than 60,Citation53 65,Citation54,Citation55 70,Citation56 or 75Citation57,Citation58 years during heat waves in epidemiological studies. However, it is important to note that the age groups/categories in previous studies were created by the investigators based on logic and/or theory. In contrast, the ROC curve analysis adopted in the current study is data-driven, allowing for the detection of the true demarcation point based on the obtained results.
It is important to note the clear effects of sex and cardiorespiratory fitness on the body's capacity to dissipate heat. Older females have a greater physiological impairment in sweat secretion relative to their male counterpartsCitation15 which is the reason for females in our study being assigned lower heat loads compared to the males. Consequently, we urge health professionals and industry managers to consider separate criteria, especially considering the important physiological and morphological differences between sexes.Citation15 On the other hand, cardiorespiratory fitness typically declines with age, thereby placing older adults at greater risk for SHS.Citation16 It is important to note, however, that our study included primarily physically active individuals without chronic disease. Thus, our criteria require further validation to be used for more vulnerable populations including sedentary adults and patients with chronic diseases such as hypertension and type 2 diabetes.Citation59 Moreover, the air flow inside the direct calorimeter ensured all secreted sweat to be evaporated. Therefore, the proposed criteria may be less accurate for scenarios where the environment is characterized by very high humidity combined with very low air movement and/or individuals are wearing protective clothing that restricts the body's evaporative capacity. Finally, the heat acclimatization status of the participants was not recorded. While the measurements were equally distributed in the cold (November-March) and the warm part of the year (April-September), we were unable to include acclimatization as a factor in our analysis and this may have affected our data interpretation.
In conclusion, we identified and validated sex-specific simple and practical screening criteria for SHS during work and leisure activities in hot environments in individuals aged 31–70 years. These guidelines are based on a set of robust risk factors that have been rigorously studied during the past three decades and, now for the first time, are used as simple and effective means for detecting the vast majority of people who are less able to work or play in hot environments owing to their reduced capacity to dissipate heat. Therefore, the proposed criteria can play an important role in preventing and mitigating the public health risks caused by increased ambient temperatures.
Abbreviations
| BMI | = | body mass index |
| BSA | = | body surface area |
| DOR | = | diagnostic odds ratio |
| OLDER | = | study participants aged 31–70 years |
| PeSI | = | perceptual heat strain index |
| PSI | = | physiological heat strain index |
| ROC | = | Receiver Operating Characteristic |
| SHS | = | susceptibility to heat stress |
| SHS+ | = | positive diagnosis for SHS |
| SHS- | = | negative diagnosis for SHS |
| = | peak oxygen uptake | |
| YOUNG | = | study participants aged 19–30 years |
Disclosure of potential conflicts of interest
No potential conflicts of interest were disclosed.
Supplemental Material
Download PDF (597.5 KB)Acknowledgments
The authors would like to thank all volunteers for their time dedicated to the study along with Ms. Joanie Larose, Dr. Jill Stapleton as well as all previous and current members of the Human and Environmental Physiology Research Unit involved with this study.
Supplemental Material
Supplemental data for this article can be accessed here.
Additional information
Funding
Related Research Data
References
- Nybo L, Kjellstrom T, Bogataj LK, Flouris AD. Global heating: Attention is not enough; we need acute and appropriate actions. Temperature. 2017;4(3):199–201. doi:10.1080/23328940.2017.1338930
- World Health Organization. Quantitative risk assessment of the effects of climate change on selected causes of death, 2030s and 2050s. Geneva (Switzerland): World Health Organization; 2014.
- Kjellstrom T, Lemke B, Otto M, Hyatt O, Briggs D, Freyberg C. Threats to occupational health, labor productivity and the economy from increasing heat during climate change: An emerging global health risk and a challenge to sustainable development and social equity. Mapua (New Zealand): Health and Environment International Trust; 2014.
- Watts N, Adger WN, Agnolucci P, Blackstock J, Byass P, Cai W, Chaytor S, Colbourn T, Collins M, Cooper A, et al. Health and climate change: Policy responses to protect public health. Lancet. 2015;386(10006):1861–1914. doi:10.1016/S0140-6736(15)60854-6. PMID:26111439.
- de Freitas CR, Grigorieva EA. A comprehensive catalogue and classification of human thermal climate indices. Int J Biometeorol. 2015;59(1):109–20. doi:10.1007/s00484-014-0819-3. PMID:24682541
- Budd GM. Wet-bulb globe temperature (WBGT)–its history and its limitations. J Sci Med Sport. 2008;11(1):20–32. doi:10.1016/j.jsams.2007.07.003. PMID:17765661
- d'Ambrosio Alfano FR, Palella BI, Riccio G. Thermal environment assessment reliability using temperature-humidity indices. Ind Health. 2011;49(1):95–106. doi:10.2486/indhealth.MS1097. PMID:20823629
- D'Ambrosio Alfano FR, Palella BI, Riccio G. On the problems related to natural wet bulb temperature indirect evaluation for the assessment of hot thermal environments by means of WBGT. Ann Occup Hyg. 2012;56(9):1063–79. doi:10.1093/annhyg/mes036. PMID:22805751
- Meade RD, Poirier MP, Flouris AD, Hardcastle SG, Kenny GP. Do the threshold limit values for work in hot conditions adequately protect workers? Med Sci Sports Exerc. 2016;48(6):1187–96. doi:10.1249/MSS.0000000000000886. PMID:26938043
- Ramsey JD, Chai CP. Inherent variability in heat-stress decision rules. Ergonomics. 1983;26(5):495–504. doi:10.1080/00140138308963365. PMID:6873059
- Lamarche DT, Meade RD, D'Souza AW, Flouris AD, Hardcastle SG, Sigal RJ, Boulay P, Kenny GP. The recommended threshold limit values for heat exposure fail to maintain body core temperature within safe limits in older working adults. J Occup Environ Hyg. 2017;14(9):703–11. doi:10.1080/15459624.2017.1321844
- Yaglou CP, Minard D. Control of heat casualties at military training centers. AMA Arch Ind Health. 1957;16(4):302–16. PMID:13457450
- Cook EL. Epidemiological approach to heat trauma. Mil Med. 1955;116(5):317–22. PMID:14369740
- Schickele E. Environment and fatal heat stroke; an analysis of 157 cases occurring in the Army in the U.S. during World War II. Mil Surg. 1947;100(3):235–56. PMID:20287512
- Gagnon D, Kenny GP. Sex modulates whole-body sudomotor thermosensitivity during exercise. J Physiol. 2011;589(Pt 24):6205–17. doi:10.1113/jphysiol.2011.219220. PMID:22005684
- Stapleton JM, Poirier MP, Flouris AD, Boulay P, Sigal RJ, Malcolm J, Kenny GP. At what level of heat load are age-related impairments in the ability to dissipate heat evident in females? PLoS One. 2015;10(3):e0119079. doi:10.1371/journal.pone.0119079. PMID:25790024
- Dervis S, Coombs GB, Chaseling GK, Filingeri D, Smoljanic J, Jay O. A comparison of thermoregulatory responses to exercise between mass-matched groups with large differences in body fat. J Appl Physiol (1985). 2016;120(6):615–23. doi:10.1152/japplphysiol.00906.2015. PMID:26702025
- Stapleton JM, Poirier MP, Flouris AD, Boulay P, Sigal RJ, Malcolm J, Kenny GP. Aging impairs heat loss, but when does it matter? J Appl Physiol (1985). 2015;118(3):299–309. doi:10.1152/japplphysiol.00722.2014. PMID:25505030
- Larose J, Wright HE, Stapleton J, Sigal RJ, Boulay P, Hardcastle S, Kenny GP. Whole body heat loss is reduced in older males during short bouts of intermittent exercise. Am J Physiol Regul Integr Comp Physiol. 2013;305(6):R619–29. doi:10.1152/ajpregu.00157.2013. PMID:23883671
- Faul F, Erdfelder E, Lang AG, Buchner A. G*Power 3: A flexible statistical power analysis program for the social, behavioral, and biomedical sciences. Behav Res Methods. 2007;39(2):175–91. doi:10.3758/BF03193146. PMID:17695343
- Kohl HW, Blair SN, Paffenbarger RS, Jr., Macera CA, Kronenfeld JJ. A mail survey of physical activity habits as related to measured physical fitness. Am J Epidemiol. 1988;127(6):1228–39. doi:10.1093/oxfordjournals.aje.a114915. PMID:3369421
- Altman DG, Bland JM. Statistics notes. Treatment allocation in controlled trials: Why randomise? BMJ. 1999;318(7192):1209. doi:10.1136/bmj.318.7192.1209. PMID:10221955
- Sawka MN, Burke LM, Eichner ER, Maughan RJ, Montain SJ, Stachenfeld NS. American College of Sports Medicine position stand. Exercise and fluid replacement. Med Sci Sports Exerc. 2007;39(2):377–90. PMID:17277604
- Reardon FD, Leppik KE, Wegmann R, Webb P, Ducharme MB, Kenny GP. The Snellen human calorimeter revisited, re-engineered and upgraded: Design and performance characteristics. Med Biol Eng Comput. 2006;44(8):721–8. doi:10.1007/s11517-006-0086-5. PMID:16937214
- ACGIH. Heat stress and strain: TLV physical agents documentation. Cincinatti: American Conference of Governmental Industrial Hygienists; 2007.
- McArdle WD, Katch FI, Katch VL. Exercise physiology: Energy, nutrition, and human performance. 5th ed. Philadelphia: Lippincott Williams and Wilkins; 2001.
- Vaz M, Karaolis N, Draper A, Shetty P. A compilation of energy costs of physical activities. Public Health Nutr. 2005;8(7A):1153–83. doi:10.1079/PHN2005802. PMID:16277826
- Meade RD, Lauzon M, Poirier MP, Flouris AD, Kenny GP. An evaluation of the physiological strain experienced by electrical utility workers in North America. J Occup Environ Hyg. 2015;12(10):708–20. PMID:25955403
- DuBois D, DuBois EF. A formula to estimate the approximate surface area if height and weight be known. Arch Intern Med. 1916;17:863–71. doi:10.1001/archinte.1916.00080130010002.
- Siri WE. Body composition from fluid spaces and density: Analysis of methods. 1961. Nutrition. 1993;9(5):480–91; discussion, 92. PMID:8286893
- McGinn R, Carter MR, Barrera-Ramirez J, Sigal RJ, Flouris AD, Kenny GP. Does type 1 diabetes alter post-exercise thermoregulatory and cardiovascular function in young adults? Scand J Med Sci Sports. 2015;25(5):e504–14. PMID:25487370
- Flouris AD, Schlader ZJ. Human behavioral thermoregulation during exercise in the heat. Scand J Med Sci Sports. 2015;25(Suppl 1):52–64. doi:10.1111/sms.12349. PMID:25943656
- Flouris AD, Kenny GP. Heat remains unaccounted for in thermal physiology and climate change research. F1000Res. 2017;6:221. doi:10.12688/f1000research.10554.2 10.12688/f1000research.10554.1. PMID:28357050
- Borg G. Perceived exertion as an indicator of somatic stress. Scand J Rehabil Med. 1970;2(2):92–8. PMID:5523831
- Gagge AP, Stolwijk JA, Hardy JD. Comfort and thermal sensations and associated physiological responses at various ambient temperatures. Environ Res. 1967;1(1):1–20. doi:10.1016/0013-9351(67)90002-3. PMID:5614624
- Tikuisis P, McLellan TM, Selkirk G. Perceptual versus physiological heat strain during exercise-heat stress. Med Sci Sports Exerc. 2002;34(9):1454–61. doi:10.1097/00005768-200209000-00009. PMID:12218738
- Kenny GP, Jay O. Thermometry, calorimetry, and mean body temperature during heat stress. Compr Physiol. 2013;3(4):1689–719. doi:10.1002/cphy.c130011. PMID:24265242
- Moran DS, Shitzer A, Pandolf KB. A physiological strain index to evaluate heat stress. Am J Physiol. 1998;275(1 Pt 2):R129–34. PMID:9688970
- ASHRAE. Thermal comfort. ASHRAE handbook of fundamentals. Atlanta (USA): Chapter 8. American Society of Heating, Refrigerating and Air-Conditioning Engineers; 1997.
- Monteiro A, Carvalho V, Oliveira T, Sousa C. Excess mortality and morbidity during the July 2006 heat wave in Porto, Portugal. Int J Biometeorol. 2013;57(1):155–67. doi:10.1007/s00484-012-0543-9. PMID:22547142
- Stapleton JM, Larose J, Simpson C, Flouris AD, Sigal RJ, Kenny GP. Do older adults experience greater thermal strain during heat waves? Appl Physiol Nutr Metab. 2014;39(3):292–8. doi:10.1139/apnm-2013-0317. PMID:24552369
- Fouillet A, Rey G, Laurent F, Pavillon G, Bellec S, Guihenneuc-Jouyaux C, Clavel J, Jougla E, Hemon D. Excess mortality related to the August 2003 heat wave in France. Int Arch Occup Environ Health. 2006;80(1):16–24. doi:10.1007/s00420-006-0089-4. PMID:16523319
- Rey G, Jougla E, Fouillet A, Pavillon G, Bessemoulin P, Frayssinet P, Clavel J, Hemon D. The impact of major heat waves on all-cause and cause-specific mortality in France from 1971 to 2003. Int Arch Occup Environ Health. 2007;80(7):615–26. doi:10.1007/s00420-007-0173-4. PMID:17468879
- Glas AS, Lijmer JG, Prins MH, Bonsel GJ, Bossuyt PM. The diagnostic odds ratio: A single indicator of test performance. J Clin Epidemiol. 2003;56(11):1129–35. doi:10.1016/S0895-4356(03)00177-X. PMID:14615004
- Ioannou LG, Tsoutsoubi L, Samoutis G, Kajfež-Bogataj L, Kenny GP, Nybo L, Kjellstrom T, Flouris AD. Time-motion analyses as a novel approach for evaluating the impact of environmental heat exposure on labor loss in agriculture workers. Temperature (Austin). 2017;4(3):330–40. doi:10.1080/23328940.2017.1338210.
- Kenny GP, Groeller H, McGinn R, Flouris AD. Age, human performance, and physical employment standards. Appl Physiol Nutr Metab. 2016;41(6 Suppl 2):S92–S107. doi:10.1139/apnm-2015-0483. PMID:27277571
- Kenny GP, Larose J, Boulay P, Hardcastle SG, Sigal RJ, Miller S, Wright HE. Older adults have a reduced capacity to dissipate heat during physical activity in the heat. Appl Physiol Nutr Metab. 2012;37(Sl):S19.
- Carrillo AE, Flouris AD, Herry CL, Poirier MP, Boulay P, Dervis S, Friesen BJ, Malcolm J, Sigal RJ, Seely AJ, et al. Heart rate variability during high heat stress: A comparison between young and older adults with and without Type 2 diabetes. Am J Physiol Regul Integr Comp Physiol. 2016;311(4):R669–R75. doi:10.1152/ajpregu.00176.2016. PMID:27511279
- Kenny GP, Poirier MP, Metsios GS, Boulay P, Dervis S, Friesen BJ, Malcolm J, Sigal RJ, Seely AJ, Flouris AD. Hyperthermia and cardiovascular strain during an extreme heat exposure in young versus older adults. Temperature (Austin). 2017;4(1):79–88. doi:10.1080/23328940.2016.1230171. PMID:28349096
- Kenny GP, Yardley J, Brown C, Sigal RJ, Jay O. Heat stress in older individuals and patients with common chronic diseases. CMAJ. 2010;182(10):1053–60. doi:10.1503/cmaj.081050. PMID:19703915
- Kenney WL, Craighead DH, Alexander LM. Heat waves, aging, and human cardiovascular health. Med Sci Sports Exerc. 2014;46(10):1891–9. doi:10.1249/MSS.0000000000000325. PMID:24598696
- Larose J, Boulay P, Sigal RJ, Wright HE, Kenny GP. Age-related decrements in heat dissipation during physical activity occur as early as the age of 40. PLoS One. 2013;8(12):e83148. doi:10.1371/journal.pone.0083148. PMID:24349447
- Applegate WB, Runyan JW, Jr., Brasfield L, Williams ML, Konigsberg C, Fouche C. Analysis of the 1980 heat wave in Memphis. J Am Geriatr Soc. 1981;29(8):337–42. doi:10.1111/j.1532-5415.1981.tb01238.x. PMID:7264123
- Macfarlane A. Daily mortality and environment in English conurbations. II. Deaths during summer hot spells in greater London. Environ Res. 1978;15(3):332–41. doi:10.1016/0013-9351(78)90115-9. PMID:679897
- Saez M, Sunyer J, Castellsague J, Murillo C, Anto JM. Relationship between weather temperature and mortality: A time series analysis approach in Barcelona. Int J Epidemiol. 1995;24(3):576–82. doi:10.1093/ije/24.3.576. PMID:7672899
- Ballester F, Corella D, Perez-Hoyos S, Saez M, Hervas A. Mortality as a function of temperature. A study in Valencia, Spain, 1991–1993. Int J Epidemiol. 1997;26(3):551–61. doi:10.1093/ije/26.3.551. PMID:9222780
- Empereur-Bissonnet P. Health impacts of the 2003 heat-wave in France. Extreme weather and climatic events and public health responses EUR/04/5036 794. Geneva: World Health Organization, Regional Office for Europe; 2004. p. 21–2.
- Conti S, Meli P, Minelli G, Solimini R, Toccaceli V, Vichi M, Beltrano C, Perini L. Epidemiologic study of mortality during the Summer 2003 heat wave in Italy. Environ Res. 2005;98(3):390–9. doi:10.1016/j.envres.2004.10.009. PMID:15910795
- Kenny GP, Sigal RJ, McGinn R. Body temperature regulation in diabetes. Temperature (Austin). 2016;3(1):119–45. doi:10.1080/23328940.2015.1131506. PMID:27227101