
 ?Mathematical formulae have been encoded as MathML and are displayed in this HTML version using MathJax in order to improve their display. Uncheck the box to turn MathJax off. This feature requires Javascript. Click on a formula to zoom.
ABSTRACT
Exercising in a hot and humid environment increases core body temperature, which may limit exercise performance. The risk of exercise-induced hyperthermia and associated performance decrement in Olympic sailing athletes is largely unknown. Therefore, this study aimed to compare thermoregulatory responses and performance indicators of elite sailors in a cool versus hot and humid environment. Seven elite athletes from four different Olympic sailing classes (Laser, RS:X, Finn, 470) performed cycling and/or rowing exercise in a cool (18°C) and hot (33°C) environment, while core body temperature (TC), skin temperature (TSK), exercise performance (covered distance), and rating of perceived exertion were measured continuously. TC increased significantly more in the hot environment (37.6 ± 0.2°C to 39.1 ± 0.1°C) compared to the cool environment (37.5 ± 0.1°C to 38.5 ± 0.2°C; p = 0.002), but the increase in TC between conditions differed substantially within individuals (range: 0.3°C – 0.9°C). Exercise performance decreased by 6.2 ± 2.9% in the hot environment (p = 0.013, range: 2.3%–9.5%), but more importantly, exercise performance was strongly inversely related to peak TC (R = −0.78, p = 0.039). Rating of perceived exertion (cool: 14.2 ± 0.6; hot: 13.9 ± 1.2) and increase in TSK (cool: 0.5 ± 1.0°C; hot: 0.9 ± 0.3°C) did not differ between conditions (p = 0.59 and p = 0.36, respectively). To conclude, a larger increase in TC and substantial exercise performance decrement were observed in the hot versus cool environment. As a further matter, large inter-individual differences were observed across athletes with an inverse relationship between TC and exercise performance, which stresses the importance of appropriate and personalized interventions to reduce thermoregulatory burden of elite sailors during exercise in the heat.
Introduction
Exercise increases the thermoregulatory burden, which is associated with an increased metabolic heat production and activation of heat loss mechanisms [Citation1]. The thermal load for sailing athletes depends on wind currents, solar radiation, humidity, and ambient/water temperatures during the race [Citation2]. Furthermore, sailors wear a wetsuit and/or lycra shirt to protect them from cold exposure due to the water and wind(chill), but also provides sun protection. Since sailing tournaments are often held in hot and humid environments, the heat dissipation could be limited and the wetsuit further attenuates heat dissipating mechanisms. This might result in uncompensable heat stress [Citation3–Citation6], which is likely to negatively impact exercise performance of sailing athletes [Citation7,Citation8].
Little is known about the thermoregulatory burden of sailing. Neville et al. showed that well acclimatized elite sailors participating in the 2007 America’s Cup (32°C, 52% relative humidity (RH) and 5 m/s wind speed) experienced great thermal strain during sailing, evidenced by substantial elevations in heart rate (HR), TC, and sweat production [Citation9]. Moreover, the HR and TC were higher during downwind sailing compared to upwind sailing. In parallel, a higher HR was found for downwind compared to upwind sailing during competitive Olympic Boardsailing (RS:X) [Citation10–Citation13]. In contrast, downwind sailing is less physically demanding (72 ± 13% of maximal heart rate (HRMAX)) for Laser class sailors compared to upwind sailing (78 ± 12% of HRMAX) [Citation14]. These observations emphasized that more insight in thermoregulatory responses of sailing athletes is needed to make class- and race-specific recommendations.
The aim of this pilot study was to compare the thermoregulatory responses of elite sailing athletes in a cool (18°C) versus hot and humid environment (33°C). We hypothesized a greater thermal strain and performance decrement in a hot environment compared to a cool environment with similar thermoregulatory responses across athletes.
Methods
Subjects
A total of seven elite sailing athletes (3 males and 4 females, 21–28 years, height: 174 ± 11 cm, weight: 72.5 ± 11.9 kg, BMI: 23.9 ± 2.0 kg/m2, HRMAX: 193 ± 6 bpm) from four different Olympic sailing classes (Laser, 470, Finn, RS:X) volunteered to participate in this study. We included one male and one female Laser sailor, two female 470 sailors, one male Finn sailor, one male and one female RS:X sailor. Menstrual phase and the use of contraceptive pills from our female athletes were not reported. All athletes gave written informed consent prior participation, whereas all study procedures were performed in line with the Declaration of Helsinki.
Study design
A cross-over study was performed in which each athlete exercised in both a cool and hot environment, in counterbalanced order. The cool environment replicates a mild to moderate weather condition, with an ambient temperature (TAMBIENT) of 18°C and a relative humidity (RH) of 55%. In the hot environment, we simulated the expected conditions of Tokyo during the Olympic Games (TAMBIENT = 33°C and RH = 77%), using a climate chamber (b-Cat High Altitude, Tiel, The Netherlands). Furthermore, an electric fan (Koenic KFF 400-M, Imtron GmbH, Ingolstadt, Germany) was placed at a distance of 1.5 m from the athletes to replicate an air velocity of 2.1m/s.
Both exercise tests were separated by at least 3 days, and were scheduled at the same time of the day, to avoid interaction with the circadian rhythm [Citation15]. The athletes were instructed to drink at least 500 ml of water 2 to 3 hours prior to the test to ensure proper hydration as progressive dehydration is indicated in Junior Laser Class Sailing during World Championship [Citation16,Citation17]. Furthermore, intake of fluid and nutrition was not allowed from 1 hour prior to the test until the end of the protocol.
Experimental protocol
Each athlete ingested a gastrointestinal temperature capsule 3 hours prior to the test. After obtaining baseline measurements, athletes performed a standardized warming-up of 10 minutes followed by 5 minutes of rest. The standardized warming up consisted of 1 km rowing (Finn and RS:X) or 5 minutes cycling (Laser and 470) progressing towards 70 to 80% of heart rate reserve (HRR) combined with 5 minutes of ground and standing mobility exercises. Subsequently, athletes performed a class-specific test on a bicycle (Wattbike Pro, Wattbike, Nottingham, United Kingdom) and/or rowing (Indoor Rower Model D, Concept 2, Vermont, USA) ergometer. Sailing races differ largely in their course, activity (full-body/legs), duration (25–66 min.) and intensity (60–100% of HRmax) across different sailing classes. Therefore, we designed class-specific tests to quantify the thermoregulatory burden more specifically. The class-specific protocols are shown in Supplementary Table 1. The class-specific tests represented the activity, duration and intensity of each leg (upwind, reach, and downwind) of a regular sailing race. Athletes were not blinded for their cadence, resistance and HR during the test, in order to allow the athletes to adapt their cadence and resistance for each leg to maintain the proposed exercise intensity. In addition, the cadence on the cycle ergometer and drag factor on the rowing machine were standardized. After completing the class-specific protocol, the physiological measurements were continued for 10 minutes during the recovery phase.
Measurements
Performance (covered distance)
The covered distance (m) was registered every 4–6 minutes during the class-specific test.
Core body temperature (TC)
The athlete’s TC was measured continuously throughout the protocol at 10-s intervals using a validated gastrointestinal capsule (myTemp, Nijmegen, Netherlands) [Citation18,Citation19], that sends the data wirelessly to a copper-wired waistband [Citation19].
Skin temperature (TSK)
TSK of the athletes was measured at 20-s intervals throughout the protocol using validated wireless temperature recorders (iButton DS1922L, Dallas Semiconductor Corp, USA) [Citation20]. TSK was measured in agreement with the International Standard Ergonomics (Standard I.S.O. 9886, 2004) using a 4-points measuring site consisting of left hand, right shin, right scapula, and neck [Citation21]. The weighted average TSK is measured according to the formula:
Heart Rate (HR). Polar RS:800 CX (Polar Electro Oy, Kempele, Finland) was used to monitor HR continuously throughout the protocol at 15-s intervals. HR had to be fixed according to the class-specific protocols (Supplementary Table 1). Furthermore, HR was standardized by using the percentage of HRR calculated with the Karvonen Formula [Citation22]. Resting and maximal HR, used for the calculation of HRR were based on a routinely performed incremental exercise test within 6 months prior study participation.
Body weight
Body weight was measured (Satex SA250,Weegtechniek Holland b.v., Zeewolde, the Netherlands) on baseline and after the class-specific test. The relative change in body weight was used to determine the level of dehydration and weight loss after the class-specific test. The athletes’ body weight included the weight of the iButtons and waist- and chest band for TC and HR, but without shirt and shoes.
Perceived exertion, thermal comfort and thermal sensation
The rating of perceived exertion (RPE), thermal comfort and thermal sensation were registered simultaneously every 4 to 6 minutes throughout the protocol. The RPE quantitatively measures the perceived exertion using the Borg categorical scale ranging from 6 to 20, in which 6 indicated “no exertion” and 20 indicates ”maximal exertion” [Citation23]. The 4-point Comfort Scale (1 very uncomfortable; 4 very comfortable) indicates how comfortable the athlete feels about the temperature [Citation24], while the 7-point ASHRAE scale for thermal sensation ranges from −3 (cold) to +3 (hot) and indicates to what extent the athlete experienced the ambient temperature [Citation24].
Data analysis
All statistical analyses were performed by using the Statistical Package for the Social Sciences software (ISPSS v22.0, IBM Corp., Armonk, USA), with the level of significance defined as p ≤ 0.05. Data was reported as mean ± standard deviation, unless indicated otherwise. Normality distribution was examined using a Shapiro-Wilk Test, if necessary with log transformation. To compare conditions, parameters were analysed with a Paired-Sample T-Test. The interpretation of the effect size (ES, Cohen’s d) was based on the following scale: negligible effect = 0–0.19, small effect = 0.20–0.49, moderate effect = 0.50–0.79 and large effect≥ 0.80). Wilcoxon Signed-Rank Test was applied to indicate differences in thermal sensation as normal distribution could not be obtained Repeated measures ANOVA is used to evaluate the change over time in TC between conditions. Finally, Pearson’s correlation analysis was used to assess the association between performance and TC responses in the heat.
Results
Environmental characteristics
All seven athletes successfully completed the class-specific tests in a cool (18.4 ± 2.1°C and 55.6 ± 4.1% RH) and hot environment (32.8 ± 0.9°C and 79.6 ± 1.7% RH).
Heart rate and perceived exertion
The average HR was 162 ± 3 bpm in the cool environment and 164 ± 4 bpm in the hot environment, and did not differ between conditions (p = 0.055, ES = 0.90, ). Furthermore, no difference in RPE was observed between conditions (cool: 14.2 ± 0.6, hot: 13.9 ± 1.2, p = 0.59, ES = 0.21).
Table 1. Heart rate, exercise performance, core body temperature, skin temperature, heat gradient, subjective parameters and body weight in both environmental conditions (mean ± SD; median (25–75 percentiles)).
Exercise performance
The total covered distance was significantly lower in the hot environment (23.1 ± 12.9 km) compared to the cool environment (24.9 ± 14.2 km, p = 0.013, ES = 1.32, ). More specifically, exercise performance reduced with 6.2 ± 2.9% in the hot compared to the cool environment, ranging from 2.3% (RS:X – Men) to 9.5% (Laser – Women).
Core body temperature
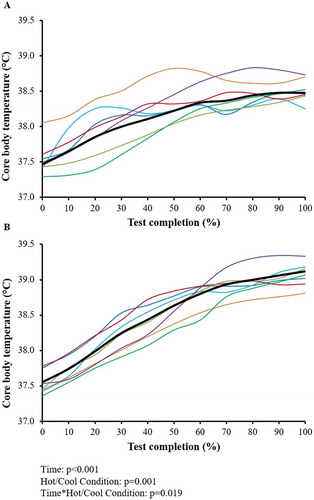
Baseline TC was comparable between the cool (37.0 ± 0.3⁰C) and hot environment (37.1 ± 0.2°C, p = 0.34, ES = 0.43, ). During the class-specific test, a larger increase in TC was observed in the hot versus cool environment (1.6 ± 0.3°C versus 1.0 ± 0.2°C, p = 0.002, ES = 2.50, ). The increase in TC in hot compared to cool environment differed substantially between individuals, ranging from 0.3°C for Laser (Women) to 0.9°C for Laser (Men). Furthermore, maximal TC during the class-specific test was higher in the hot (39.2 ± 0.2°C) compared to the cool environment (38.5 ± 0.1°C, p = 0.001, ES = 3.13), and differed between conditions from 0.0°C to + 1.0°C within individuals. An overview of TC during the class-specific test is shown in for all athletes in the hot and cool condition. Changes in TC were significantly different over time between the hot and cool condition (p = 0.019).
Figure 1. Core body temperature (a), skin temperature (b), and heat gradient (c) in cool (white bars) and hot environment (grey bars) at specific measurement points: baseline, start of class-specific test, finish of class-specific test and after 10 minutes of recovery. Error bars represented standard deviations, significance assumed at p < 0.05.
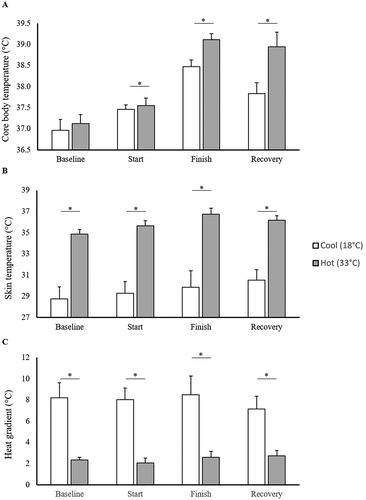
Figure 2. Core body temperature during the class-specific test in the cool environment (a) and hot environment (b) for all seven athletes. The black bolded line represents the average TC over time. Each coloured line represents an athlete, as follows: ![]()
Exercise performance versus core body temperature
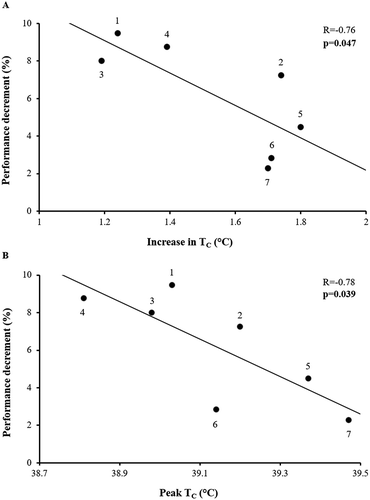
A correlation of −0.76 was found between exercise performance decrement and increase in TC in the heat (p = 0.047), and a correlation of −0.78 between exercise performance decrement and maximal TC in the heat (p = 0.039, ).
Figure 3. Correlations between decrement in performance (%), and increase in core body temperature (a) and maximal TC (b) in the hot environment. Pearson correlation coefficient with significance level at p < 0.05. Each bullet represents an athlete, as follows: 1) Laser – Women, 2) Laser – Men, 3) 470 Crew – Women, 4) 470 Helm – Women, 5) Finn – Men, 6) RS:X – Women, 7) RS:X – Men.
Skin temperature
Baseline TSK was lower in the cool environment compared to the hot environment (28.7 ± 1.1°C versus 34.9 ± 0.4°C, p < 0.001, ES = 4.94, ). During the class-specific test, TSK increased 0.9 ± 0.3°C in the hot environment and 0.5 ± 1.0°C in the cool environment, which was not different (p = 0.36, ES = 0.41, ). Nevertheless, maximal TSK was significantly higher in the hot versus cool environment (36.7 ± 0.3°C versus 31.2 ± 1.2°C, p < 0.001, ES = 6.28), with a 4.3°C to 6.6°C higher maximal TSK in the heat.
Heat gradient (TC – TSK)
Baseline TC to TSK gradient was 8.2 ± 1.4°C in the cool environment and 2.3 ± 0.2°C in the hot environment (p = 0.001, ES = 3.96, ), which did not change during the class-specific test (p = 0.89, ES = 0.07, ).
Other outcome parameters
The relative loss of body mass during the class-specific test was lower in the cool environment (0.7 ± 0.4%) compared to the hot environment (1.1 ± 0.2%, p < 0.001, ES = 2.85, ). Furthermore, the class-specific tests were indicated as “comfortable” (2.7 ± 0.3) and “warm” (1.7; 0.2–1.8) in the cool environment, and “uncomfortable” (1.8 ± 0.4) and “hot” (2.7; 2.7–2.9) in the hot environment (p = 0.001 & ES = 2.26, p = 0.018, respectively).
Discussion
The aim of our study was to compare the thermoregulatory responses of elite sailing athletes during class-specific tests in both a cool and hot environment to indicate their thermoregulatory burden. Our hypothesis that thermal strain and performance decrement would be higher in a hot environment compared to a cool environment, is confirmed. More importantly, exercise performance was reduced with 6.2% in the hot versus cool environment, which was inversely related to the increase and maximal TC in the hot environment. Furthermore, body weight loss, thermal discomfort and thermal stress were elevated in a hot versus cool environment.
To our knowledge, this is the first study that determined thermoregulatory responses in athletes of Olympic sailing classes in both a cool and hot environment. Neville and colleagues found a maximal TC of 38.4°C in well acclimatized sailing athletes participating in the America’s Cup yacht racing (TAMBIENT: 32°C, 52% RH and 5 m/s wind speed [Citation9],). In comparison, a higher peak TC of 39.2°C is found in our laboratory study with athletes of Olympic sailing classes. Former studies not only found a greater and faster increase in TC when exercising in a hotter environment [Citation9], but also observed that the athletes’ performances are reduced when TC rises above 39°C [Citation9,Citation25]. Nonetheless, an important finding of our study is that higher and greater TC responses are found with a decline in the performance of elite sailing athletes when exercising in the heat.
Interestingly, we see different effects of the heat on TC and performance when comparing individual responses indicating the importance of personalized interventions to reduce thermoregulatory burden in elite sailors during exercise in the heat (). For instance, athletes from RS:X class (high intensity exercise) show a large increase in TC, while they were well able to maintain performance compared to the other sailing classes. In contrast, most sailing athletes performing endurance exercise (i.e. Laser and 470 classes) show a limited increase in TC, but a high performance decrement in the heat. Both Casadio and Corbett demonstrated the presence of inter-individual variation in the adaptive response to heat acclimation [Citation26,Citation27]. Furthermore, the thermophysiological responses to exercise in the heat was not related with baseline maximal VO2 or previous exposure to a heat acclimation intervention [Citation27]. As differences in general fitness and heat acclimation might not play a role, our findings could suggest that intrinsic factors (i.e. heat tolerance, sweat threshold, sweating efficiency) determine whether an athlete preserves thermoregulation or performance when exercising in a hot environment. Another explanation for this inverse relation can be that high intensity exercise and endurance exercise might result in a different response of the body while exercising in a hot environment. Overall, preserved performance is as importance as preserved thermoregulation for elite athletes as they are at risk of developing exertional hyperthermia when thermoregulation is not maintained which eventually results in heat related illnesses and limited performances. A reasonable risk on heat-related illnesses has been indicated in our study as most athletes felt lightheaded and/or dizzy after the class-specific test in the heat. This is important as we also found a slower decrease (or even an increase) in heart rate and TC during recovery in the hot versus cool environment. The lack of ability to recover after exercise is of importance for all sailing athletes, as most tournaments for Olympic sailing classes consists of multiple races on each day with less than 30 minutes of rest in between.
It is important to note that athletes not only deal with different activities on different intensities during upwind and downwind sailing, but also with different environmental conditions indicated by the direction of the waves and apparent wind speed (AWS; i.e. the wind speed on the boat) [Citation28]. As reported previously, sailing upwind into the waves comes with greater AWS than sailing downwind with the waves and produces a continuous spray of water on the body in some conditions [Citation9]. As a result, evaporative and convective cooling is promoted during upwind sailing resulting in feeling colder and being wet [Citation9]. Therefore, the experienced thermal comfort and thermal sensation of our study may not be indicative for actual upwind sailing. As no cooling is promoted by sailing downwind, it is likely that these legs will still be experienced as “hot and uncomfortable”. Furthermore, it is important to stay cool as cooling strategies aim to attenuate the increase in TC in order to enhance exercise performance and lower the risk of heat-related illnesses [Citation9]. We recently reported an overview of cooling strategies for athletes, indicating cold continuous sprays of water and wind on the body as effective cooling strategy during exercise [Citation29]. From a mental point of view, cooling might also preserve the performances as less thermal stress and thermal discomfort tends to improve the athletes’ performances [Citation30]. Therefore, the magnitude of different cooling strategies on the performance and thermoregulation of athletes from Olympic sailing classes should be investigated. While the increased opportunity for cooling during upwind sailing may help to dissipate the greater metabolic heat production, a greater AWS is also likely to affect the work intensity when sailing and thereby resulting in a greater thermoregulatory burden [Citation9]. To counteract these detrimental effects, Casadio and colleagues indicated that periodized heat acclimation did reduce heat strain in elite Laser sailors preparing for the 2013 World Championships [Citation26].
Strengths and limitations
A cross-over study is a strong methodological approach to analyse the thermoregulatory responses of Olympic sailing to heat in which the cool environment can be seen as the control condition for the hot environment. Furthermore, the tests mimic the class-specific performances of on-water races with a certainty, resulting in a reliable athlete-specific indication of their thermoregulatory burden. However, there are some limitations that should be taken into account. A limitation of our study is that it can be seen as a laboratory setting where sailing is replaced by biking and/or rowing, which is an incomplete reflection of the actual thermoregulatory burden. Although environmental stressors such as solar radiation and changing air velocities are lacking and intensities are fixed [Citation31,Citation32], a former study showed that identical associations between a hotter environment and a greater thermal strain can be found in competitive environments [Citation25]. Furthermore, female athletes’ menstrual phase can affect thermophysiological responses [Citation33]. Nevertheless, resting TC was comparable between both measurements in female study population (37.0 ± 0.5°C versus 37.3 ± 0.3°C), suggesting they were in the same phase of the menstrual cycle. Overall, within our study the primary outcome parameters are not likely to be sensitive for bias as all athletes perform the class-specific test in both conditions and clear results were obtained despite the relatively small sample size.
Conclusion
Elite sailing athletes demonstrate higher peak core body temperatures in a hot compared to cool environment resulting in a performance loss of 6.2% and thermal discomfort. More importantly, substantial variation in physiological responses were observed between athletes, suggesting that personalized interventions should be implemented to counteract the detrimental effects of exercise in the heat. As elite sailing athletes have to perform multiple races on a day during international tournaments, they may also be at risk of developing exertional hyperthermia (TC ≥ 40) in the heat. Future studies should focus on: I) on-water measurements in competitive settings in the heat to determine actual thermoregulatory burden of sailing, and II) the benefits of personalized interventions such as cooling, acclimatisation and wearing protective clothes to lower thermal strain and improve the exercise performances while sailing in the heat.
Abbreviations
| TC | = | core body temperature (gastrointestinal) |
| TSK | = | skin temperature |
| TAMBIENT | = | ambient temperature |
| HR | = | heart rate |
| HRMAX | = | maximal heart rate |
| HRR | = | heart rate reserve |
| RPE | = | rate of perceived exertion |
| RH | = | relative humidity |
| ES | = | effect size (Cohen’s d) |
Supplemental Material
Download MS Word (44.8 KB)Acknowledgments
The authors want to thank the athletes for their participation and national coach Jaap Zielhuis for his endorsement. Furthermore, we want to thank Cees van Bladel and Lenneke de Voogd for the availability of the facilities at Sailing Innovation Centre and Giorgos Charalampopoulos for his involvement in developing the class-specific protocols. This study was supported by a Sportinnovator grant (ZonMW, 2015).
Disclosure statement
No potential conflict of interest was reported by the authors.
Supplementary material
Supplemental data for this article can be accessed here.
Additional information
Funding
Related Research Data
References
- Hargreaves M. Physiological limits to exercise performance in the heat. J Sci Med Sport. 2008;11(1):66–71. PMID: 17720623.
- Bergeron MF, Bahr R, Bartsch P, et al. International Olympic Committee consensus statement on thermoregulatory and altitude challenges for high-level athletes. Br J Sports Med. 2012;46(11):770–779. PMID: 22685119.
- Armstrong LE, Johnson EC, Casa DJ, et al. The American football uniform: uncompensable heat stress and hyperthermic exhaustion. J Athl Train. 2010;45(2):117–127. PMID: 20210615; PMCID: PMCPMC2838463.
- Binkley HM, Beckett J, Casa DJ, et al. National Athletic Trainers’ Association position statement: exertional heat illnesses. J Athl Train. 2002;37(3):329–343. PMID: 12937591; PMCID: PMCPMC164365.
- Casa DJ, Armstrong LE, Ganio MS, et al. Exertional heat stroke in competitive athletes. Curr Sports Med Rep. 2005;4(6):309–317. PMID: 16282032.
- Stevenson T, Roiz de Sa D. Managing the risk of heat illness on board type 23 frigates deploying to the Arabian Gulf. J R Nav Med Serv. 2010;96(3):150–157. PMID: 21443049.
- Ely MR, Cheuvront SN, Roberts WO, et al. Impact of weather on marathon-running performance. Med Sci Sports Exerc. 2007;39(3):487–493. PMID: 17473775.
- Nybo L, Rasmussen P, Sawka MN. Performance in the heat-physiological factors of importance for hyperthermia-induced fatigue. Compr Physiol. 2014;4(2):657–689. PMID: 24715563.
- Neville V, Gant N, Folland JP. Thermoregulatory demands of elite professional America’s Cup yacht racing. Scand J Med Sci Sports. 2010;20(3):475–484. PMID: 19558386.
- Bojsen-Moller J, Larsson B, Aagaard P. Physical requirements in Olympic sailing. Eur J Sport Sci. 2015;15(3):220–227. PMID: 25232650.
- Castagna O, Vaz Pardal C, Brisswalter J. The assessment of energy demand in the new Olympic windsurf board: neilpryde RS:X. Eur J Appl Physiol. 2007;100(2):247–252. PMID: 17297627.
- Guevel A, Maisetti O, Prou E, et al. Heart rate and blood lactate responses during competitive Olympic boardsailing. J Sports Sci. 1999;17(2):135–141. PMID: 10069270.
- Vogiatzis I, De Vito G. Physiological assessment of Olympic windsurfers. Eur J Sport Sci. 2015;15(3):228–234. PMID: 24886256.
- De Vito G, Di Filippo L, Felici F, et al. Assessment of energetic cost in Laser and mistral sailors. Int J Sports Cardiology. 1996;5(2):55–59.
- Weinert D, Waterhouse J. The circadian rhythm of core temperature: effects of physical activity and aging. Physiol Behav. 2007;90(2–3):246–256. PMID: 17069866.
- Arnaoutis G, Verginadis P, Seal AD, et al. Progressive Dehydration in Junior Laser Class Sailors During World Championship. Int J Sport Nutr Exerc Metab. 2017;1–18. PMID: 29035599. DOI:10.1123/ijsnem.2017-0142
- Casa DJ, Armstrong LE, Hillman SK, et al. National athletic trainers’ association position statement: fluid replacement for athletes. J Athl Train. 2000;35(2):212–224. PMID: 16558633; Central PMCID: PMCPMC1323420.
- Bongers CCWG, Daanen HAM, Bogerd CP, et al. Validity, Reliability, and Inertia of Four Different Temperature Capsule Systems. Med Sci Sports Exerc. 2018;50(1):169–175. PMID: 28816921. DOI:10.1249/MSS.0000000000001403
- Bongers CCWG, Hopman MTE, Eijsvogels TMH. Validity and reliability of the myTemp ingestible temperature capsule. J Sci Med Sport. 2017;21(3):322–326. PMID: 28645495. DOI:10.1016/j.jsams.2017.06.006
- van Marken Lichtenbelt WD, Daanen HA, Wouters L, et al. Evaluation of wireless determination of skin temperature using iButtons. Physiol Behav. 2006;88(4–5):489–497. PMID: 16797616.
- Organisation IS. ISO 9886: ergonomics - evaluation of thermal strain by physiological measurements. 2004.
- Camarda SR, Tebexreni AS, Pafaro CN, et al. Comparison of maximal heart rate using the prediction equations proposed by Karvonen and Tanaka. Arq Bras Cardiol. 2008;91(5):311–314. PMID: 19142375.
- Borg GA. Psychophysical bases of perceived exertion. Med Sci Sports Exerc. 1982;14(5):377–381. PMID: 7154893.
- Gagge AP, Stolwijk JA, Hardy JD. Comfort and thermal sensations and associated physiological responses at various ambient temperatures. Environ Res. 1967;1(1):1–20. PMID: 5614624.
- Duffield R, Coutts AJ, Quinn J. Core temperature responses and match running performance during intermittent-sprint exercise competition in warm conditions. J Strength Cond Res. 2009;23(4):1238–1244. PMID: 19568033.
- Casadio JR, Kilding AE, Siegel R, et al. Periodizing heat acclimation in elite Laser sailors preparing for a world championship event in hot conditions. Temperature. 2016;3(3):437–443. PMID: 28349083; Central PMCID: PMCPMC5079264.
- Corbett J, Rendell RA, Massey HC, et al. Inter-individual variation in the adaptive response to heat acclimation. J Therm Biol. 2018;74:29–36.
- Whiting P. 32nd America’s cup: a simple guide. Chichester: Wiley; 2007.
- Bongers CCWG, Hopman MTE, Eijsvogels TMH. Cooling interventions for athletes: an overview of effectiveness, physiological mechanisms, and practical considerations. Temperature. 2017;4(1):60–78. PMID: 28349095; PMCID: PMCPMC5356217.
- Schulze E, Daanen HA, Levels K, et al. Effect of thermal state and thermal comfort on cycling performance in the heat. Int J Sports Physiol Perform. 2015;10(5):655–663. PMID: 25620399.
- Reilly T, Drust B, Gregson W. Thermoregulation in elite athletes. Curr Opin Clin Nutr Metab Care. 2006;9(6):666–671. PMID: 17053417.
- Saunders AG, Dugas JP, Tucker R, et al. The effects of different air velocities on heat storage and body temperature in humans cycling in a hot, humid environment. Acta Physiol Scand. 2005;183(3):241–255. PMID: 15743384.
- Pivarnik JM, Marichal CJ, Spillman T, et al. Menstrual cycle phase affects temperature regulation during endurance exercise. J Appl Physiol (1985). 1992;72(2):543–548. PMID: 1559930.