
 ?Mathematical formulae have been encoded as MathML and are displayed in this HTML version using MathJax in order to improve their display. Uncheck the box to turn MathJax off. This feature requires Javascript. Click on a formula to zoom.
ABSTRACT
Purpose: Produce a detailed upper-body sweat map and evaluate changes in gross and regional sweating rates (RSR) and distribution following heat acclimation (HA). Methods: Six males (25 ± 4 yrs) completed six consecutive HA days (45°C, 20% rh) requiring 90 minutes intermittent exercise to maintain a 1.4°C rectal temperature (Tre) rise. Pre- and post-HA upper-body RSR were measured at 55% (Intensity-1; I1) and 75% VO2 max (Intensity-2; I2) using a modified absorbent technique. Results: From day one to six of HA, work rate increased (n.s.), heart rate, Tre, and skin temperature were similar, and gross sweat loss (GSL) increased (P < 0.001). During pre and post-HA experiments, relative workloads were similar (Pre-I1 54 ± 3, Post-I1 57 ± 5%VO2max; Pre-I2 73 ± 4, Post-I2 76 ± 7%VO2max). Post-HA GSL was significantly higher (Pre 449 ± 90 g.m−2 h−1, Post 546 g.m−2 h−1; P < 0.01). Highest RSR were observed on the central back both pre and post-HA at I1 (pre 854 ± 269 post 1178 ± 402g.m−2 h−1) and I2 (pre 1221 ± 351 post 1772 ± 396 g.m−2 h−1). Absolute RSR increased significantly in 12 (I1) to 14 (I2) of the 17 regions. Ratio data indicated significant post-HA relative RSR redistribution, with decreased relative contributions to whole-body sweating on the back, chest staying the same and arms increasing. Conclusions: Hot-dry HA significantly increased GSL in aerobically trained males at I2. Absolute RSR significantly increased in I1 and I2, with a preferential relative redistribution towards the periphery of the upper-body.
Introduction
The ability of an individual to dissipate heat is of fundamental importance during exercise and exposure to hot environments, with evaporation of sweat being the greatest avenue of heat loss from the body [Citation1]. Physiological responses to both acute and chronic heat exposure have been well documented, with beneficial thermal and cardiovascular adaptations occurring following repeated exposure. Classic hallmarks of heat acclimation (HA) include, 1) a reduced absolute core temperature (Tcore) threshold for sweating, 2) increased sweating rate for a given absolute Tcore (gain) due to increased thermosensitivity and output per gland, 3) increased maximal sweating rate, 4) greater maximum skin wettedness, 4) increased tolerance as evidenced by a reduced heart rate, cardiac output and core temperature for a given workload, and 5) an improvement in exercise performance [Citation2–Citation10]. Whilst there is a consensus supporting these beneficial adaptations, there are discrepancies in the literature regarding the existence of regional sweating adjustments, namely peripheral relative redistribution of sweating, and linked potential alterations in cooling efficiency. Traditionally, many studies have utilized change in whole body mass to estimate whole body (gross) sweat loss throughout heat acclimation regimens. Fewer studies have examined regional sweating rate (RSR) changes, with between 1–4 small (1–4 cm2) local sweat sites typically measured and inconsistent conclusions being drawn regarding potential redistribution of sweating patterns following acclimation [Citation5,Citation11–Citation13]. This is not surprising considering the large variation in RSR both between and within body regions [Citation14–Citation19], making selection of the specific measurement site important. Measurement of a single small ‘central” and single “peripheral” site provides minimal information and limits conclusions that can be drawn, highlighting the need for detailed sweating data over a large surface area of the body to truly assess alterations in sweating rate and distribution following HA.
Most studies have observed a significant increase in both gross sweat loss (GSL) and RSRs following heat acclimation [Citation1,Citation11,Citation13,Citation20], with a primary focus on absolute sweating rates. Limited consideration has been given to sweat distribution changes, in which RSR relative to the average sweating rate over all sites measured is evaluated. Several studies have examined a small number of RSR sites and extrapolated to larger body regions, and calculated RSR as a percentage of total sweating. When considered in this manner, several studies support a central to peripheral relative redistribution [Citation13,Citation20,Citation21], whilst others reported an increase in sweating rates across the body with no shift in sweating patterns [Citation11,Citation12]. Some of this discrepancy results from difficulty in direct comparison of sweating rates between studies, owing to differing environmental conditions (hot humid vs. dry), acclimation protocols and durations, varied exercise modes and intensities, participant selection, sweat measurement techniques, and limited measurement sites being generalized to larger body regions. This approach makes a true assessment of absolute quantity and distribution shifts difficult. Our laboratory previously published detailed regional “sweating body maps” using a modified absorbent technique, covering up to 83% body surface area (SA; 1.6 m2 of 1.92 m2 total body SA in male athletes) [Citation14]. This study demonstrated that due to the large variation in sweating rates within regions, small sweat capsules may not capture what is happening across that region. Using this modified absorbent technique to produce pre and post acclimation sweat maps will allow simultaneous measurement of more sites and over a larger body surface area than is possible with capsule techniques, allowing greater insight into absolute RSRs and distribution following heat acclimation.
The primary aim of this study was to produce detailed sweating maps of the upper body, with the secondary aim of investigating alterations in regional sweating rates and distribution over multiple central (torso) and peripheral (arms) sites in young, trained male athletes following six consecutive days of “constant thermal strain” exercise-heat acclimation in a hot-dry environment (45°C, 20% rh). It was hypothesized that a significant increase in both gross sweat loss and absolute regional sweating rates would occur at all sites measured. Furthermore, it was hypothesized that the relative increase in contribution to total body sweat rate would be greater at peripheral upper body versus central sites, leading to increasing uniformity of sweat coverage.
Materials and methods
Participants
Six aerobically trained male athletes completed the HA regimen and sweat mapping experimentation (25 ± 4 years, 178.6 ± 3.8 cm, 75.12 ± 4.8 kg, 1.94 ± 0.1 m2, 12.4 ± 5.4% body fat, 64.9 ± 14.9 ml.kg−1min−1 predicted VO2max). All experimental procedures were approved by the Loughborough University Ethics Committee and conformed to the guidelines set forth by the Declaration of Helsinki. Procedures were fully explained to all participants before informed verbal and written consent were obtained and a health-screening questionnaire completed. All participants trained a minimum of 8 hours per week, were free from cardiovascular and metabolic diseases (self-reported), were not taking any medications that could conceivably alter thermoregulatory function and were not heat acclimated as determined by self-reported information confirming no exposure to heat within 3 months prior to the study.
Preliminary session
Participants attended the Environmental Ergonomics Research Center (EERC) for a preliminary session involving anthropometric measurements of height, body weight, and body dimensions used for the production of individualized absorbent pads. Skinfolds were measured at 7 sites and body fat percentage calculated based on a population specific equation for male athletes [Citation22]. was estimated from a submaximal fitness test [Citation23] based on the Åstrand-Ryhming method [Citation24] . All participants completed four, five minute (min) exercise intensities on a treadmill (h/p/cosmos mercury 4.0 h/p/cosmos sports & medical gmbh, Nussdorf-Traunstein, Germany) in thermoneutral conditions (18°C, 30%rh).
Sweat pad preparation and application
The modified absorbent technique utilized to calculate RSRs and produce body sweat maps has previously been described [Citation14,Citation15,Citation25]. Briefly, hygroscopic material (Tech Absorbents product 2164) was used to produce custom-made pads individually sized to each participant based on anthropometric measurements. All pads were individually weighed (Sartorius YACOILA, Sartorius AG, Goettingen, Germany. Precision 0.01g) inside labelled airtight bags and stored until testing. Immediately prior to testing, pads were attached to custom-sized plastic sheeting (28 pads per exercise intensity) for efficient application to the skin surface and to prevent sweat evaporation during measurement periods. Pads were maintained in contact with the skin in their appropriate positions using a custom-made, rapidly removable, long sleeve stretch t-shirt. Sweat pads were additionally placed at the base of the neck (anterior and posterior), and under the armpits to avoid sweat run down and contamination of adjacent pads. These pads were discarded and were not used in RSR calculations. Upon completion of the protocol, all pads were re-weighed, and SA calculated from the dry weight of each pad and the weight per unit of surface area of the material. RSRs were calculated in grams per meter square of body surface area per hour (g.m−2h−1) based on the weight change of the pad, the pad SA, and the duration of application to the skin. To minimize the effect of the pads on the overall thermal state of the body, sweat mapping was only conducted on the torso and arms and sample periods were limited to 5 minutes.
Body sweat mapping protocol
Body sweat mapping experiments were conducted in the EERC in a climate-controlled room maintained at 25.7 ± 0.4°C, 46.6 ± 8.0% rh, prior to and following a 6-day HA protocol (described below). Subjects were instructed to refrain from strenuous exercise and consume 20 ml.kg body weight of water within 24 hours prior to testing. Upon arrival at the laboratory, participants were provided with shorts and t-shirt before being weighed. Baseline values of heart rate (HR, Polar Electro Oy, Kempele, Finland), sublingual temperature, and body core temperature (Tcore, ingestible core temperature pill), were recorded with participants in a seated position. HR was recorded at 15 second intervals throughout the protocol, and Tcore was measured using a VitalSense® Integrated Physiological Monitoring System (Mini Mitter Co., Inc., Bend, Oregon, USA). Participants swallowed a Vitalsense® ingestible temperature pill 5 hours before testing, which wirelessly tracked and recorded Tcore up to four times per minute. Baseline skin temperature (Tsk) was recorded via Infra-red imaging (Thermacam B2, FLIR Systems Ltd., West Malling, Kent, UK) of nude, dried skin, and repeated before and after each pad application, and immediately following cessation of the exercise protocol.
Following collection of baseline data, participants completed a 60 min training run on a treadmill (1% incline) involving two exercise intensities (30 min per intensity). A target HR of 125–135 and 150–160 beats per minute (bpm) were achieved for intensity 1 (I1) and intensity 2 (I2), equating to ~55 and ~75% of VO2max, respectively. RSRs were measured for each exercise intensity via application of the customized hygroscopic pads for a period of 5 min, first after 30 (I1) and then after 60 (I2) min of the protocol, as described above. Running was resumed during the 5 min sampling periods at the respective workloads. For IR images and pad application, subjects briefly dismounted the treadmill, with a total transition time of less than 3 min. To ensure sweat collection occurred for the 5 min sample periods only, participants removed their t-shirt before thoroughly drying their skin with a towel immediately prior to pad application. Evaporation of sweat from the pads was prevented during sweat measurement due to their hygroscopic properties, their impermeable backing, and by their attachment to custom-made polyethylene sheeting necessary for their application to the body. To prevent participant dehydration during the protocol, ad libitum water consumption was permitted, and recorded for necessary adjustments of GSL. Following completion of the protocol, body weight and sublingual temperature were recorded.
Heat acclimation protocol
On arrival at the laboratory participants changed into shorts and body weight was obtained (Mettler Toledo kcc150, 150 kg, resolution 1g. Mettler Toledo, Leicester. UK.). Water bottles were labelled and weighed prior to and following testing on an electronic scale to monitor fluid consumption throughout testing, and were stored inside a cool box in the environmental chamber. Participants self-inserted a rectal thermistor (Grant Instruments, Cambridge, England) 10 cm beyond the anal sphincter for measurement of Tcore during the HA protocol. Thermistors (Grant Instruments, Cambridge, England) were attached to four skin sites (upper arm, chest, thigh and lower leg) for measurement of local Tsk and calculation of weighted mean Tsk [Citation26]. The skin and rectal thermistors were attached to an Eltek/Grant 10-bit, 1000 series squirrel data logger (Grant Instruments, Cambridge, England) for data collection. Participants were fitted with a polar heart rate monitor and watch (Polar Electro Oy, Kempele, Finland) which recorded HR at 5 second intervals. Participants were asked to sit in a thermoneutral preparation room for 15 min prior to entering the environmental chamber to obtain resting, baseline data.
Before commencing the acclimation regimen, the cycle ergometer was adjusted, and a level of resistance was established which could be maintained throughout the first exercise period, and that was sufficient to elicit a 1.4°C Tcore rise. Three 50cm diameter fans (JS Humidifiers plc, Littlehampton, UK) were mounted in a linear arrangement on a wooden frame, 1 meter in front of the bike. This enabled an equal distribution of wind over the height of the body, with an air velocity of 1.0 m.s−1. Daily calibration of air velocity was performed using a hot wire anemometer (model TSI Alnor 8455. TSI Instruments Ltd, UK. Range 0.125–50 ms-1.) at the position of the cycle ergometer seat. Tcore, Tsk, ambient temperature (Ta), relative humidity (rh) and HR were recorded at one min intervals, and manual readings recorded every five min. The HA regime was based on the Fox constant strain technique [Citation27,Citation28], involving intermittent exercise in 45°C and 20% rh (hot-dry) to achieve and maintain a 1.4°C elevation in Tcore above baseline. Participants completed a 90-min exposure involving three, 20 min bouts of submaximal cycling, interspersed with 10 min rest periods. Resistance was adjusted to achieve the desired increase in Tcore or at the request of the participant. If Tcore exceeded a 1.4°C increase from baseline or approached 39°C participants interrupted exercise and sat on the cycle ergometer to limit any further elevation, until Tcore started to drop.
Following each daily 90-min heat exposure, all equipment was removed, and participants were re-weighed wearing only their shorts. Measurements of Tcore and HR were repeated, and participants were advised they could leave the laboratory when values approached those observed pre-exposure.
Data and analysis
Gross and regional sweating data
GSL during all HA days and sweat mapping experiments was calculated based on the weight change of each semi-nude participant during testing, adjusted for fluid intake and clothing weight, and corrected for respiratory and metabolic mass losses [Citation1], based upon work described by Livingston et al [Citation29] and Kerslake ([Citation30] Pp. 121), respectively. A two-way repeated measures ANOVA was performed to analyze regional differences within each intensity, pre- and post-HA. Similarly to prior sweat mapping studies, right-left differences in RSR and changes with exercise intensity and HA were analyzed using paired samples t-tests, both with and without Bonferroni correction to evaluate the risk of Type I versus that of Type II error. Both corrected and uncorrected data are presented due to the exploratory nature of the study and the large number of regions studied [Citation31]. Due to the highly stringent nature of the Bonferroni correction, and small sample size, some regions which may be significant in studies involving a smaller number of areas, may fail to meet significance and should be considered alongside the uncorrected analysis. Sweating maps are presented using median values to present an “average sweater” versus use of mean RSR values that illustrate the “average amount of sweat produced”, the latter being more easily affected by outliers. Both values are presented to provide insight into the data distribution. One-way repeated measures ANOVAs were performed to analyze differences in all outcome variables throughout the 6 day HA protocol, and post hoc comparisons were conducted both with and without Bonferroni correction.
In addition to the absolute RSR data, individual’s RSR values were normalized for the area weighted sweating rate of all (n) zones measured to standardize RSR data over all participants, before calculating means, medians, etc.
With RSRnorm,i = normalized local sweat rate of zone i (non-dimensional; 0 = no sweat, 1 = average, 2 = double than average sweat rate over all zones)
RSRi = measured sweat rate in zone i in g.m−2.h−1
n = total number of tested zones
RSRj = regional sweat rate of zone j in g.m−2.h−1
areaj = surface area of zone j
This allows easy identification of “high” and “lower” sweat regions regardless of absolute values, and any alterations of the distribution of sweat produced and any alteration in the contribution of a certain area to whole body sweat rate with exercise intensity and/or HA. The same analysis was performed on the normalized ratio RSR data as previously outlined for the absolute data. Statistical analysis was performed using SPSS (IBM SPSS, version 24, Armonk, N.Y. USA) and the significance level was set at an alpha level of p < 0.05.
Regional skin temperature data
A one-way repeated measures ANOVA and post hoc pairwise comparisons were performed on all regional Tsk data for separate time points during sweat mapping experiments. A series of paired t-tests were used to analyze changes in Tsk between measurement periods, and corrected for multiple comparisons (Bonferroni). A within subject analysis was performed to examine potential correlations between regional Tsk and RSR. Pearson’s r correlation coefficients were produced for RSR and both pre and post pad application Tsk at each exercise intensity due to significant differences between measurement periods.
Results
By design of the constant thermal strain acclimation protocol, Tcore and Tsk were similar between HA days (P > 0.05), and cardiovascular strain (HR) during the work bouts decreased slightly (P < 0.05). Work performed (kJ) on acclimation days to elicit the target Tcore increased from day one to six in five (+21%, p = 0.01) out of six (+11%, p > 0.05) participants (). GSL increased significantly from day one to six of acclimation (P < 0.001), representing an average increase of 14.2 ± 2.3%.
Table 1. Physiological data (mean ± SD) on days 1 and 6 of heat acclimation (HA).
Gross sweat loss and metabolic rate
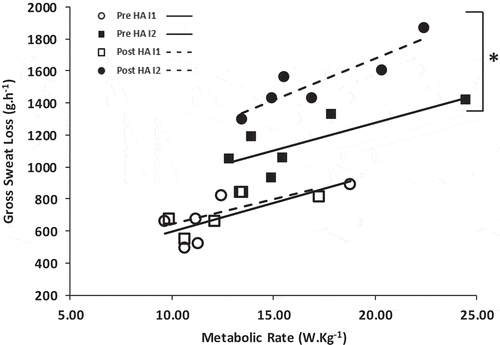
During pre- and post-HA body mapping experiments relative workloads (to achieve the target HR) were similar for I1 and I2, suggesting no change in fitness level, but GSL was significantly higher following acclimation at I2 (). illustrates the similarity in metabolic rate (W.kg−1) between pre- and post-HA experiments at both I1 and I2, but highlights divergent GSL results depending on workload. Pre- versus post-HA GSL was similar at I1 but the higher metabolic load at I2 resulted in a significantly higher post-HA GSL. This picture was the same when metabolic rate is expressed in Watts.
Table 2. Physiological data (mean ± SD) during pre and post heat acclimation (HA) sweat mapping experimentation. Surface area weighted gross sweat loss (SA weighted GSL) was calculated from regional sweat rates for the surface area covered by pads only.
Figure 1. Absolute gross sweat loss (GSL; g ⋅ h−1) and metabolic rate (W kg−1) at exercise intensity 1 (I1) and intensity 2 (I2) during pre- and post- heat acclimation (HA) sweat mapping experiments. * indicates p < 0.05.
Regional sweating rates
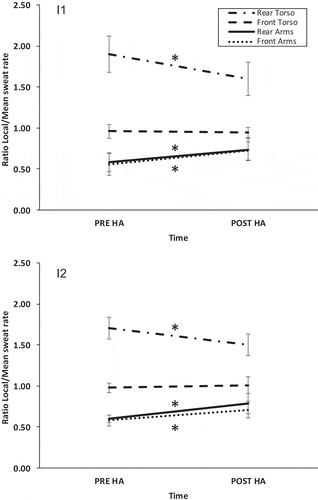
Pre and post acclimation regional sweating maps for I1 and I2 are illustrated in . Following analysis of right-left RSR data, it was decided to group corresponding right-left pads producing a total of 17 grouped R-L regions for further analysis, due to any significant right-left differences being present in only a small number of the 28 individual zones sampled. RSR were highest on the central back during both pre and post acclimation tests at I1 (median values: pre 864 vs. post 1178 g.m−2.h−1) and I2 (pre 1268 vs. post 1772 g.m−2.h−1) for the regions tested. Pre-HA, the lowest RSR were observed on the anterior and posterior upper arms and the anterior lower torso at I1 and I2. Post acclimation, though absolute values increased, the same areas sweated least, with posterior arms increasing more than anterior. Absolute RSR increased in all zones (R-L grouped data), significantly at 12 of the 17 regions tested at I1 and 14 regions at I2 (). Detailed descriptive statistics and comparisons of all absolute RSR pre- and post-HA, and regional sudomotor sensitivity may be viewed in the Supplemental Digital Content 1 for exercise intensity 1 (see , SDC 1) and intensity 2 (see , SDC 1). Normalized regional sweating ratio data for individual zones () showed no clear shift of sweating rate distribution to the periphery, only a significant reduction in relative sweating rate on the back at I1 following acclimation. I2 individual zone ratio values on the other hand significantly decreased at the lateral upper back (p < 0.01) and increased at the anterior and posterior upper arm, and anterior lower arm (p < 0.05) versus pre-acclimation values (). To further evaluate relative redistribution of sweating, both absolute and normalized RSR were area weighted and grouped into “central” (whole excl. shoulders, front and back torso excl. shoulders) and “peripheral” (whole, anterior and posterior arms) regions. As expected, absolute RSRs increased with acclimation in all grouped areas and at both work intensities (P < 0.001). For the normalized grouped data, (), the sweat ratio (local/average sweat rate) decreased for the back torso (p < 0.05), did not change significantly for the front torso, and increased for the arms, whole and both front and back (p < 0.05), with acclimation. This was observed for both intensities. Accordingly, a significant interaction between acclimation and regional sweating ratio change was present at both intensities (P < 0.05), indicating that not all RSR increased in the same manner, supporting an increase in absolute RSR and an alteration in relative distribution of sweat with heat acclimation towards a greater contribution from the periphery.
Table 3. Significance level of pre- versus post- heat acclimation regional sweating rates. Gray shading indicates a significant decrease whilst no shading indicates a significant increase.
Figure 2. Absolute pre- and post-acclimation regional median sweat rates of the torso and arms in male athletes at exercise intensity 1 and 2. Image created by Gavin Williams.
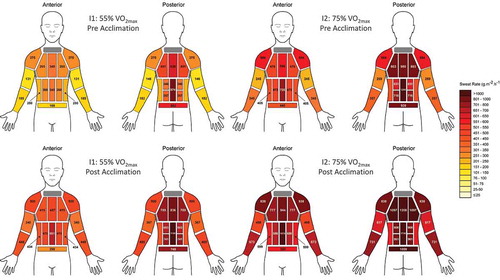
Figure 3. Normalized pre-and post-acclimation regional median sweat rates of the torso and arms in male athletes at exercise intensity 1 and 2. Image created by Gavin Williams.
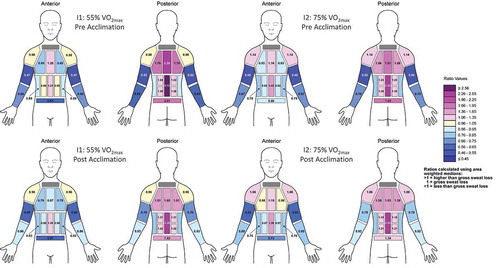
Figure 4. Individual normalized pre- and post- heat acclimation sweating rates for central (torso) versus peripheral (arms) regions at intensity 1 (I1) and intensity 2 (I2). * indicates p < 0.05.
Skin temperature
Sweat mapping regional Tsk data () were grouped into corresponding right-left regions due to limited significant differences (post-HA: BL, posterior upper torso p < 0.05; post I1, posterior lower torso p < 0.05; all non-significant following Bonferroni correction). Tsk was compared at the beginning and end of each exercise intensity, and prior to and following pad application to assess the influence of pad application itself on regional Tsk.
Table 4. Pre and post heat acclimation (HA) regional skin temperature during sweat mapping experiments at 5 measurement periods: baseline (BL), pre I1 pad application (Pre I1), post I1 pad application (Post I1), pre I2 pad application (Pre I2), and post I2 pad application (Post I2). Significant changes within regions from the previous measurement period are indicated by the symbols listed below the table. A significant decrease is indicated by grey shading (![]() ).
).
Exercise Intensity
During pre-HA testing, no significant changes in regional Tsk occurred during I1, but seven of the 13 regions significantly decreased during I2. During pre-HA testing, one region significantly increased and two regions significantly decreased during I1 (), and Tsk at 11 of the 13 regions significantly decreased during I2. Overall, the largest increase in Tsk was observed during I2 at the anterior medial lower torso in both pre and post HA data, increasing 1.8°C and 2.2°C, respectively. The smallest pre HA Tsk change was observed during I1 at the anterior lateral lower torso, rising by 0.3°C, versus the anterior lower arm during post HA testing, rising 1.1°C. Despite the larger increases in regional Tsk during post HA sweat mapping, the large inter-individual variation resulted in only one significant difference being present between experiments (pre I2: anterior medial upper torso).
Pad Application
During pre HA testing, Tsk increased significantly at 11 of the 13 regions during the 5 minute I1 pad application period (only 3 out of 13 regions following Bonferroni correction), and only three regions during I2 pad application (one region following Bonferroni correction). During post HA testing, a significant increase in 9 out of 13 regions occurred during both I1 and I2 pad application. The mean increase of all regions at I1 was 0.9 ± 0.4°C and 1.7 ± 0.5°C for pre and post acclimation respectively, and 1.1 ± 0.4°C and 2.2 ± 0.6°C at I2. Notably, significant increases in Tsk associated with pad application were not consistent across exercise intensities or pre/post-HA testing, suggesting a limited impact.
Discussion
The present study provides the most detailed regional sweating rate data of the upper body following heat acclimation currently available. The main findings from the regional sweating data were 1) sweating rates increased in all zones (most reaching significance) following 6 days of hot-dry heat acclimation using a clamped-hyperthermia (constant thermal strain) protocol, 2) the ranking of high to low sweat producing regions remained similar pre and post acclimation, and 3) the contribution of peripheral sweating rates to whole body sweat rate increased relatively more than for central regions, leading to a more uniform sweat distribution. Overall, these data provide evidence of a preferential relative redistribution of sweating from central to peripheral regions following hot-dry acclimation. An important secondary finding highlights significant increases in GSL at higher workloads following HA (increased gain), that are not observed at lower workloads. Classic hallmarks of acclimation were observed, including a physiologically relevant increase in workload of 21% in 5 out of 6 participants, required to elicit the target 1.4°C Tcore rise and a concomitant, significant increase of 14% in GSL to compensate for this higher heat production on day 6 versus day 1 of HA.
Regional variation in sweating rates over the body are well documented, yet little consensus exists regarding how RSRs change with HA. In the present study, a relative RSR redistribution was observed post-HA, that was more pronounced at the higher workload ( and ). When simply considering absolute high and low RSR regions, our data are consistent with prior sweat mapping data [Citation14,Citation15], and other groups using varied measurement techniques [Citation16,Citation17,Citation32,Citation33]. At both intensities, RSR were highest at the central back, with a medial to lateral decrease across both the anterior and posterior torso at I1 and I2 during both pre- and post-acclimation testing. The lowest RSR were consistently observed on the arms, with lowest values on the upper arms at both intensities. Importantly, despite a significant increase in absolute RSRs, the magnitude of this increase varied between sites. Normalized ratio sweating data were used to assess relative changes in the contribution of a zone’s RSR to overall body sweat production, both for individual () and for grouped zones (). For individual zones, limited statistical support was observed for relative peripheral redistribution at I1, but was evident at I2. When zones were grouped as front torso/back torso/front arms/rear arms (), clear significant changes were observed with the greatest increase on the arms and the strongest decrease in relative sweat rate on the back. No change was observed on the chest. This preferential relative redistribution of sweating on the upper limbs suggests a shift towards a more uniform distribution and thus improved distribution of skin wettedness [Citation10,Citation34], potentially leading to higher evaporative efficiency.
In conjunction with the RSR data, an intensity-dependent increase in GSL following HA was evident only at I2. The present data () supports our prior findings [Citation14,Citation15] and those of others [Citation35], indicating a strong relation between sweating rates and metabolic heat production ( remains similar, whether expressed in W.kg−1; W.m−2; or W). However, as in our earlier studies [Citation14,Citation15] the relation differs depending on intensity, despite similar evaporative requirements, and in the present study also between pre- and post-HA sweat mapping experiments. Improved sweating responses following HA are well documented, but this latter result appears to tease out an HA-related augmentation of sweating responses that is dependent on heat production levels. Intensity-dependent differences in GSL have previously been reported by Gagnon and Kenny [Citation36], who observed sex-related differences in sudomotor function only to occur above certain heat loss requirements. In the present study, both significant HA-dependent increases in GSL and a more pronounced upper body peripheral redistribution of local sweating were observed at a higher workload, indicating the importance of heat production levels when determining physiological differences or adaptations. A recent study by Jay and colleagues provides support for an HA-induced peripheral redistribution in RSR, but highlights the importance of compensability [Citation37]. Pre- and post-HA Tcore responses in their experiments were similar during exercise in compensable conditions, regardless of HA status, but greater GSL, RSR and reduced Tcore rise were observed post-HA in uncompensable conditions. Using ventilated capsules at two sites (arm, chest), peripheral (arm) RSR were higher in both instances, but the increase was greater in uncompensable conditions, coupled with an increased torso (central) RSR that was not observed under compensable conditions. In relation to the present study which provided more extensive RSR sites, the compensable conditions during sweat mapping experiments may explain the similarity in pre- versus post-HA Tcore data and limited peripheral redistribution at I1. As uncompensable conditions are approached (i.e. the higher workload), significantly greater post-HA RSR and GSL are observed, with evidence of peripheral redistribution. Emerging support for HA-induced thermoregulatory adjustments evident only during exercise stress in uncompensable conditions may contribute to explaining discrepancies in the literature.
The present data indicate increases in GSL that are much smaller than increases in total sweating loss captured by the sum of all patches. Post-HA GSL increased 10% at I1, yet SA weighted GSL for the torso and arms together increased 68%. There are two possible causes. The first, described in our earlier studies and confirmed by Morris et al. [Citation38], is that GSL is measured over the whole 30 min period, integrating periods where sweating begins, with periods where sweating rate will have increased markedly. The sample period for the patches occurs during steady state, only capturing the highest sweating rate for that period. In addition, it may suggest that the increase in areas not covered with pads is lower than in the regions measured, but this is difficult to tease out from the first consideration. The biggest surface area not measured is the legs, thus suggesting that RSR on the legs may increase less than the average for the torso and arm regions following HA.
It is important to note that in its broadest sense “redistribution” implies that something is transferred from one location to another, with absolute decreases in one area facilitating increases elsewhere. This was not the case here, with RSR increasing in all areas. Discussing only absolute changes in RSR and drawing conclusions from these regarding redistribution does not provide a complete picture. Similarly, expressing a relative increase as a percentage or fraction increase for a zone [Citation11] (e.g. RSRchest post-HA/RSRchest pre-HA) can be misleading, as the same absolute change would suggest a higher percentage increase for the low sweat zone. In the present study, the terms “relative redistribution” and “relative increase/decrease” are used to more appropriately reflect relative changes in RSR as a proportion of whole body sweating rate. For this purpose, “relative” values are expressed as the RSR in relation to the average whole body sweating rate (equation 1). Logically, an increase in this value reflects a bigger contribution to overall body sweating rate and allows evaluation of relative shifts of contribution. When considering HA studies, this highlights the importance of normalized ratio sweating data, with different approaches to data analysis and use of definitions leading to varied interpretation.
A central to peripheral “redistribution” in RSR following HA was initially reported by Hofler [Citation21], and later supported by Shvartz [Citation13]. Hofler [Citation21] calculated the percentage contribution of four body segments to overall sweating output following HA to dry and humid heat. Results varied depending on the environmental conditions (35 days, hot-dry (n = 3) versus hot-wet (n = 5)), with humid heat exposure eliciting a significant relative redistribution towards the upper limbs. Hofler reported a decrease in absolute RSR on the legs with a similar pre- and post-HA relative distribution, an increase in both absolute and relative RSR on the arms, and varied absolute changes in torso RSR. A relative decrease of the contribution of torso sweating rates to the overall sweat output, and redistribution towards the upper limbs (after >9 days HA) support the present findings. Notably, the preferential torso to limb redistribution observed during humid-heat HA, suggests specificity of sweating responses to the environmental conditions (evaporation capacity), providing further support for greater post-HA sweating responses during uncompensable conditions [Citation37]. Limitations to Hofler’s data should be considered, including the limited sites and surface area used to extrapolate body segment sweating rates (2–6, 4cm diameter Plexiglas rings per region), and different environmental conditions (hot-dry, hot humid) and protocols (exposures ranging 2hrs/day to continuous “living”, and HA protocols ranging 20–35 days) utilized for individual participants. Similar results were observed by Shvartz [Citation13], whereby absolute RSRs measured using sweat capsules (4 cm2), increased proportionally more on the arms following a 15 day HA protocol, however, absolute arm RSR were consistently higher than the chest and torso which is inconsistent with most other data from a range of laboratories [Citation12,Citation20]. Similarly to the present data, there was a discrepancy between magnitude of increases in GSL following HA and greater increases in RSR at the locations measured, reinforcing that RSRs, dependent on the total surface area measured, may not reflect GSL changes with HA. This further highlights the unique data provided by the present body sweat maps, allowing a broader and more detailed picture of RSR alterations versus more traditional approaches.
More recently, Poirier and colleagues [Citation20], observed an increase in GSL following 10 days of hot-dry HA (35°C, 20% rh) and some evidence of RSR redistribution. Local forearm sweating rates increased significantly during the 2nd and 3rd exercise bouts, yet similar pre- and post-HA values were observed on the chest and upper back throughout the protocol. Notably, RSR were measured using the ventilated capsule technique (~3.8 cm2) and did not include sites on the lower torso, legs, or forehead. These data support the current findings and other investigators [Citation13,Citation21], clearly demonstrating that individual location or small area RSR do not necessarily reflect increases in GSL or the larger region.
A number of studies have focused on other aspects of HA, but upon secondary analysis of these data, we find that they do in fact support the redistribution theory. For example, Inoue et al [Citation5] investigated the effects of HA and aerobic fitness on RSR in both younger and older males. Since sweating distribution per se was not the primary focus, we reevaluated the data presented and calculated both absolute changes following HA and relative RSR changes in proportion to all sites measured (relative redistribution). An absolute increase in RSR was observed at all sites in the young males following 8 days of fixed intensity exercise acclimation (43°C, 30% rh), with greater relative increases at peripheral (forearm, thigh) versus central sites (chest, back). Based on our new calculations from their data [Citation5], peripheral sites remained the lowest absolute sweat regions following acclimation, but values increased by ~100% on the forearm and thigh compared to ~47% and ~11% on the chest and back, respectively. The latter two calculations are consistent with observation from our own data that the back increases relatively less with HA than the chest (). This is one of only a limited number of studies that has measured peripheral sweating at multiple limb sites, providing some indication of a true peripheral relative redistribution, and not simply “upper limb” redistribution.
In contrast, Patterson and colleagues, reported an absence of peripheral sweating redistribution (3.15 cm2 capsules) following 3 weeks (16 exposures) of humid HA [Citation11]. Unacclimated males underwent a controlled-hyperthermia protocol (40°C, 60% rh) involving 90-min cycling/day, 6 days per week to elicit a target Tcore of 38.5°C. Despite the authors arguing against relative peripheral redistribution, their data may in fact support an increase in upper limb redistribution with RSR. In absolute terms, forearm RSR increased 122% from day 1 to 22 of HA, versus 85% on the scapula and 105% on the chest. However, redistribution towards the lower limbs (thighs) was not evident, with an increase of only 45% by day 22. Lower limb RSR were not measured in the present study, but a comparison of GSL and SA weighted GSL provides agreement with Patterson et al [Citation11], whereby a smaller increase on areas not covered by pads (i.e. legs) indicates an absence of lower limb relative redistribution. Interpretation of data from Patterson and colleagues [Citation11] is problematic when only considering absolute increases (%) due to a regional percentage increase being related to the zone’s RSR rather than the whole body SR, as in the present data. When we recalculated their data, considering either RSR in relation to GSL or proportionally to all sites measured (normalized ratio values), the forearm showed the greatest relative increase (from 0.80 to 1.0 ratio following HA), followed by the chest (0.90 to 1.0). The relative scapula sweating rate remained similar from day 1 to 22 of HA (1.0 ratio value), whilst the thigh showed a relative decrease (from 1.0 to 0.73). Unfortunately, given the small areas tested, we cannot accurately calculate relative contributions in the same way as in the present paper and this interpretation needs to be considered with caution.
Other studies have noted no improvement in GSL [Citation5,Citation12,Citation28], or RSR and/or peripheral redistribution for reasons that are not fully clear [Citation12]. Explanations include an insufficient stimulus for acclimation to occur, associated with lower workloads and compensable conditions [Citation39,Citation40], and non-consecutive HA days allowing potential decay in the physiological responses [Citation41–Citation43]. A 6-day controlled hyperthermia protocol with intermittent exercise, adapted by Havenith and van Middendorp [Citation28] based on the work of Fox [Citation39], was selected in the present study to ensure maintained physiological strain and optimal acclimation [Citation44]. This is reported as the minimum number of days required to achieve sudomotor adjustments [Citation11], although others have suggested >10–14 days are necessary for more complete adaptation [Citation41,Citation45], particularly in untrained populations. The “partial acclimation” possessed by athletes allowed a short HA regimen, owing to higher baseline sweat rates versus sedentary individuals, and more rapid acclimation [Citation41,Citation42,Citation46]. Discrepancy still surrounds optimal HA procedures, and rate of decay [Citation41,Citation47,Citation48], which may be explored further in several extensive review articles [Citation42–Citation44,Citation49]. GSL did increase in all participants throughout heat acclimation for a similar Tcore rise but was similar on days 5 and 6 (14.2 ± 2.3% increase on day 6 vs day 1), representing a classic hallmark of heat acclimation. Considering the high RSR, which may be near maximal following HA, a relative redistribution of sweating towards the arms may be an efficient way to maximize evaporative heat loss.
Limitations
Due to the use of a modified absorbent method in the present study, the entire body surface could not be measured in a single test without potential alterations in the thermal state of the body and manipulation of RSR. Changes in RSR on the head, legs, feet and hands were therefore not assessed. As such, the ratio values calculated to observe distribution shifts only considered RSR on the regions measured, i.e. torso and arms. Further, this technique does not allow for continuous measurement of sweating rates or onset thresholds. Investigators requiring such measurements should consider ventilated capsules as a more suitable approach, whilst acknowledging its drawback of measuring only a small surface area at limited body sites. RSR measured with the modified absorbent technique correlate highly with the ventilated capsule method during steady state, but may yield lower RSR values during non-steady state (e.g. in the early stages of exercise), making the use of ventilated capsules more appropriate under such conditions [Citation38]. Finally, sweat gland activation was not measured or output per gland calculated in the present study but may be considered [Citation50]. The origin of the increases in RSR can therefore not be established.
Conclusions
Finally, these data are in agreement with literature reporting HA-induced increases in GSL and RSR, but with a preferential relative peripheral redistribution which was more pronounced at higher workloads. The modified absorbent technique provides a novel approach to the simultaneous measurement of sweating rates over multiple sites covering a large skin surface area. Careful consideration of absolute changes versus relative redistribution of sweating must be recognized to gain accurate insights into physiological adjustments with HA.
The present upper body sweat maps provide the most detailed regional sweating data covering the largest skin surface area currently available following HA. Controlled hyperthermia (constant thermal strain) exercise-HA in a hot-dry environment elicited a significantly increased GSL that was evident only at a higher exercise intensity and increased RSR in most regions. Lower sweating regions at the periphery (arms) showed a greater increase in contribution to overall sweat rate compared to the increases in higher sweating regions (torso), leading to a preferential relative redistribution of sweating towards the periphery mainly from the back torso to the arms (note that legs were not measured). The HA-associated higher uniformity of sweat distribution is stronger at the higher work intensity. Sweating patterns were consistent with prior body sweat mapping studies, showing highest and lowest RSR on the central back versus the anterior lower torso and arms, respectively. These sweat maps provide a unique assessment of local sweating rates which may help inform researchers on the most appropriate measurements sites when only a minimal number of sites are possible to be captured (i.e. capsules). Further, these data have important applications for thermophysiological modeling requiring detailed physiological data on responses to HA and for garment design, which consider evaporative cooling and moisture management.
Abbreviations
| BL | = | Baseline |
| GSL | = | Gross sweat loss |
| HA | = | Heat acclimation |
| HR | = | Heart rate |
| I1 | = | Intensity 1 |
| I2 | = | Intensity 2 |
| rh | = | Relative humidity |
| RSR | = | Regional sweating rate |
| Ta | = | Ambient temperature |
| Tcore | = | Core temperature |
| Tsk | = | Skin Temperature |
| Tre | = | rectal temperature |
Supplemental Material
Download MS Word (34.2 KB)Acknowledgments
This research was co-funded by the Adidas Futures Team, Germany, and the Environmental Ergonomics Research Centre, Loughborough University, UK. The authors would like to thank Dr. Simon Hodder for his assistance with data collection, and Dr. Gavin Williams for production of sweat mapping images.
Disclosure statement
No potential conflict of interest was reported by the authors.
Supplementary material
Supplemental data for this article can be accessed here.
Additional information
Funding
References
- Havenith G, Fiala D. Thermal indices and thermophysiological modeling for heat stress. Compr Physiol. 2015;6(1):255–302. PMID: 26756633. DOI:10.1002/cphy.c140051.
- Lorenzo S, Halliwill JR, Sawka MN, et al. Heat acclimation improves exercise performance. J Appl Physiol (Bethesda, Md: 1985). 2010;109(4):1140–1147. PMID: 20724560. DOI:10.1152/japplphysiol.00495.2010.
- Havenith G. Individualized model of human thermoregulation for the simulation of heat stress response. J Appl Physiol (Bethesda, Md: 1985). 2001;90(5):1943–1954. PMID: 11299289. DOI:10.1152/jappl.2001.90.5.1943.
- Wyndham CH, Rogers GG, Senay LC, et al. Acclimization in a hot, humid environment: cardiovascular adjustments. J Appl Physiol. 1976;40(5):779–785. PMID: 931906. DOI:10.1152/jappl.1976.40.5.779.
- Inoue Y, Havenith G, Kenney WL, et al. Exercise- and methylcholine-induced sweating responses in older and younger men: effect of heat acclimation and aerobic fitness. Int J Biometeorol. 1999;42(4): 210–216. PMID: 10232057.
- Nielsen B, Hales JR, Strange S, et al. Human circulatory and thermoregulatory adaptations with heat acclimation and exercise in a hot, dry environment. J Physiol. 1993;460:467–485. PMID: 8487204.
- Sawka MN, Young AJ, Cadarette BS, et al. Influence of heat stress and acclimation on maximal aerobic power. Eur J Appl Physiol Occup Physiol. 1985;53(4): 294–298. PMID: 4039255.
- Sato F, Owen M, Matthes R, et al. Functional and morphological changes in the eccrine sweat gland with heat acclimation. J Appl Physiol. 1990;691:232–236. PMID: 2203723. DOI:10.1152/jappl.1990.69.1.232.
- Candas V, Libert JP, Vogt JJ. Sweating and sweat decline of resting men in hot humid environments. Eur J Appl Physiol. 1983;50(2):223–234. DOI:10.1007/bf00422161
- Ravanelli N, Coombs GB, Imbeault P, et al. Maximum Skin wettedness after aerobic training with and without heat acclimation. Med Sci Sports Exerc. 2018;50(2):299–307. PMID: 28991042. DOI:10.1002/cphy.c140051.
- Patterson MJ, Stocks JM, Taylor NA. Humid heat acclimation does not elicit a preferential sweat redistribution toward the limbs. Am J Physiol Regul Integr Comp Physiol. 2004;286(3):R512–18. PMID: 14578114. DOI:10.1152/ajpregu.00359.2003.
- Cotter JD, Patterson MJ, Taylor NAS. Sweat distribution before and after repeated heat exposure. Eur J Appl Physiol. 1997;76(2):181–186. DOI:10.1007/s004210050232.
- Shvartz E, Bhattacharya A, Sperinde SJ, et al. Sweating responses during heat acclimation and moderate conditioning. J Appl Physiol Respir Environ Exerc Physiol. 1979;46(4):675–680. Epub 1979/04/01. PMID: 457545. DOI:10.1152/jappl.1979.46.4.675.
- Smith CJ, Havenith G. Body mapping of sweating patterns in male athletes in mild exercise-induced hyperthermia. Eur J Appl Physiol. 2011;111(7):1391–1404. PMID: 21153660. DOI:10.1007/s00421-010-1744-8.
- Smith CJ, Havenith G. Body mapping of sweating patterns in athletes: a sex comparison. Med Sci Sports Exerc. 2012;44(12):2350–2361. PMID: 22811031. DOI:10.1249/MSS.0b013e318267b0c4.
- Cotter JD, Patterson MJ, Taylor NAS. The topography of eccrine sweating in humans during exercise. Eur J Appl Physiol. 1995;71(6):549–554. DOI:10.1007/bf00238559.
- Machado-Moreira CA, Smith FM, Amj VDH, et al. Sweat secretion from the torso during passively-induced and exercise-related hyperthermia. Eur J Appl Physiol. 2008;104(2):265–270. DOI:10.1007/s00421-007-0646-x.
- Machado-Moreira CA, Caldwell JN, Mekjavic IB, et al. Sweat secretion from palmar and dorsal surfaces of the hands during passive and active heating. Aviat Space Environ Med. 2008;79(11): 1034–1040. PMID: 18998484.
- Machado-Moreira CA, Wilmink F, Meijer A, et al. Local differences in sweat secretion from the head during rest and exercise in the heat. Eur J Appl Physiol. 2008;104(2):257–264. DOI:10.1007/s00421-007-0645-y.
- Poirier MP, Gagnon D, Kenny GP. Local versus whole-body sweating adaptations following 14 days of traditional heat acclimation. Appl Physiol Nutr Metab. 2016;41(8):816–824. DOI:10.1139/apnm-2015-0698.
- Hofler W. Changes in regional distribution of sweating during acclimatization to heat. J Appl Physiol. 1968;25(5):503–506. PMID: 5687355. DOI:10.1152/jappl.1968.25.5.503.
- Jackson AS, Pollock ML. Generalized equations for predicting body density of men. Br J Nutr. 1978;40(3): 497–504. PMID: 718832.
- Epstein Y, Stroschein LA, Pandolf KB. Predicting metabolic costs of running with and without backpack loads. Eur J Appl Physiol. 1987;56(5):495–500.
- Whaley MH, Brubaker PH, Otto RM, et al. ACSM’s guidelines for exercise testing and prescription. Philadelphia, PA: Lippincott Williams & Wilkins; 2006. p. 70–5.
- Havenith G, Fogarty A, Bartlett R, et al. Male and female upper body sweat distribution during running measured with technical absorbents. Eur J Appl Physiol. 2008;104(2):245–255. DOI:10.1007/s00421-007-0636-z.
- Ramanathan NL. A new weighting system for mean surface temperature of the human body. J Appl Physiol. 1964;19:531–533. PMID: 14173555.
- Fox RH A review of studies on the physiology of heat stress. Army Personnel Research Committee Report 68/A1 Ministry of Defence UK; 1968.
- Havenith G, Van Middendorp H Determination of the individual state of acclimatization. IZF report 1986-27. Soesterberg, Netherlands: TNO Institute for Perception; 1986. p. 24. Available from: https://dspace.lboro.ac.uk/dspace-jspui/handle/2134/10942
- Livingstone SD, Nolan RW, Cain JB, et al. Effect of working in hot environments on respiratory air temperatures. Eur J Appl Physiol Occup Physiol. 1994;69(2):98–101.
- Kerslake D. The stress of hot environments. Cambridge: Cambridge University Press; 1972. p. 121.
- Bender R, Lange S. Multiple test procedures other than Bonferroni’s deserve wider use. BMJ. 1999;318(7183): 600–601. PMID: 10037651.
- Hertzman AB. Individual differences in regional sweating. J Appl Physiol. 1957;10(2):242–248. PMID: 13428653. DOI:10.1152/jappl.1957.10.2.242.
- Weiner JS. The regional distribution of sweating. J Physiol. 1945;104(1):32–40. DOI:10.1113/jphysiol.1945.sp004103.
- Candas V, Libert JP, Vogt JJ. Influence of air velocity and heat acclimation on human skin wettedness and sweating efficiency. J Appl Physiol. 1979;476:1194–1200. PMID: 536289 DOI:10.1152/jappl.1979.47.6.1194.
- Cramer MN, Jay O. Explained variance in the thermoregulatory responses to exercise: the independent roles of biophysical and fitness/fatness-related factors. J Appl Physiol (Bethesda, Md: 1985). 2015;119(9):982–989. PMID: 26316511. DOI:10.1152/japplphysiol.00281.2015.
- Gagnon D, Kenny GP. Sex differences in thermoeffector responses during exercise at fixed requirements for heat loss. J Appl Physiol (Bethesda, Md: 1985). 2012;113(5):746–757. PMID: 22797311. DOI:10.1152/japplphysiol.00637.2012.
- Jay O, Imbeault P, Ravanelli N. The sweating and core temperature response to compensable and uncompensable heat stress following heat acclimation. FASEB J. 2018;32(1).
- Morris NB, Cramer MN, Hodder SG, et al. A comparison between the technical absorbent and ventilated capsule methods for measuring local sweat rate. J Appl Physiol (Bethesda, Md: 1985). 2013;114(6):816–823. PMID: 23305986. DOI:10.1152/japplphysiol.01088.2012.
- Fox RH, Goldsmith R, Kidd DJ, et al. Acclimatization to heat in man by controlled elevation of body temperature. J Physiol. 1963;166:530–547. PMID: 13959046.
- Regan JM, Macfarlane DJ, Taylor NA. An evaluation of the role of skin temperature during heat adaptation. Acta Physiol Scand. 1996;158(4):365–375. PMID: 8971258. DOI:10.1046/j.1365-201X.1996.561311000.x.
- Pandolf KB, Burse RL, Goldman RF. Role of physical fitness in heat acclimatisation, decay and reinduction. Ergonomics. 1977;20(4):399–408.
- Taylor NAS. Principles and practices of heat adaptation. J Hum Environ Syst. 2000;4(1):11–22.
- Daanen HAM, Racinais S, Périard JD. Heat acclimation decay and re-induction: A SYSTEMATIC REVIEW AND META-Analysis. Sports Med (Auckland, NZ). 2018;48(2):409–430. DOI:10.1007/s40279-017-0808-x. PMID: 29129022.
- Tyler CJ, Reeve T, Hodges GJ, et al. The effects of heat adaptation on physiology, perception and exercise performance in the heat: a meta-analysis. Sports Med. 2016;46(11):1699–1724.
- Horowitz M. Do cellular heat acclimation responses modulate central thermoregulatory activity? Physiology. 1998;13(5):218–225.
- Sunderland C, Morris JG, Nevill ME. A heat acclimation protocol for team sports. Br J Sports Med. 2008;42(5):327–333. PMID: 18460609. DOI: 10.1136/bjsm.2007.034207.
- Casadio JR, Kilding AE, Siegel R, et al. Periodizing heat acclimation in elite laser sailors preparing for a world championship event in hot conditions. Temperature. 2016;3(3):437–443. PMID: 28349083. DOI:10.1080/23328940.2016.1184367.
- Ashley CD, Ferron J, Bernard TE. Loss of heat acclimation and time to re-establish acclimation. J Occup Environ Hyg. 2015;12(5):302–308. Epub 2015/01/27. PubMed PMID: 25621940. DOI:10.1080/15459624.2014.987387.
- Périard JD, Travers GJS, Racinais S, et al. Cardiovascular adaptations supporting human exercise-heat acclimation. Auton Neurosci. 2016;196:52–62.
- Gerrett N, Amano T, Inoue Y, et al. The effects of exercise and passive heating on the sweat glands ion reabsorption rates. Physiol Rep. 2018;65:e13619. PubMed PMID: PMC5828933. DOI:10.14814/phy2.13619.