
 ?Mathematical formulae have been encoded as MathML and are displayed in this HTML version using MathJax in order to improve their display. Uncheck the box to turn MathJax off. This feature requires Javascript. Click on a formula to zoom.
ABSTRACT
Noninvasive imaging methods of internal body temperature are in high demand in both clinical medicine and physiological research. Thermography and thermometry can be used to assess tissue temperature during thermal therapies: ablative and hyperthermia treatments to ensure adequate temperature rise in target tissues but also to avoid collateral damage by heating healthy tissues. In research use, measurement of internal body temperature enables us the production of thermal maps on muscles, internal organs, and other tissues of interest. The most used methods for noninvasive imaging of internal body temperature are based on different parameters acquired with magnetic resonance imaging, ultrasound, computed tomography, microwave radiometry, photoacoustic imaging, and near-infrared spectroscopy. In the current review, we examine the aforementioned imaging methods, their use in estimating internal body temperature in vivo with their advantages and disadvantages, and the physical phenomena the thermography or thermometry modalities are based on.
Introduction
Noninvasive measurement of internal tissue temperature is in high demand due to the increasing use of thermal ablation in various neoplastic diseases and in thermal tissue mapping in physiological research. In clinical setting, the monitoring of internal temperature with imaging is mostly used in thermal ablation to assess adequate target area heating to achieve target tissue coagulation but also to avoid the heating of surrounding healthy tissues. Local thermal ablation is used for thermal destruction of cancer tissue and the aim is to cause minimal damage to the surrounding tissue. The target tumor has to be heated over 60°C in thermal ablation [Citation1]. However, the presence of large vessels may cause heat loss in the target is during the procedure and target temperature is not reached throughout the tumor tissue. Thus, monitoring of deep tissue temperature during thermal ablation treatment is vital not only to avoid damage to surrounding tissues but also to ascertain that the target temperature is reached during the treatment.
Monitoring cerebral temperature during thermal ablation requires a noninvasive accurate imaging modality since body core temperature may differ from cerebral temperature [Citation2]. The monitoring of brain temperature changes in newborns with hypoxic-ischemic encephalopathy is one clinical field which may benefit from noninvasive and nonradiative imaging of internal temperature. Regional oxygen saturation measured using near-infrared spectroscopy has been examined in the assessment of short-term outcome prediction in neonates with hypoxic ischemic encephalopathy treated with therapeutic hypothermia [Citation3]. Additionally, near-infrared spectroscopy can be used in estimating tissue temperature which might be interesting in research in an attempt to predict responders from non-responders.
Physiological research into heat-producing tissues is another field that requires noninvasive methods to provide thermal mapping in different areas. Direct measurement of internal temperature in these tissues with high spatial and temporal resolution and reproducibility is vital for research purposes to assess e.g. thermogenesis in brown adipose tissue or skeletal muscle. The use of infrared thermography in measuring the surface temperature over brown adipose tissue has been suggested as a cheap, fast, and noninvasive complementary method to the radiating and expensive positron-emission tomography [Citation4]. Thus, thermography modalities could offer a radiation-free alternative to estimate metabolic activity in heat-producing tissues. However, the relatively low physiological variability in tissue temperature (normothermia ranging between 36.5°C and 37.5°C) requires a high thermal sensitivity from the thermal imaging method in order to detect small variations. Arterial blood temperature is the main determinant of temperature in tissues with limited heat exchange and according to Zaretsky et al., temperature difference between tissue and arterial blood is proportional to arteriovenous difference in oxygen content, is independent of blood flow, and cannot exceed 1.3°C [Citation5]. Thus, internal temperature measurement may be used to estimate tissue oxygen uptake but the temperature sensitivity in measurement of physiology should be around 1.0 °C or below.
In 2006, Frich presented a list of requirements for noninvasive methods to monitor tissue temperature during thermal ablation procedures [Citation6]: acquisition time <10–30 seconds, temperature accuracy of 1–2°C, and spatial resolution of 1–2 mm. We could further deduce that an imaging modality of internal tissue temperature in vivo would require a short acquisition time, high spatial resolution, deep tissue penetration, high thermal sensitivity, and little-to-no harm to the examined tissue.
In the current review, we cover the most studied imaging methods with capabilities to be utilized in internal thermography, the phenomena they are based on and the major advantages and disadvantages in temperature measurement. The examined noninvasive imaging methods for internal temperature include magnetic resonance imaging (MRI), ultrasound, computed tomography (CT), near-infrared spectroscopy (NIRS), microwave radiometry, and photoacoustic imaging. The section of each imaging method contains the theoretical background of the imaging modality in the beginning (directed toward physicists, engineers, etc.) followed by an in-practice section which examines the practical or clinical use of the examined method (directed toward biomedical researchers, medical doctors, etc.). A list of technical terms is also provided in .
Part 1. Magnetic resonance imaging, ultrasonography, and computed tomography
In this part, we cover thermometry methods which use imaging modalities that are widely used in clinical medicine outside internal temperature measurements in vivo. These methods include MRI, ultrasonography, and CT. The imaging equipment for MRI and CT is heavy and, in most cases, immobile so that the studied sample or person has to enter the large scanner. In contrast to these methods, ultrasonography requires smaller instruments that can be used for bedside measurements.
Magnetic resonance thermometry
Temperature affects several parameters measured in magnetic resonance imaging (MRI) and spectroscopy (MRS). Some of them can be used for measuring absolute or relative temperature yet simultaneously they can interfere with the temperature measurement. This section introduces the physical basis of the most commonly used temperature-sensitive parameters and sources of measurement errors. For a more in-depth analysis of the biological applications of magnetic resonance thermometry, we recommend an excellent review by Odéen and Parker [Citation7].
Proton resonance frequency
The most commonly used temperature-sensitive effect in magnetic resonance is the chemical shift of proton resonance frequency (PRF) discovered first by Schneider et al. in 1958 [Citation8]. The local magnetic field experienced by a single proton Bloc can be described as a function of temperature T as:
where σ(T) is the chemical shift at a temperature T and B0 is the main magnetic field. Chemical shift is affected both by temperature-independent effects such as B0 inhomogenities and temperature-dependent effects, which arise from the hydrogen bonding between water molecules [Citation9]. Temperature rise increases Brownian motion which causes hydrogen bonds to bend, stretch, and break [Citation10]. Therefore, temperature rise decreases the average time i which the water molecules spend in hydrogen-bonded state which causes greater shielding from the electron cloud resulting in lower resonance frequency (see ).
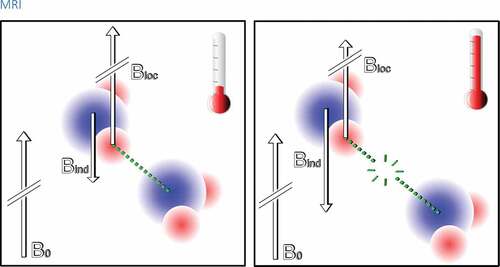
Figure 1. A simplified scheme of the PRFS phenomenon on atomic level. Left: A hydrogen atom in a water molecule is in an external magnetic field B0. The electron cloud of the water molecule induces an opposite magnetic field Bind which has considerably smaller magnitude than B0. The induced field reduces the effect of the external magnetic field on the hydrogen nucleus (the proton) hereby the local field experienced by the proton is: Bloc = B0 – Bind. The electron cloud thus causes a small shielding effect. However, the adjacent water molecules are attracted to each other by a hydrogen bond (green dotted line) which has an effect on the electron cloud. This causes a decrease of Bind and so reduces the shielding effect Right: As the temperature rises the hydrogen bonds stretch, bend, and break due to thermal motion and the hydrogen bond does not interfere the electron cloud as strongly anymore. Therefore, the shielding effect on the hydrogen nucleus increases and the local field is reduced
The chemical shift can be determined from the phase Φ of magnetic resonance signal:
where γ is the gyromagnetic ratio and TE is the echo time. Using the phase information, it is possible to determine the relative temperature change:
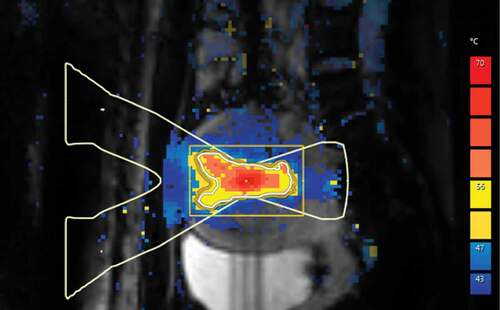
where Φ(T) is the phase of the signal after the temperature has changed to temperature T, Φ(Tref) is the phase of a reference baseline signal acquired before the temperature change and α is the temperature coefficient [Citation9]. represents a temperature measurement from a uterine fibroid during ablative thermal therapy. In 1966, Hindman first reported the temperature coefficient of pure water: -0.01 ppm/°C [Citation10]. In biological tissues, it has been shown to range from -0.00739 to -0.0135 ppm/°C and being linear between 20°C and 80°C [Citation11]. However, the chemical shift of other metabolites, for example N-acetyl-aspartate and methylene part of a triglyceride molecule is considerably less temperature-dependent. Therefore, the phase information-based thermometry cannot be applied to tissues where water is not the prime component such as adipose tissue. These less temperature-dependent metabolites can be used as reference signals for absolute thermometry in spectroscopic methods [Citation11,Citation12]. If the chemical shifts of water and a reference metabolite are denoted as σW and σref the absolute temperature can be determined from the equation:
Figure 2. A color scaled PRF-based temperature map acquired using phase imaging from pelvic area during MRI-guided high-intensity focused ultrasound treatment of uterine fibroid. Maximum heating can be seen in the focal point of ultrasound beam at the center of uterine fibroid
where β is the temperature offset at which chemical shift becomes zero [Citation11]. An example of absolute thermometry is shown in where a sample of margarine is heated from 20°C to 32°C and the frequency difference between water and methylene signal of lipids is measured simultaneously [Citation13].
Figure 3. An example of the temperature dependence of the frequency difference between water and fat. A test tube containing 50 ml of margarine (fat content 82%, approximately the same as a mixture of white and brown adipocytes in human supraclavicular adipose tissue) was heated from 20°C to 32°C while MR spectra were measured from a single voxel (size: 10 × 10 x 30 mm3). Simultaneously an external thermometer was used for acquiring the temperature. Left: Few spectra at different phases of heating. Right: The frequency difference between water and methylene signal of fat plotted against temperature to show the correlation between the frequency difference and temperature. Reprinted with permission from [Citation13]
![Figure 3. An example of the temperature dependence of the frequency difference between water and fat. A test tube containing 50 ml of margarine (fat content 82%, approximately the same as a mixture of white and brown adipocytes in human supraclavicular adipose tissue) was heated from 20°C to 32°C while MR spectra were measured from a single voxel (size: 10 × 10 x 30 mm3). Simultaneously an external thermometer was used for acquiring the temperature. Left: Few spectra at different phases of heating. Right: The frequency difference between water and methylene signal of fat plotted against temperature to show the correlation between the frequency difference and temperature. Reprinted with permission from [Citation13]](/cms/asset/84c5f83b-3a88-46bd-8f76-00ef470cbb16/ktmp_a_1769006_f0003_oc.jpg)
Proton Resonance Frequency Shift (PRFS) method has technical, physical, and biological challenges. Technical challenges are static magnetic field drift over time and spatio-temporal resolution limitations [Citation14]. Physical challenges include temperature-dependent changes of relative permittivity, electric conductivity, and magnetic susceptibility [Citation11,Citation14]. Biological challenges are motion (respiratory and cardiac) during scanning, perfusion, and diffusion changes in tissue [Citation14]. Motion causes non-temperature-related phase-differences which may be falsely interpreted as temperature changes because the PRFS imaging is performed by subtracting a baseline reference image from the phase image to visualize only the temperature change [Citation7].
T1 relaxation time
Spin lattice relaxation time (i.e. longitudinal relaxation time, T1 relaxation time) of water protons in biological tissues is caused by inter- and intra-molecular dipole–dipole interactions which depend on the local magnetic field experienced by the protons [Citation15,Citation16]. However, these interactions fluctuate due to random thermal motion of molecules. T1 relaxation time can be approximated by the following equation:
where γ is the gyromagnetic ratio, ω0 is the Larmor frequency and τc is the characteristic timescale of the magnetic fluctuations that is inversely proportional to temperature [Citation17]. Hence, the T1 relaxation time and temperature are directly proportional:
The temperature can be quantified using T1 mapping if the baseline temperature Tref and the relationship between the temperature change dT and T1 change dT1 are known. Using these parameters, the temperature dependence of the T1 can be written as [Citation7,Citation9; Citation18]:
where m1 = dT1/dT. This parameter is tissue-dependent, being higher in fat-containing tissues than in water-containing tissues [Citation19]. From this equation, the temperature can be solved [Citation7,Citation9,Citation18]:
T1 relaxation time can be measured with inversion and saturation recovery-based sequences which are rather time-consuming as compared to variable flip angle (VFA) gradient echo sequence. However, VFA method is sensitive to B1-inhomogenities which should be corrected [Citation7].
T2 relaxation time
Transverse relaxation time (i.e. spin-spin relaxation time, T2 relaxation time) is caused by de-phasing and de-correlation of spins inside an imaging voxel which depends on local magnetic field caused by surrounding spins [Citation15,Citation16]. However, the local magnetic field varies as a function of time due to random thermal motion, and therefore T2 relaxation time depends on temperature (Parker, 1984).
T2 relaxation depends on the characteristic timescale of the magnetic fluctuations τc just as T1 but with different relation (Parker, 1984):
Thus, the temperature T can be measured if baseline temperature Tref and the relationship between T2 change and temperature change is known (m2 = dT2/dT) [Citation7]:
T2 relaxation time can be determined with multi-echo spin echo sequence in which signal decay is measured at several echo times which is a rather slow technique, but acquisition can be accelerated with fast turbo-spin echo readouts [Citation20,Citation21].
T2-based thermometry is routinely used in clinical MRI-guided high-intensity-focused ultrasound treatments of uterine fibroids and bone metastases because phase-imaging-based PRFS thermometry is extremely challenging in adipose tissues [Citation20,Citation21]. Temperature monitoring of near-field subcutaneous fat tissue improves patient safety and time efficiency of the treatment by ensuring an optimal cooling time after each sonication [Citation20,Citation21]. In adipose tissue, T2 relaxation time depends linearly and reversibly on the temperature range of 20–50°C, and non-linearly at temperatures of 50–70°C [Citation20,Citation21].
Diffusion
Temperature affects diffusion and viscosity of tissue. Therefore, it is possible to use diffusion-weighted MRI for measuring temperature change. The Brownian motion of molecules can be described by the diffusion constant D which depends on temperature by the following equation [Citation22]:
where Ea is the activation energy of the molecular diffusion of water, k is the Boltzmann constant and T is absolute temperature. EquationEquation (11)(11)
(11) can be further derived as:
If diffusion coefficients D and Dref are acquired at temperatures T and Tref, the temperature difference ΔT can be described as:
assuming that ΔT ≪ Tref, and Ea is independent of temperature [Citation22].
In MRI, the motion sensitivity can be achieved by applying strong diffusion gradients which results in signal attenuation, if spin moves along the direction of applied gradient, whereas signal of stationary spin does not attenuate [Citation7].
Although the sensitivity of diffusion-based thermometry is relatively high, the method has several challenges. Most important is that diffusion imaging is very sensitive not only to the motion of spins but also to patient motion. Furthermore, diffusion is not only affected by temperature but also by changes in tissue structure making thermal ablation applications challenging. Measuring adipose tissue is challenging due to its slow diffusivity [Citation7,Citation9,Citation18].
Magnetization transfer
Magnetization transfer method is an MRI technique that can be utilized in tissues with protons in three different states: protons in free water, protons bound to macromolecules, and protons in water molecules in the hydration layer between free water and macromolecules [Citation23]. Magnetization transfer method uses selective radiofrequency pulses to saturate protons in macromolecules and water molecules bound to macromolecules. These saturated protons may then enter either the free pool of protons or transfer the magnetization to free water protons during the pulse sequence resulting in decreased magnetic resonance (MR) signal in areas with macromolecules affected by the magnetization transfer [Citation23]. Magnetization transfer is not only temperature-dependent but also low in sensitivity and tissue-dependent [Citation24] therefore limiting its use in research.
Proton density
In 1987, Kamikura et al. examined the use of proton density as a measurement of temperature in vitro [Citation25] and Young et al. later examined the temperature dependence of proton density in vivo in human muscle tissue [Citation24]. Proton density is known to be proportional to equilibrium nuclear magnetization M0 which can be formulated by the Boltzmann distribution [Citation26]:
where N is the number of nuclear spins/unit of volume, γ is the gyromagnetic ratio, h is the Planck constant, I is the quantum number of the spin system (1/2 for proton), B0 is the magnetic flux density, µ0 is the permeability of free space, k is the Boltzmann constant, T is the absolute temperature and χ0 is the susceptibility. Therefore, tissue absolute temperature can be estimated from proton density-weighted images. Temperature does not change the actual proton density of the tissue but the susceptibility. In the range of 300–350 K, proton density signal change is approximately 0.29 %/°C in adipose tissue ex vivo [Citation27]. In the study by Chen et al., apparent proton density associated with temperature linearly and reversibly in adipose tissue but the results in muscle tissue were more variable [Citation27] suggesting the use of proton density in MR thermometry would require more research and development. The relatively small temperature dependency requires a high signal-to-noise ratio (SNR) and a temperature uncertainty of 3°C would require an SNR of 100 [Citation27]. Thermometry based on proton density requires long repetition times to avoid the confounding effect of T1 relaxation time which, on the other hand, makes the method slow for in vivo use [Citation28].
Temperature-sensitive contrast agents
MRI contrast agents with temperature-sensitive properties can be used for temperature mapping. These contrast agents include spin-transition molecular materials, paramagnetic thermosensitive liposomes, and paramagnetic lanthanide complexes. The motivation for the development of these contrast agents lies within the confounding factors affecting MRI thermometry methods and the increasing demand for thermometry during ablative or hyperthermal treatments.
Paramagnetic thermosensitive liposomal contrast agents consist of a phospholipid membrane surrounding a gadolinium or manganese compound [Citation29]. The liposomes have a specific gel-to-liquid crystalline phase transition temperature below which water cannot permeate the phospholipid membrane. Thus, temperature increase above the phase transition temperature yields relaxation enhancement and absolute temperature can be measured at the phase transition temperature. These contrast agents have been studied in vivo in animals [Citation30].
Paramagnetic lanthanide complexes are compounds with chemical shifts severalfold higher than water 1 H shift. Complexes containing Pr3+, Yb3+ and Tm3+ can display up to 300-fold stronger temperature dependence compared to water 1 H signal [Citation31]. Furthermore, the 1 H shift of these contrast agents is unaffected by numerous confounding factors such as the contrast agent concentration, pH, and presence of ions or macromolecules [Citation32,Citation33]. The in vivo use of these tracers requires the validation of an acceptable dose and SNR [Citation31].
Spin-transition molecular materials switch from diamagnetic spin state of S = 0 to paramagnetic spin state S = 2 at a temperature specific to the chemical composition of the contrast agent [Citation34]. Spectroscopy, relaxometry, and imaging may be used in examining the susceptibility jump and R2* effect [Citation34]. Alternatively, the Curie Temperature of a ferromagnetic substance is the temperature where the substance loses net magnetization and becomes paramagnetic without an external magnetic field [Citation35]. Currently, these contrast agents have not yet been used in vivo.
In vivo use of temperature-sensitive MR contrast agents requires several factors, most notably nontoxicity and a homogenous accumulation in target tissues. To meet these requirements, further research is required before these contrast agents can be reliably and safely used. Thermosensitive liposomes have been used safely in animals [Citation36], but to our knowledge, the safety of any of the described contrast in human population has not been verified.
Magnetic resonance thermometry in practice
Magnetic resonance thermometry appears to be the ideal tool for temperature mapping tool among other imaging modalities [Citation37]. Magnetic resonance spectroscopy, temperature-sensitive contrast agents, and proton density can be used for absolute temperature measurements and relaxation times, diffusion, and imaging-based PRF can be used for relative temperature measurements [Citation9]. In vivo applications usually prefer PRFS method for thermometry, due to its excellent linearity and tissue type independence [Citation18]. A phantom study comparing PRFS, diffusion, and T1-based thermography concluded PRFS to be most accurate [Citation38]. A commercial MR-HIFU system is reported having a discrepancy of -0.7 ± 0.9°C between PRSF-based MR thermometry and thermocouple readings in a phantom study. The imaging sequence had a 2.5 × 2.5 mm2 voxel size, a 7 mm slice thickness and a 3.2 s temporal resolution [Citation39]. Corbett et al. reported that the in vivo accuracy of less than 1°C using proton magnetic resonance spectroscopy is easily attainable in the brain [Citation12]. In a recent article, Verius et al. speculate that it is not possible to achieve less than ± 0.5°C accuracy in absolute in vivo thermometry of the brain using current hardware and software [Citation40].
Magnetic resonance thermometry is clinically utilized by few commercial thermal ablation treatment systems, such as Sonalleve (Profound Medical, Mississauga, Ontario, Canada) [Citation41] and ExAblate (InSightec, Haifa, Israel) [Citation42]. Both systems produce real-time temperature maps during the treatment procedure [Citation41,Citation42].
In research, magnetic resonance thermometry has usually been performed using customized pulse sequences and the raw data have been transported offline to generate the thermal images [Citation20,Citation43,Citation44]. According to Quesson et al. [Citation9] radio-frequency (RF)-spoiled gradient echo sequences are used for PRFS-based thermometry imaging. Gradient echo is preferred over spin echo because the phase difference induced by the PRFS would be lost in refocusing spin echo sequences. On the other hand, the other MR thermometry methods prefer spin echo sequences over gradient-echo sequences because the phase-difference causes image artifacts as the phase-difference is not the primary interest in those methods [Citation9]. For spectroscopic thermometry, the default pulse sequences of an MRI system can be used as such. The frequency difference between water and a reference metabolite can be determined using an off-line software for magnetic resonance spectroscopy data analysis, such as jMRUI [Citation45] or TARQUIN [Citation46] both of which are free. For the results to be most accurate, calibration measurements are recommended [Citation40].
Ultrasonography
Along with MRI, ultrasound is currently one of the most studied thermometry imaging modalities. Ultrasound imaging utilizes high-frequency soundwaves usually between 2 and 15 MHz which are transmitted to the imaged body by a probe. The soundwaves travel in the tissue and deflect from boundaries between two different tissues. The soundwaves travel back to the probe and the signal from the returning soundwaves is used to form an image based on the time of each echo’s return and the intensity of the echo. Numerous ultrasound methods have been examined for tissue temperature measurement: change in ultrasound velocity, change in backscatter energy, and changes in shear modulus. represents some effects that temperature has on ultrasonography parameters.
Figure 4. The most important effects that temperature change has on ultrasound parameters. The change in the speed of sound appears as a shift of an echo, yet thermal expansion causes echo shifts as well [Citation139]. Attenuation arises from ultrasound absorption and scattering [Citation64]. The backscatter energy changes due to the change in the speed of sound and the density of sub-wavelength scatterers [Citation140]
![Figure 4. The most important effects that temperature change has on ultrasound parameters. The change in the speed of sound appears as a shift of an echo, yet thermal expansion causes echo shifts as well [Citation139]. Attenuation arises from ultrasound absorption and scattering [Citation64]. The backscatter energy changes due to the change in the speed of sound and the density of sub-wavelength scatterers [Citation140]](/cms/asset/c47842ba-9ecb-4d1b-aafb-85a915ae1805/ktmp_a_1769006_f0004_oc.jpg)
Ultrasonic time-of-flight
Ultrasound velocity depends on the temperature of the tissue [Citation47] and the concept of using changes in ultrasound velocity to estimate tissue temperature was introduced in 1979 [Citation48]. In most tissues, ultrasound velocity increases until 60°C and above that then decreases. In fact, ultrasound velocity is inversely associated with temperature. The principle of ultrasound thermometry is to measure the ultrasound velocity between the transmitter and receiver. The velocity is estimated based on the ultrasonic time-of-flight (UTOF) and the distance the ultrasound travels. The average temperature of the medium can then be calculated.
Thermal strain imaging
In addition to UTOF, temperature estimation may be performed with thermal strain imaging which uses the time-shift estimation of backscattered echoes induced by local changes in tissue temperature [Citation49]. The echo time-shift is affected by the temperature-dependence of ultrasound velocity in the tissue and the thermal expansion of the tissue. The temperature change of the tissue can be formulated as follows [Citation50]:
where ΔT(x,z) is temperature change in lateral location x and depth z, c(T0) is the initial ultrasound velocity at baseline temperature T0, α is the linear thermal expansion coefficient, β is the coefficient of the change in ultrasonic velocity with change in temperature and τ(x,z) is the time-shift of the echoes. The effect of the change in ultrasonic velocity is significantly higher than the effect of tissue thermal expansion when temperature increases are small in water-bearing tissues [Citation49]. Thus, temperature change can be further formulated as:
where k is a tissue-dependent coefficient and
Change in backscatter energy
The change in backscatter energy (CBE) is another method for ultrasound thermometry using pulse-echo ultrasound [Citation51]. The surrounding medium and the compressibility and density of a sub-wavelength scatterer affect the scattering cross-section. The compressibility of the scatterer changes with temperature resulting in a change in the scattering coefficient. The change in scattering properties can be estimated by measuring the change in backscattered power from the examined tissue during heating compared to the power at baseline [Citation52]. The backscatter coefficient from a random distribution of sub-wavelength scatterers can be formulated as:
where η is the backscatter coefficient at temperature T, ρ is the density, and c is the sound velocity in the medium [Citation51]. The backscatter energy for a plane wave propagating in the direction z can then be formulated as follows:
where α is the ultrasound attenuation coefficient in the medium at temperature T [Citation51].
Compared to the echo-shift method, CBE seems to have lower susceptibility to motion artifacts [Citation53]. In thermal strain imaging, Shah et al. achieved a lateral spatial temperature resolution of several millimeters and an axial resolution of below one millimeter [Citation54]. The kernel size is selected to balance SNR to spatial resolution as a smaller kernel gives higher spatial resolution while a larger kernel gives higher SNR. Spatial resolution is further affected by ultrasound frequency. Higher bandwidth results in better spatial resolution but lower penetration depth. Effective tissue penetration of ultrasound is generally thought to be 500 times the ultrasound wavelength and for 7 MHz the tissue penetration limit would then be 11 cm. Temporal resolution in thermal strain imaging can be as high as 500 Hz, being practically real-time [Citation55]. Temperature sensitivity of echo shift and backscatter energy ultrasound methods are approximately 0.05%/°C and 0.3 dB/°C, respectively [Citation56]. The temperature resolution of ultrasound is related to the applied motion algorithm [Citation57].
Shear wave thermometry
Shear wave thermometry employs the estimation of local tissue elasticity with shear wave imaging in two-dimensional mapping of tissue temperature [Citation58,Citation59]. The mechanical behavior of biological tissues is characterized by the bulk modulus K, being the inverse of tissue compressibility (κ = 1/K), and the shear modulus μ. Bulk modulus K varies very little in water-rich soft tissues and it remains relatively constant during changes in temperature being mostly affected by tissue molecular composition and mechanics. However, shear modulus μ differs largely between different tissues. Young’s modulus E, displaying tissue stiffness, can be then formulated as follows [Citation59]:
µ is strongly affected by the cellular and structural characteristics of the tissue. Therefore, changes in tissue structure, for instance coagulation, will also affect shear modulus-based thermometry. Using magnetic resonance elastography, Wu et al. showed tissue shear modulus to decrease reversibly between 20°C and 60°C, increase irreversibly around 60°C corresponding to denaturation temperature and increase reversibly during cooling after thermal damage [Citation60]. The irreversible shear modulus increase is due to collagen coagulation due to thermal ablation [Citation61].
Variation in tissue echogenicity
There is a low to moderate correlation between tissue echogenicity and temperature [Citation62] but this method is rarely used in comparison to UTOF and thermal strain-based ultrasound temperature measurements. Additionally, contrast in conventional B-mode ultrasound images varies also due to tissue coagulation and bubble formation when used during high-intensity-focused ultrasound (HIFU) treatment [Citation63].
Ultrasonic thermometry in practice
Boiling and cavitation during thermal ablation treatment may produce bubbles which cause acoustic shadowing hampering the use of ultrasound. Additionally, ultrasound thermometry methods are highly tissue-dependent and therefore limited to temperatures below 50°C [Citation64] whereas thermal ablation treatments usually heat tissue over 60°C [Citation1]. Ultrasound thermometry above 50°C is hindered by non-linear temperature dependencies of contrast parameters, tissue phase-transitions, and cavitation bubbles [Citation64]. Thus, non-thermometric ultrasound methods are used for therapy monitoring during HIFU ablation employing other acoustic phenomena and ultrasound thermometry is usable only in tissue hyperthermia [Citation64] where target tumor is heated to around 45°C [Citation65]. The clear advantages of ultrasound thermometry are the lack of ionizing radiation, the high temporal and spatial resolution, and adequate tissue penetration, the relatively low cost of the measurement, the wide availability of ultrasound equipment and the established clinical use of ultrasound thermometry. Commercially available thermography equipment and algorithms are available such as the Tissue Change Monitoring algorithm developed by Sanghvi et al. to be used as a quantitative tool for the real-time assessment of HIFU dose [Citation66] with the Sonablate HIFU system [Citation67] (Sonacare Medical Inc. USA). In research, the ultrasound thermometry hardware ranges from completely custom-made systems [Citation68,Citation69] into clinical ultrasound devices that have been used for acquisition of raw data which has been processed into thermal information on a separate system [Citation70–72].
Computed tomography
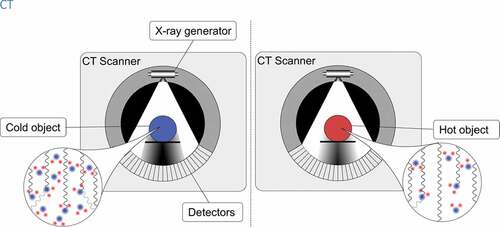
Computed tomography (CT) thermometry refers to tissue temperature measurement based on temperature-dependent change in CT number (Hounsfield unit, HU) in the region of interest of the examined tissue. CT imaging utilizes X-rays to form a three-dimensional image of the studied body within the scanning field. The examined body is placed inside a circular scanner. A heated cathode releases electrons which then emit photons in the X-ray wavelength toward the body in the scanner. A detector opposite to the X-ray source detects photons that have transmitted through the patient. The X-ray source and detectors inside the circular scanner rotate around the patient to obtain projections from different angles to provide three-dimensional planes of the scanned body as stacked images via reconstruction of the acquired imaging data. The difference between the photons absorbed by the body and the photons transmitted through the body is called attenuation. Attenuation is dependent on the density of the tissue and is commonly measured by HU which relates the tissue radiodensity to water which has an HU value of 0. Differences in HU between different tissues create the contrast in CT images. The HU value of tissue in voxel x,y in a given CT slice can be expressed as:
where µH2O is the linear attenuation coefficient for water and µ(x,y) is the linear attenuation coefficient for the tissue in voxel (x,y). CT calibration is usually performed at room temperature (T = 20°C) so that CT number for water at this temperature is set at 0 HU.
Temperature-dependence of CT number
Temperature dependence of water and biological tissue sample HU values was first described in 1979 by Bydder et al. [Citation73]. In CT imaging, attenuation is mostly due to Compton scattering. The probability of Compton interaction increases in relation to the effective electron density of the imaged tissue. Increase in tissue temperature results in thermal expansion of the tissue further resulting in decreased electron density and decreased attenuation. Thus, an increase in tissue temperature results in lower CT number in the examined tissue (see ). The phenomenon can be formulated as follows:
Figure 5. The density of an object affects directly how much radiation passes through the object
where ρ(T) is the density of the examined tissue at temperature T, ρ(T0) is the density of the examined tissue at CT calibration temperature T0 and α is the cubic thermal expansion coefficient of the examined tissue.
Furthermore, the relationship between tissue temperature T and linear attenuation coefficient µ of the examined tissue can be formulated as:
where µ(T) is the linear X-ray attenuation coefficient at temperature T, µ/ρ is the mass attenuation coefficient and ρ(T) is the density of the substance at temperature T.
Thus, the dependence of change in tissue CT number due to change in tissue temperature can be displayed as [Citation74]:
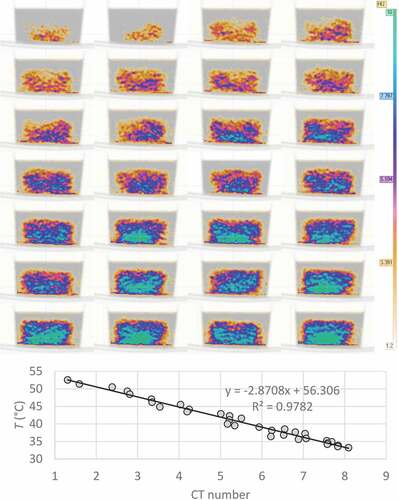
where ΔCT(T) is the change in CT number of the examined tissue at temperature T, CT(T0) is the CT number of the tissue at calibration or baseline temperature, α is the tissue cubic thermal expansion coefficient and ΔT is the temperature difference between T and T0. shows how CT number changes with temperature in a simple demonstration in which 300 ml of heated water was cooled down from 53°C to 33°C. A CT image was acquired every 2 minutes during the cooling.
Figure 6. A simple demonstration where 300 ml of heated water was cooled down from 53°C to 33°C. During the cooling, a CT image was acquired every 2 minutes and the temperature of the sample was measured with an external thermometer. Top: CT images of the water at different phases of cooling. The color scale has been set from 1.2 to 10 HU. A non-colored image of the container has been set on the background. Bottom: CT-numbers plotted against the temperature to show the correlation between CT-number and temperature
In water-containing tissues (i.e. muscle), Fallone et al. reported a change of about -0.45 HU per °C increase in tissue temperature [Citation75]. The relation between tissue CT number and tissue temperature is mostly linear in the examined temperature ranges as reported previously but the temperature-sensitivity depends on the tissue temperature and a linear model is poor in explaining CT number changes in a wide temperature range [Citation75,Citation76]. In a study by Schena et al., thermal sensitivity of ex vivo swine pancreas at temperature range of 0–20°C was -0.36 HU/°C, while between 20°C and 40°C sensitivity was -1.08 HU/°C and the quadratic model for temperature sensitivity in this study gave an R2 = 0.93, while the linear model had an R2 = 0.79 [Citation76]. Thus, CT number temperature-sensitivity is better described by a quadratic model in wide temperature ranges, while linear models can be used in narrow temperature ranges.
CT thermometry in practice
CT numbers vary significantly between multi-detector row CT scanners depending on the manufacturer, generation of the scanner, and different combinations of scanner and convolution kernel [Citation77]. Bruners et al. studied scanner-associated factors affecting the performance of CT thermometry in CT phantoms revealing that CT number standard deviation correlated directly with tube current-time product, tube voltage, and slice thickness and inversely with collimation thickness [Citation78]. Thus, temperature measurements with CT should be calibrated for the individual scanner with a phantom and simultaneous temperature measurement with another method. Moreover, Fallone et al. showed that larger regions of interest in CT thermometry give lower reproducibility in area-averaged CT number [Citation75]. Additionally, CT number temperature sensitivity varies tissue-specifically as reported previously [Citation76,Citation79,Citation80] which has to be taken into account in thermal mapping involving different tissue types and heterogeneous organs. The use of CT thermography in humans is limited due to radiation exposure and the existence of alternative non-radiating imaging modalities. The radiation exposure can be neglected in postmortem or in vitro thermography but not in human in vivo studies. However, the development of CT technology, the concomitant reduction in radiation doses may render CT thermometry more useful in the future. Furthermore, CT thermometry can be used in adipose tissue where MR thermometry is less reliable [Citation81].
Part 2. Near-infrared spectroscopy, microwave radiometry, and photoacoustic thermometry
In this section, we cover promising thermometry methods which utilize imaging modalities that may not be so widely used as MRI, ultrasound, and CT. These methods include near-infrared spectroscopy, microwave radiometry, and photoacoustic thermometry which all share the characteristic of being relatively small portable devices available for bedside use.
Near-infrared spectroscopy
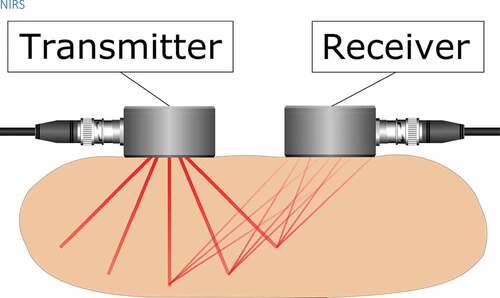
Tissue penetration of electromagnetic radiation is dependent on wavelength. Ultraviolet radiation, visible light, and infrared radiation have poor tissue penetration and are not suitable for imaging of deep tissues. Near-infrared radiation (NIR) transmits easily through tissues as it is not strongly absorbed by water and hemoglobin and the tissue transport is mostly affected by scattering [Citation82]. Near-infrared spectroscopy (NIRS) is a noninvasive imaging method of subcutaneous tissues most commonly used in brain imaging, see for a schematic illustration. As a spectroscopic method, biomedical NIRS utilizes electromagnetic radiation in the 700–1000 nm wavelength region (near-infrared). Temperature-dependent changes in NIR absorption spectra of water were observed already in 1925 by Collins [Citation83]. When water temperature increases, the water NIR spectral peaks blue-shift with a simultaneous increase in intensity and narrowing of the peaks [Citation83,Citation84]. These changes are due to the temperature-dependent changes in intermolecular hydrogen bonding. Thus, the observation of water NIR spectral peak can be used to measure temperature in water-containing tissues. The water spectral peaks at 740, 840, and 970 nm have been widely used for tissue temperature estimation in previous studies [Citation85–87]. These water absorption peaks increase in amplitude by around 0.8 %/°C and the wavelength decreases with increasing temperature [Citation88].
Figure 7. A near-infrared light source transmits light into the target tissue and an optical receiver detects the light reflected from the tissue. Tissue temperature can be estimated based on the temperature-dependence of the water absorption spectrum
NIRS can be performed with three different methods: continuous wave (CW), frequency-domain and time-resolved methods [Citation82]. CW spectroscopy with a constant intensity light source yielded a standard error of around 1.2°C for the recovered temperature in an adult forearm [Citation88]. A combination of frequency-domain and CW techniques in intralipid phantoms and human breast reached a mean difference of 1.1 ± 0.9°C between the optical measurement and thermistor control over a range of 28–48°C [Citation87]. Time-resolved NIRS measurement on piglet in-vivo brain tissue showed a mean difference of 0.5 ± 1.6°C between NIRS and implanted thermocouple measurements [Citation89]. Additionally, time-resolved NIRS has the ability to differentiate early-arriving photons from late-arriving ones to provide better depth sensitivity compared to CW and frequency-domain techniques [Citation89]. Temperature measurement results can be improved by accounting for scattering and more temperature contrast can be achieved by using the water peak at 970 nm which would limit the light penetration in the tissue [Citation88].
Near-infrared spectroscopy in practice
Spectrophotometers consist of a NIR source connected to an optical sensor separated by the source-detector distance and a light detection microprocessor. During measurement, the NIR source and sensor are placed on the skin above the measurement area. During measurement, the light source emits photons of the NIR wavelength into the target tissue, and the frequency-specific absorption of NIR is measured by the microprocessor using the spectral data acquired by the optical detector. The temporal resolution of NIRS is between 0.01 and 100 seconds [Citation90]. Studies with NIRS have reached a tissue penetration of around 2–3 cm below the skin [Citation91,Citation92]. However, the spatial resolution of NIRS is only 1–3 cm, and in cerebral imaging NIRS, penetration depth is limited to the upper 1 cm of the cerebral cortex [Citation93]. In vivo use of NIRS has been limited by poor spatial resolution which can be improved with high-density NIRS systems with signal acquisition at multiple source-detector distances [Citation94]. Source-detector distance has also been shown to affect NIRS depth resolution. Higher light source intensity and source-detector distance increase NIRS tissue penetration [Citation95] but high source-detector distance also hinders effective transmission and reception of NIR signals [Citation96]. Nonetheless, the small size of the NIRS equipment, the noninvasive nature of the measurement, and the short duration of the measurement make NIRS a viable method for tissue temperature monitoring in a bedside setting for example brain temperature monitoring during hypothermia therapy [Citation86]. However, in an in vivo study with new-born piglet brains under induced hypothermia, the offset of mean NIRS temperature to thermistor readings was only 0.5°C, the standard deviation of 1.6° lead to unacceptable wide limits of agreement [Citation85].
Holper et al. described prediction of brain tissue temperature measured with NIRS obtained during hypothermia in new-born piglets and rewarming in new-born infants [Citation97]. NIRS is an effective bedside tool to monitor brain perfusion changes in term asphyxiated new-borns [Citation98] and it has been shown to be an important predictor of short-term outcome in neonates with hypoxic-ischemic encephalopathy [Citation99] though NIRS thermometry was not used in these studies, the interest being in perfusion. To our knowledge, there are no commercial NIRS systems specifically marketed to be used in thermography in vivo.
Microwave radiometry
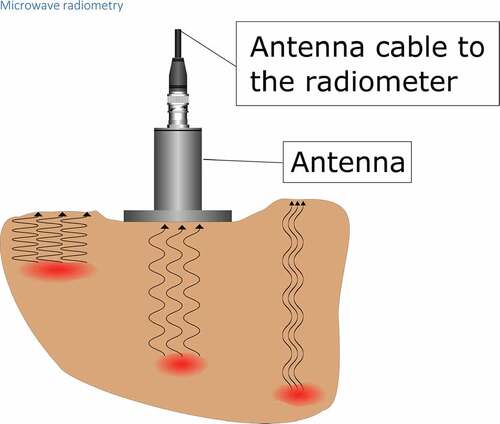
In 1974, Edrich et al. [Citation100] and Enander et al. [Citation101] suggested that internal body temperatures could be measured by a radiometer measuring millimeter wavelength thermal noise signals. A microwave radiometer is a passive receiver measuring the intensity of thermally generated microwave electromagnetic noise by all substances with a temperature above 0 K. The intensity of the microwave noise signal correlates directly with the absolute temperature of the target tissue [Citation102]. The antenna of the radiometer device is placed on the surface of the body above the target tissue to perform the measurement of the deep temperature (see ). The microwave radiation received by the antenna is then converted to absolute temperature based on the weighted average of the radiation pattern of the target material [Citation103]. The advantage of microwaves over infrared radiation is the higher tissue penetration of radio waves with high wavelength: while infrared has poor penetration and can be used to measure only the surface temperature, radio waves penetrate several centimeters of subcutaneous tissue and can be used to measure internal tissue temperature. The power P of the radio length radiation of the examined tissue can be described as:
Figure 8. In microwave radiometry, a passive receiver measures the intensity of thermally generated microwave electromagnetic noise. The measurement depth can be altered by changing the frequency of the receiver as lower frequencies originate from deeper tissues
where P is the microwave signal power, k is the Boltzmann constant, T is the temperature of the tissue, Δf is the frequency band of the radiometer, and R is the reflection coefficient of the radiometer antenna.
The brightness temperature measured by the radiometer can be formulated as [Citation104]:
where T( is the brightness temperature emitted by the lossy body,
is the weighted near-field radiation pattern of the receiving antenna.
is the spatial variable in the 3D volume of the lossy body which confines the radiation pattern of the antenna.
The temperature sensitivity of radiometer with depth depends on the temperature difference between the target tissue and the surrounding medium as low-temperature gradients further away from the antenna are masked by the weighted volume averaging process [Citation103]. Accuracy of radiometer thermometry is affected by microwaves and radiofrequency radiation in the vicinity and these interfering signals need to be filtered out to improve the accuracy of the temperature measurement [Citation105]. The penetration depth in the human body is higher with lower frequencies, while spatial resolution increases with higher frequencies. Radiometers used in medical applications usually have the frequency range of 1–6 GHz [Citation106]. The frequency band is chosen based on depth and spatial resolution of the desired measurement. Klemetsen et al. have optimized the frequency band of their radiometer at 3.25–3.75 GHz giving a compromise between spatial resolution and sensing depth in lossy tissue and recommending the frequency band around 3.5 GHz as a quiet band less affected by electromagnetic interference [Citation107].
Microwave radiometry in practice
As an example of radiometer thermometry systems, the RTM-01-RES microwave computer-based system (Bolton, United Kingdom) has a radiometer antenna with a 3.9 cm diameter able to measure microwave radiation with a frequency of 2–5 GHz. The system has a measurement time of 8 seconds, measurement depth of 3–7 cm, rectangular volume of interest of 3 cm in width, 2 cm in length, and 3–7 cm in depth (depending on tissue water content), and an internal temperature accuracy of ± 0.20°C in the temperature range of 32–38°C filtering all microwave and radiofrequency signals from the environment to avoid signal interference and the system has been used in studying peripheral arterial disease [Citation108] and local inflammation of atherosclerotic plaques [Citation109]. However, in a study of subclinical synovial inflammation, RTM-01-RES system reported unexpectedly low intra-articular knee temperatures [Citation110]. Additionally, an in vivo study of intermediate lesions of human carotid arteries reported thermal heterogeneity (maximum carotid temperature minus minimum) instead of absolute temperatures [Citation111]. Other medical applications for microwave thermometry have been the detection of breast cancer [Citation112] and measurement of vesicoureteral reflux [Citation113] but these studies did not present temperature measurements from clinical cases. Brain temperature was also measured in a brain phantom and in vivo in a young boy under transient hypothermia although in the latter there was an almost parallel course of temperature on the forehead and in the nasopharynx during hypothermia induction which may question the observation of a higher brain than rectal temperature [Citation114]. Outside of research, radio wave thermometry is currently rarely used in regular clinical applications. Studies of breast cancer have suggested that it may be beneficial to include microwave thermometry in screening programs and in examination of patients with breast pathologies [Citation115]. However, based on the previously mentioned studies, it is not possible to determine the uncertainty of microwave-derived internal temperatures and further research is warranted.
Photoacoustic thermometry
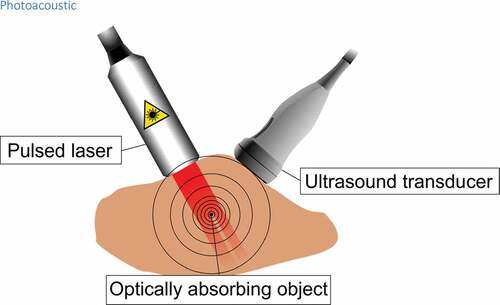
Photoacoustic (also known as optoacoustic) method is one application of electromagnetic-acoustic methods in which electromagnetic radiation is transmitted into a medium which absorbs the photons. The absorption causes a local temperature rise and creates a pressure wave propagating through the medium. The wave can be detected at the surface of the medium using a piezoelectric sensor (see ) [Citation116]. The amplitude of the wave is proportional to the temperature of the object [Citation117]. Electromagnetic-acoustic methods are classified by the used electromagnetic radiation some of which are microwave-induced thermoacoustics, and X-ray induced thermoacoustics. There are diverse electromagnetic-acoustic applications on different fields, but thermometry is most commonly performed using the light-induced photoacoustic method [Citation116].
Figure 9. A pulsed laser light travels through tissue in which optically absorbing substance, such as hemoglobin absorbs the energy of the light. This makes the temperature of the object rise rapidly and the object experiences a thermoelastic expansion. This in turn creates a shockwave which travels through the tissue and can be detected at the surface with a piezoelectric sensor such as in an ultrasound transducer
Photoacoustic measurement can be performed either by using a continuous-wave light source or short-pulsed laser [Citation118]. Continuous-wave method is more affordable utilizing intensity-modulated laser diodes making the system also more compact and less power-consuming [Citation119,Citation120]. The drawback is that the thermal diffusion waves which are created in the continuous-wave method decay very rapidly and thus the penetration depth is limited [Citation118].
Short-pulsed method utilizes sophisticated lasers capable of producing spectrally pure, stabile, and, most importantly, very short-pulsed light which allows the photoacoustic detection to occur via thermoelastic expansion [Citation116].
For the thermoelastic expansion to occur the pulse duration must meet two conditions: first it must be shorter than the acoustic confinement time which is the time needed for the acoustic wave to exit the heated region and second, it must be so short that the thermal diffusion length becomes negligible (thermal confinement time) [Citation121].
The pressure rise which propagates through the sample and can be detected at the sample boundary by an ultrasonic transducer can be written as:
where is Γ the Grüneisen coefficient and Ae is the volumetric optical absorption. The Grüneisen coefficient is proportional to the material’s coefficient of thermal expansion and inversely proportional to isothermal compressibility, mass density, and specific heat capacity of the material [Citation118].
Unlike thermal diffusion, the ultrasonic wave does not attenuate significantly and scatters several magnitudes less than pure optical imaging [Citation118,Citation121].
The isothermal compressibility is inversely proportional to speed of sound. It is also known that the volume expansion coefficient β and speed of sound vs are linearly proportional to temperature for water-based and fatty tissues between 10°C and 55°C. Thus, change in the Grüneisen coefficient is proportional to change in temperature. And as the Grüneisen coefficient and the photoacoustic signal, i.e. the local pressure rise Δp0 are related (EquationEquation 27(27)
(27) ), the photoacoustic signal can be used for sensing temperature change with the following relationship:
where a is experimentally determined tissue-specific constant [Citation54].
The maximum measurement depth is primarily defined by the penetration depth of the light photons [Citation121]. The penetration depth depends on the power of the laser [Citation122] which is limited to 20 mJ/cm2 by American National Standards Institute (ANSI) [Citation123]. However, below the maximum penetration depth, the measurement depth can be adjusted by changing the frequency of the ultrasound transducer as the attenuation of the ultrasound increases with the ultrasound frequency. Therefore, adjusting the center frequency of the ultrasound transducer lower enables greater measurement depth. This, however, comes at the cost of resolution [Citation121]. Typically, the resolution is typically 1/200 of the measurement depth which can reach up to 7 cm [Citation124].
Most commonly used optically absorbing substances in biological tissues are oxyhemoglobin and deoxyhemoglobin but also DNA, RNA, water, melanin, and lipids can be used. Also, small molecule dyes have been used as contrast media. The absorption of a substance depends on the wavelength of the light which is usually within the visible or near-infrared region [Citation116,Citation125].
Photoacoustic effect has been utilized in several biomedical applications, for example in clinical imaging [Citation125], preclinical tomography, molecular imaging, and flowmetry [Citation116].
Photoacoustic thermometry in practice
The formula 28 allows only the measurement of temperature change. However, methods for absolute temperature measurement have also been developed. Simplest way is to calibrate the photoacoustic system measuring the correlation between the change in photoacoustic signal and the temperature with an independent thermometer in an ex-vivo sample [Citation126]. Another way is to measure the arrival time of the acoustic wave. Together with the amplitude of the photoacoustic wave, they reveal the absolute temperature at the target since the speed of sound is also temperature dependant [Citation127]. Recently Zhou et al. published a method in which the target is irradiated with a rapid burst of laser pulses and the photoacoustic signal from each one is measured. As each laser pulse heats the target, the amplitude of the signal is different in each pulse. A mathematical model using the time-course of the pulse amplitudes was developed to calculate the Grüneisen parameter and the absolute temperature of the target [Citation128]. The methods can be used not only to measure a single point but are also incorporated into temperature imaging using mechanical scanning or linear array transducers [Citation117,Citation126,Citation128,Citation129]. Because photoacoustic signal detection and reconstruction are done similarly as on an ultrasound system, modified clinical ultrasound transducers can be used for photoacoustic thermal imaging [Citation122,Citation130].
We are not aware of any photoacoustic thermometers in clinical use currently. Most of the studies utilizing the technique are performed on phantoms or ex-vivo tissue samples [Citation117,Citation122,Citation126,Citation127]. In these studies, temperature precision has been below 1°C and axial resolution few hundred micrometers with penetration depth below 15 mm. Recently invivo studies have emerged, in combination with a HIFU system [Citation128,Citation131] and also with a cryotherapy system [Citation130]. In the study of Kim et al. the readings of the photoacoustic thermometer were compared against the readings of a thermocouple. The authors reported that most of the photoacoustic thermometry data were within the ±10% error boundary of trend line of the total data [Citation131]. In a previous study, the same system was reported having an axial resolution of 205 ± 45 μm, lateral resolution of 1.20 ± 0.14 mm, and maximum measurement depth of 4.6 cm [Citation122]. In the study of Zhou et al., the authors reported an axial resolution of 400 μm and 1 mm elevational resolution. The average measurement error of their system was 0.9°C when compared against a thermocouple at 1.5 cm depth [Citation128]. In the study of Petrova et al. the authors reported a measurement error less than ±2°C when measuring temperature of a canine prostate using an endorectal ultrasound transducer at the depth of 10 mm during cryotherapy [Citation130].
Utilizing the methods into in vivo applications is challenging for many reasons. The calibration-based thermometry assumes all tissue to have similar properties which is not true, for example in the case of tissue coagulation during thermal ablation [Citation129,Citation131]. Also, the movement of the subject causes errors especially in arrival time-based absolute thermometry. Importantly, not all tissues include optically absorbing substance for acquiring photoacoustic signal [Citation131].
Discussion
We have now introduced several imaging methods to assess internal temperature in vivo. These imaging modalities can be compared based on their spatial resolution, tissue penetration depth, availability, cost, harm to target tissue, feasibility, and bedside usage. These specifications for each evaluated imaging method are displayed in .
Table 1. Comparison of internal temperature imaging methods
Table 2. List of technical terms
The examined imaging modalities provide either absolute temperature values or relative values (). MRI and microwave radiometry can provide absolute temperature values, whereas other methods can provide only relative temperature values. The intended purpose of temperature acquisition dictates whether an absolute temperature value is warranted or if a relative value suffices. Moreover, the imaging-acquired temperature values may differ from a direct temperature measurement done with a thermistor or have a high standard deviation as discussed above for example regarding NIRS [Citation85]. Moreover, the resolution of temperature sensitivity for some imaging methods may be higher than the actual change in tissue temperature. Thus, small changes in tissue temperature may not be detected due to low-temperature sensitivity or spatial resolution. The measurement of deep tissue temperature requires that the selected imaging method has a relatively high tissue penetration. From the examined imaging methods, only MRI, CT, and ultrasonography have high tissue penetration, while the methods discussed in Part 2 had low tissue penetration thus also limiting their use in deep thermometry.
MRI and CT are widely available, but their costs are high. Whereas NIRS, microwave radiometry, and photoacoustic thermometry have moderate costs, but they are not widely available. In this point of view, ultrasonography is the most attractive option due to its moderate cost and wide availability. MRI, ultrasonography, and CT can be implemented into current clinical equipment with a specialized software, but only ultrasonography is applicable for bedside use. NIRS, microwave radiometry, and photoacoustic thermometry are applicable for bedside use, but they are not implementable into current clinical equipment ().
Radiation exposure is the obvious weakness of CT thermometry compared to the other imaging modalities examined in this review. None of the other described methods expose the examined tissue to ionizing radiation. Furthermore, examining changes in temperature would also require several consecutive CT scans further increasing the radiation dose in the target area.
The main advantages of CT thermometry compared to other methods such as ultrasound and MRI are the wide availability of CT scanners and the high temporal (83–135 ms) and spatial resolution (0.5–0.625 mm) [Citation132]. Tissue HU values may reflect not only the tissue temperature but also changes for example in tissue structure (e.g. tumors, necrosis, cirrhosis) and perfusion. Additionally, CT number changes in CT thermometry during thermal ablation treatment may be partially due to tissue coagulation in target areas or bleeding caused by the ablation catheters. Therefore, knowledge of underlying physiology should be taken into consideration when CT imaging is used in tissue temperature measurement to account for confounding factors affecting HU value changes during changes in external or tissue temperature. CT thermometry may be additionally hampered by the CT artifacts caused by metal equipment (catheters, etc.), while the CT artifacts can be somewhat corrected with iterative techniques [Citation133]. Metal artifacts due to radiofrequency ablation equipment are also negligible since all commercially available RF systems are compatible with modern CT scanners. Heat-induced changes like protein coagulation affect the motility of water which further can lead to large changes in the diffusion coefficient. During thermal ablation, there can be an increase in diffusion due to increasing temperature but also a simultaneous decrease in diffusion due to protein coagulation [Citation18]. Quantification of temperature changes with T1 effects can be seriously affected by the physiologic response of living tissue to heat [Citation24] and nonlinear effects can occur due to coagulation [Citation134]. PRF phase mapping is not affected by tissue changes and can thus be used during thermal ablation for thermometry although the method cannot be used to measure temperature in lipids [Citation18]. Microwave radiometry has been examined as a thermometry method during thermal therapy in phantom studies [Citation135,Citation136] though no in vivo studies have been performed, while photoacoustic thermometry has been used in in vivo studies in combination with a HIFU system [Citation128,Citation131]. However, NIRS has not been used in monitoring deep tissue temperature during coagulative treatments.
Several imaging modalities are affected by the change in tissue density such as ultrasound, CT, and photoacoustic thermometry as discussed previously. Therefore, changes in tissue density will undoubtedly affect the measured change in tissue temperature if the change in density cannot be accounted for. The most common clinical use of internal thermometry in vivo is the monitoring of tissue temperature during thermal therapy. However, thermal ablation can result in tissue coagulation permanently altering the physical characteristics of the tissue.
In studies of tissue thermogenesis, there are certain requirements for the imaging modality such as high-temperature sensitivity, spatial resolution, and short imaging time. Further requirements are set for the imaging modality if the temperature measurement must be performed during physical activity for example during the measurement of skeletal muscle temperature. Portable imaging equipment capable of bedside monitoring (such as ultrasound, NIRS, microwave radiometry, and photoacoustic thermometry) are more applicable to these studies rather than MRI and CT imaging which would require that the exercise is performed inside the scanner or near vicinity. Additionally, physical exercise would hamper the measurement with movement artifacts if the measurement was performed simultaneously with the exercise.
As discussed previously, several imaging methods may give absolute tissue temperatures with low correlation with direct tissue temperature measurement with thermometer or the method may not even give absolute temperature values but relative temperatures.
In the future, magnetic resonance thermometry will possibly remain the most popular thermometry method not least because of all the other anatomical and physiological information MRI can provide during the same scanning session. As imaging sequences develop the method will most likely become faster, less sensitive to subject motion, and achieve higher resolution. These developments would make for example HIFU treatments safer and more accurate. The use of contrast media will probably overcome the small temperature proportionality of the PRFS (0.01 ppm/°C) and thus make the thermometry more sensitive. Currently, the routinely used PRFS imaging-based thermography provides only relative temperature data. In the future, we may see multiparametric imaging sequences which could combine several sequences in order to create absolute thermometry maps. Future in HIFU thermal ablation point of view, thermometry with ultrasound remains especially attractive due to its high tissue penetration, wide availability, feasibility, and moderate cost. However, there are many technical and physical challenges before ultrasound thermometry can be used routinely during thermal ablation. Although CT utilizes ionizing radiation, the radiation doses always become smaller as newer generation scanners are introduced [Citation137]. Due to its superior imaging speed, CT imaging will certainly remain in clinical use for a long time. As machine learning algorithms already detect pathologies from CT images [Citation138] in the future they might extract several parameters, such as temperature, from a single dataset or even several multimodal datasets. NIRS, microwave radiometry, and photoacoustic imaging will most likely become routine clinical tools in the future because of their portability, potentially low cost, and promising applications one of which is thermometry. One can speculate that the modalities could even be incorporated into wearable health sensors as the electronics become smaller and smaller.
Conclusions
Imaging modalities for measuring internal temperatures in vivo can be evaluated by the spatial and temporal resolution, temperature sensitivity, and the availability of hardware and software.
Thermography and thermometry can be used clinically to measure internal tissue temperatures during thermal ablation, hyperthermia treatments, and hypothermia therapy.
Future potential clinical targets for thermometry and thermography may include imaging of inflammation, tumors, and vesicoureteral reflux.
The most studied and clinically most widespread modalities are MRI and ultrasound.
CT thermography is limited by the ionizing radiation exposure although it has high spatial and temporal resolution and CT scanners are widely available.
NIRS, microwave radiometry, and photoacoustic thermometry are promising imaging modalities for measuring internal temperatures, but further research and development is still required before they can be widely clinically used.
List of abbreviations
| CBE | = | Change in Backscatter Energy |
| CT | = | Computed Tomography |
| CW | = | Continuous Wave |
| dB | = | Decibel |
| HIFU | = | High-Intensity Focused Ultrasound |
| HU | = | Hounsfield Unit |
| MR | = | Magnetic Resonance |
| MRI | = | Magnetic Resonance Imaging |
| MRS | = | Magnetic Resonance Spectroscopy |
| NIR | = | Near-Infrared Radiation |
| NIRS | = | Near-Infrared Resonance Spectroscopy |
| PPM | = | Parts per million |
| PRF | = | Proton Resonance Frequency |
| PRFS | = | Proton Resonance Frequency Shift |
| RF | = | Radio frequency |
| SNR | = | Signal-to-Noise Ratio |
| UTOF | = | Ultrasonic Time-Of-Flight |
| VFA | = | Variable Flip Angle |
Acknowledgments
J. Raiko was supported by research grants from the Outpatient Care Research Foundation, TYKS Foundation, Aarne Koskelo Foundation and Päivikki and Sakari Sohlberg Foundation. K. Koskensalo was supported by Instrumentarium Science Foundation.
Disclosure statement
We declare no conflicts of interest.
Additional information
Funding
References
- Zhou YF. High intensity focused ultrasound in clinical tumor ablation. World J Clin Oncol. 2011;2(1):8–27.
- Rossi S, Zanier ER, Mauri I, et al. Brain temperature, body core temperature, and intracranial pressure in acute cerebral damage. J Neurol Neurosurg Psychiatry. 2001;71(4):448–454.
- Shellhaas RA, Thelen BJ, Bapuraj JR, et al. Limited short-term prognostic utility of cerebral NIRS during neonatal therapeutic hypothermia. Neurology. 2013;81(3):249–255.
- Law J, Chalmers J, Morris DE, et al. The use of infrared thermography in the measurement and characterization of brown adipose tissue activation. Temperature. 2018;5(2):147–161. doi:10.1080/23328940.2017.1397085
- Zaretsky DV, Romanovsky AA, Zaretskaia MV, et al. Tissue oxidative metabolism can increase the difference between local temperature and arterial blood temperature by up to 1.3°C: implications for brain, brown adipose tissue, and muscle physiology. Temperature. 2018;5(1):22–35. doi:10.1080/23328940.2018.1437311.
- Frich L. Non-invasive thermometry for monitoring hepatic radiofrequency ablation. Minim Invasiv Ther Allied Technol. 2006;15(1):18–25.
- Odéen H, Parker DL. Magnetic resonance thermometry and its biological applications - Physical principles and practical considerations. Prog Nucl Magn Reson Spectrosc. 2019;110:34–61.
- Schneider WG, Bernstein HJ, Pople JA. Proton magnetic resonance chemical shift of free (gaseous) and associated (liquid) hydride molecules. J Chem Phys. 1958;28(4):601–607.
- Quesson B, de Zwart JA, Moonen CT. Magnetic resonance temperature imaging for guidance of thermotherapy. J Magn Reson Imaging. 2000;12(4):525–533.
- Hindman JC. Proton resonance shift of water in the gas and liquid states. J Chem Phys. 1966;44 (12):4582–4592.
- Kuroda K. Non-invasive mr thermography using the water proton chemical shift. Int J Hypothermia. 2005; 21 (6):547–560.
- Corbett RJT, Laptook AR, Tollefsbol G, et al. Validation of a noninvasive method to measure brain temperature In Vivo using 1H NMR spectroscopy. J Neurochem. 1995;64(3):1224–1230.
- Koskensalo K, Raiko J, Saari T, et al. Human brown adipose tissue temperature and fat fraction are related to its metabolic activity. JCEM. 2017;102(4):1200–1207.
- Winter L, Oberacker E, Paul K, et al. Magnetic resonance thermometry: methodology, pitfalls and practical solutions. Int J Hyperthermia. 2016;32(1):63–75.
- Bloch F. Nuclear induction. Phys Rev. 1946;70(7–8):460474.
- Bloembergen N, Purcell EM, Pound RV. Relaxation effects in nuclear magnetic resonance absorption. Phys Rev. 1948;73(2):679–712.
- Parker DL. Applications of NMR imaging in hyperthermia: an evaluation of the potential for localized tissue heating and noninvasive temperature monitoring. IEEE T Bio-med Eng.1984; 31 (1):161–167.
- Rieke V, Butts Pauly K. MR thermometry. J Magn Reson Imaging. 2008;27(2):376–390.
- Bottomley PA, Foster TH, Argersinger RE, et al. A review of normal tissue hydrogen NMR relaxation times and relaxation mechanisms from 1–100 MHz: dependence on tissue type, NMR frequency, temperature, species, excision, and age. Med Phys. 1984;11(4):425–448.
- Baron P, Ries M, Deckers R, et al. In vivo T2 -based MR thermometry in adipose tissue layers for high-intensity focused ultrasound near-field monitoring, Magn. Reson Med. 2014;72(4):1057–1064.
- Ozhinsky E, Kohi MP, Ghanouni P, et al. T2-based temperature monitoring in abdominal fat during MR-guided focused ultrasound treatment of patients with uterine fibroids. J Ther Ultrasound. 2015;3:1–10.
- Le Bihan D, Delannoy J, Levin RL. Temperature mapping with MR imaging of molecular diffusion: application to hyperthermia. Radiology. 1989;171(3):853–857.
- Grossman RI, Gomori JM, Ramer KN, et al. Magnetization transfer: theory and clinical applications in neuroradiology. Radiographics. 1994;14(2):279–290.
- Young IR, Hand JW, Oatridge A, et al. Modeling and observation of temperature changes in vivo using MRI. Magn Reson Med. 1994;32(3):358–369.
- Kamimura Y, Amemiya Y. An NMR technique for non‐invasive thermometry using M0 as the temperature‐sensitive parameter. Automedica. 1987;8(4):295–313.
- Abragam A. The principles of the nuclear magnetism. International series of monographs on physics. Vol. 32. New York: Oxford University Press; 1983.
- Chen J, Daniel BL, Pauly KB. Investigation of proton density for measuring tissue temperature. J Magn Reson Imaging. 2006;23(3):430–434.
- Gultekin DH, Gore JC. Temperature dependence of nuclear magnetization and relaxation. J Magn Reson. 2005;172(1):133–141.
- Fossheim SL, Il’yasov KA, Hennig J, et al. Thermosensitive paramagnetic liposomes for temperature control during MR imaging-guided hyperthermia: in vitro feasibility studies. Acad Radiol. 2000;7(12):1107–1115.
- McDannold N, Fossheim SL, Rasmussen H, et al. Heat-activated liposomal MR contrast agent: initial in vivo results in rabbit liver and kidney. Radiology. 2004;230(3):743–752.
- Hekmatyar SK, Kerkhoff RM, Pakin SK, et al. Noninvasive thermometry using hyperfine-shifted MR signals from paramagnetic lanthanide complexes. Int J Hyperthermia. 2005;21(6):561–574.
- Hekmatyar SK, Poptani H, Babsky A, et al. Non-invasive magnetic resonance thermometry using thulium-1,4,7,10-tetraazacyclododecane-1,4,7,10-tetraacetate (TmDOTA(-)). Int J Hyperthermia. 2002;18(3):165–179.
- Zuo CS, Mahmood A, Sherry AD. TmDOTA: a sensitive probe for MR thermometry in vivo. J Magn Reson. 2001;151(1):101–106.
- Muller RN, Vander Elst L, Laurent S. Spin transition molecular materials: intelligent contrast agents for magnetic resonance imaging. J Am Chem Soc. 2003;125(27):8405–8407.
- Settecase F, Sussman M, Roberts T. A new temperature-sensitive contrast mechanism for MRI: curie temperature transition-based imaging. Contrast Media Mol Imaging. 2007;2(1):50–54.
- Frich L, Bjornerud A, Fossheim S, et al. Experimental application of thermosensitive paramagnetic liposomes for monitoring magnetic resonance imaging guided thermal ablation. Magn Reson Med. 2004;52(6):1302–1309.
- de Senneville BD, Quesson B, Moonen CTW. Magnetic resonance temperature imaging. Int J Hyperthermia. 2005;21(6):515–531.
- Wlodarczyk W, Boroschewski R, Hentschel M, et al. Three-dimensional monitoring of small temperature changes for therapeutic hyperthermia using MR. JMRI. 1998;8(1):165–174.
- Tillander M, Hokland S, Koskela J, et al. High intensity focused ultrasound induced in vivo large volume hyperthermia under 3D MRI temperature control. Med Phys. 2016;43(3):1539–1549.
- Verius M, Frank F, Gizewski E, et al. Magnetic resonance spectroscopy thermometry at 3 tesla: importance of calibration measurements. Ther Hypothermia Temp Manag. 2019;9(2):146–155.
- Thiburce AC, Frulio N, Hocquelet A, et al. Magnetic resonance-guided high-intensity focused ultrasound for uterine fibroids: mid-term outcomes of 36 patients treated with the Sonalleve system. Int J Hyperthermia. 2015;31(7):764–770.
- Dick EA, Gedroyc WMW. ExAblate® magnetic resonance-guided focused ultrasound system in multiple body applications. Expert Rev Med Devices. 2010;7(5):589–597.
- Jonathan SV, Grissom WA. Volumetric MRI thermometry using a 3D stack-of-stars echo-planar imaging pulse sequence. Magn Reson Med. 2018;79(4):2003–2013.
- Todd N, Diakite M, Payne A, et al. In Vivo evaluation of multi-echo Hybrid PRF/T1 approach for temperature monitoring during breast MR-guided focused ultrasound surgery treatments. Magn Reson Med. 2014;72(1):793–799.
- Stefan D, Di Cesare F, Andrasescu A, et al. Quantitation of magnetic resonance spectroscopy signals: the jMRUI software package. Meas Sci Technol. 2009;20(10):1–9.
- Wilson M, Reynolds G, Kauppinen RA, et al. A constrained least-squares approach to the automated quantitation of in vivo 1H magnetic resonance spectroscopy data. Magn Reson Med. 2011;65(1):1–12.
- Bamber JC, Hill CR. Ultrasonic attenuation and propagation speed in mammalian tissues as a function of temperature. Ultrasound Med Biol. 1979;5(2):149–157.
- Nasoni RL, Bowen T, Connor WG, et al. In vivo temperature dependence of ultrasound speed in tissue and its application to noninvasive temperature monitoring. Ultrason Imag. 1979;1(1):34–43.
- Maass‐Moreno R, Damianou CA. Noninvasive temperature estimation in tissue via ultrasound echo‐shifts. Part I. Analytical model. J Acoust Soc Am. 1996;100(4):2514–2521.
- Simon C, VanBaren P, Ebbini ES. Two-dimensional temperature estimation using diagnostic ultrasound. Ultrason Ferroelectric Freq Control IEEE Trans. 1998;45(4):1088–1099.
- Arthur RM, Basu D, Guo Y, et al. 3-d in vitro estimation of temperature using the change in backscattered ultrasonic energy. IEEE Trans Ultrason Ferroelectr Freq Control. 2010;57(8):1724–1733.
- Straube WL, Arthur RM. Theoretical estimation of the temperature dependence of backscattered ultrasonic power for noninvasive thermometry. Ultrasound Med Biol. 1994;20(9):915–922.
- Maraghechi B, Kolios M, Tavakkoli J. Feasibility of detecting change in backscattered energy of acoustic harmonics in locally heated tissues. Int J Hyperthermia. 2019;36(1):963–973.
- Shah J, Aglyamov SR, Sokolov K, et al. Ultrasound imaging to monitor photothermal therapy - Feasibility study. Opt Express. 2008 Mar 17;16(6):3776–3785.
- Ebbini ES, Simon C, Liu D. Real-time two-dimensional temperature imaging using ultrasound. Conf Proc Ieee Eng Med Biol Soc. 2010 Jan;57(1):12–16.
- Ebbini ES, Simon C, Liu D. Real-time Ultrasound Thermography and Thermometry. IEEE Signal Process Mag. 2018;35(2):166–174.
- Saccomandi P, Schena E, Silvestri S. Techniques for temperature monitoring during laser-induced thermotherapy. An Overview, Int J Hyperthermia. 2013;29(7):609–619.
- Arnal B, Pernot M, Tanter M. Monitoring of thermal therapy based on shear modulus changes: I. shear wave thermometry. IEEE Trans Ultrason Ferroelectr Freq Control. 2011;58(2):369–378.
- Sapin-de Brosses E, Gennisson J, Pernot M, et al. Temperature dependence of the shear modulus of soft tissues assessed by ultrasound. Phys Med Biol. 2010;55(6):1701–1718.
- Wu T, Felmlee J, Greenleaf J, et al. Assessment of thermal tissue ablation with MR elastography. Magn Reson Med. 2001;45(1):80–87.
- Lepetit J, Grajales A, Favier R. Modelling the effect of sarcomere length on collagen thermal shortening in cooked meat: consequence on meat toughness. Meat Sci. 2000;54(3):239–250.
- Mast TD, Salgaonkar VA, Karunakaran C, et al. Acoustic emissions during 3.1 MHz ultrasound bulk ablation in vitro. Ultrasound Med Biol. 2008;34(9):1434–1448.
- Uchida T, Ohkusa H, Yamashit H, et al. Five years experience of transrectal high-intensity focused ultrasound using the Sonablate device in the treatment of localized prostate cancer. Int J Urol. 2006;13(3):228–233.
- Lewis MA, Staruch RM, Chopra R. Thermometry and ablation monitoring with ultrasound. Int J Hyperthermia. 2015;31(2):163–181.
- Tseng H-Y, Lee GB, Lee CY, et al. Localised heating of tumours utilising injectable magnetic nanoparticles for hyperthermia cancer therapy. IET Nanobiotechnol. 2009;3(2):46–54.
- Sanghvi NT, Chen WH, Carlson R, et al. Clinical validation of real-time tissue change monitoring during prostate tissue ablation with high intensity focused ultrasound. J Ther Ultrasound. 2017;5:24.
- Tavakkoli J, Sanghvi NT. Ultrasound-guided HIFU and thermal ablation. In: Frenkel V, editor. Therapeutic Ultrasound, Mechanisms to Applications. New York: Nova Science; 2011. p. 137–161.
- Farny CH, Clement GT. Thermal imaging with ultrasound reflex transmission methods. 2008 IEEE Ultrasonics Symposium, Beijing. 2008. p.2088–2091.
- López-Haro SA, Leija L, Favari L, et al. Measurement of ultrasonic properties into biological tissues in the hyperthermia temperature range. Phys Procedia. 2010;3(1):551–558.
- Bayat M, Ballard JR, Ebbini ES. In Vivo ultrasound thermography in presence of temperature heterogeneity and natural motions. IEEE Trans Biomed Eng. 2015;62(2):450–457.
- Kim K, Huang SW, Hall TL, et al. Arterial Vulnerable plaque characterization using ultrasound-induced thermal strain imaging (TSI). IEEE Trans Biomed Eng. 2008;55(1):171–180.
- Liu D, Ebbini ES. Real-Time 2-D Temperature Imaging Using Ultrasound. IEEE Trans Biomed Eng. 2010;57(1):12–16.
- Bydder GM, Kreel L. The temperature dependence of computed tomography attenuation values. J Comput Assist Tomogr. 1979;3(4):506–510.
- Homolka P, Gahleitner A, Nowotny R. Temperature dependence of HU values for various water equivalent phantom materials. Phys Med Biol. 2002;47(16):2917–2923.
- Fallone BG, Moran PR, Podgorsak EB. Noninvasive thermometry with a clinical x-ray scanner. Med Phys. 1982;9(5):715–721.
- Schena E, Saccomandi P, Giurazza F, et al. Experimental assessment of CT-based thermometry during laser ablation of porcine pancreas. Phys Med Biol. 2013;58(16):5705–5716.
- Birnbaum BA, Hindman N, Lee J, et al. Multi-detector row CT attenuation measurements: assessment of intra- and interscanner variability with an anthropomorphic body CT phantom. Radiology. 2007;242(1):109–119.
- Bruners P, Levit E, Penzkofer T, et al. Multi-slice computed tomography: A tool for non-invasive temperature measurement? Int J Hyperthermia. 2010;26(4):359–365.
- Bruners P, Pandeya GD, Levit E, et al. CT-based temperature monitoring during hepatic RF ablation: feasibility in an animal model. Int J Hyperthermia. 2012;28(1):55–61.
- Pandeya G, Klaessens H, Greuter M, et al. Feasibility of computed tomography based thermometry during interstitial laser heating in bovine liver. Eur Radiol. 2011;21(8):1733–1738.
- Weiss N, Sosna J, Goldberg SN, et al. Non-invasive temperature monitoring and hyperthermic injury onset detection using X-ray CT during HIFU thermal treatment in ex vivo fatty tissue. Int J Hyperthermia. 2014;30:119–125.
- Delpy D, Cope M. Quantification in tissue near-infrared spectroscopy. Philos Trans R Soc Lond B Biol Sci. 1997;352(1354):649–659.
- Collins JR. Change in the infra-red absorption spectrum of water with temperature. Phys Rev. 1925;26(6):0771–0779.
- McCabe WC, Subraman S, Fisher HF. Near-infrared spectroscopic investigation of effect of temperature on structure of water. J Phys Chem. 1970;74(25):4360–4369.
- Bakhsheshi M, Diop M, St. Lawrence K, et al. Monitoring brain temperature by time-resolved near-infrared spectroscopy: pilot study. J Biomed Opt. 2014;19(5):057005.
- Bakhsheshi M, Lee T. Non-invasive monitoring of brain temperature by near-infrared spectroscopy. Temperature. 2015;2(1):31–32.
- Chung S, Cerussi AE, Merritt SI, et al. Non-invasive tissue temperature measurements based on quantitative diffuse optical spectroscopy (DOS) of water. Phys Med Biol. 2010;55(13):3753–3765.
- Hollis VS, Binzoni T, Delpy D. Noninvasive monitoring of brain tissue temperature by near-infrared spectroscopy. Proc SPIE Int Soc Opt Eng. 2001;4250:470–481.
- Diop M, St Lawrence K. Improving the depth sensitivity of time-resolved measurements by extracting the distribution of times-of-flight. Biomed Opt Express. 2013;4(3):447–459.
- Devor S, Sakadzic S, Srinivasan VJ, et al. Frontiers in optical imaging of cerebral blood flow and metabolism. J Cereb Blood Flow Metab. 2012;32(7):1259–1276.
- Giannotti G, Cohn SM, Brown M, et al. Utility of near-infrared spectroscopy in the diagnosis of lower extremity compartment syndrome. J Trauma. 2000;48(3):396–399.
- Lovell AT, Owen-Reece H, Elwell CE, et al. Continuous measurement of cerebral oxygenation by near infrared spectroscopy during induction of anesthesia. Anesth Analg. 1999;88(3):554–558.
- Boas D, Dale AM, Franceschini MA. Diffuse optical imaging of brain activation: approaches to optimizing image sensitivity, resolution and accuracy. NeuroImage. 2004;23(1):S275–S288.
- Eggebrecht A, Ferradal S, Robichaux-Viehoever A, et al. Mapping distributed brain function and networks with diffuse optical tomography. Nat Photonics. 2014;8(6):448–454.
- Ferrari M, Quaresima V. A brief review on the history of human functional near-infrared spectroscopy (fNIRS) development and fields of application. Neuroimage. 2012;63(2):921–935.
- Villringer A, Chance B. Non-invasive optical spectroscopy and imaging of human brain function. Trends Neurosci. 1997;20(10):435–442.
- Holper L, Mitra S, Bale G, et al. Prediction of brain tissue temperature using near-infrared spectroscopy. Neurophotonics. 2017;4(2):021106.
- Wintermark P, Hansen A, Warfield SK, et al. Near-infrared spectroscopy versus magnetic resonance imaging to study brain perfusion in newborns with hypoxic-ischemic encephalopathy treated with hypothermia.. Neuroimage. 2014;85(Pt 1(0 1)):287–293.
- Goeral K, Urlesberger B, Giordano V, et al. Prediction of outcome in neonates with hypoxic-ischemic encephalopathy II: role of amplitude-integrated electroencephalography and cerebral oxygen saturation measured by near-infrared spectroscopy. Neonatology. 2017;112(3):193–202.
- Edrich J, Hardee PC. Thermography at millimeter wavelengths. Proc IEEE. 1974;62(10):1391–1392.
- Enander B, Larson G. Microwave radiometric measurements of the temperature inside a body. Electron Lett. 1974;10(15):317–318.
- Sterzer F. Microwave radiometers for non-invasive measurements of subsurface tissue temperatures. Automedica. 1987;8(4):203–211.
- Arunachalam K, Stauffer PR, Maccarini PF, et al. Characterization of a digital microwave radiometry system for noninvasive thermometry using a temperature-controlled homogeneous test load. Phys Med Biol. 2008;53(14):3883–3901.
- Jacobsen S, Stauffer PR. Can we settle with single-band radiometric temperature monitoring during hyperthermia treatment of chestwall recurrence of breast cancer using a dual-mode transceiving applicator? Phys Med Biol. 2007;52(4):911–928.
- Misra S, Mohammed PN, Guner B, et al. Microwave radiometer radio-frequency interference detection algorithms: a comparative study. IEEE Trans Geosci Remote Sens. 2009;47(11):3742–3754.
- Lin J. Frequency optimization for microwave imaging of biological tissues. Proc IEEE. 1985;73(2):374–375.
- Klemetsen O, Birkelund Y, Jacobsen SK, et al. Design of medical radiometer front-end for improved performance. Prog Electromagn Res B Pier B. 2011;27:289–306.
- Spiliopoulos S, Theodosiadou V, Barampoutis N, et al. Multi-center feasibility study of microwave radiometry thermometry for non-invasive differential diagnosis of arterial disease in diabetic patients with suspected critical limb ischemia. J Diabetes Complications. 2017;31(7):1109–1114.
- Toutouzas K, Grassos H, Synetos A, et al. A new noninvasive method for detection of local inflammation in atherosclerotic plaques: experimental application of microwave radiometry. Atherosclerosis. 2011;215(1):82–89.
- Zampeli E, Raftakis I, Michelongona A, et al. Detection of subclinical synovial inflammation by microwave radiometry. PLoS ONE. 2013;8(5):e64606.
- Toutouzas K, Drakopoulou M, Aggeli C, et al. In vivo measurement of plaque neovascularisation and thermal heterogeneity in intermediate lesions of human carotid arteries. Heart. 2012;98(23):1716–1721.
- Bardati F, Iudicello S. Modeling the visibility of breast malignancy by a microwave radiometer. IEEE Trans Biomed Eng. 2008;55(1):214–221.
- Arunachalam K, Maccarini PF, De Luca V, et al. Modeling the detectability of vesicoureteral reflux using microwave radiometry. Phys Med Biol. 2010;55(18):5417–5435.
- Stauffer PR, Snow BW, Rodrigues DB, et al. Non-invasive measurement of brain temperature with microwave radiometry: demonstration in a head phantom and clinical case. Neuroradiol J. 2014;27(1):3–12.
- Vesnin S, Turnbull AK, Dixon JM, et al. Modern microwave thermometry for breast cancer. J Mol Imag Dynamic. 2017;7(2):1000136.
- Liu S, Zhang R, Zheng Z, et al. Electromagnetic-acoustic sensing for biomedical applications. Sensors (Basel). 2018;18(10):E3203.
- Ke H, Tai S, Wang LV. Photoacoustic thermography of tissue. J Biomed Opt. 2014;19(2):026003.
- Manohar S, Razansky D. Photoacoustics: a historical review. Adv Opt Photonics. 2016;8(4):586–617.
- Maslov K, Wang LV. Photoacoustic imaging of biological tissue with intensity-modulated continuous-wave laser. J Biomed Opt. 2008;13(2):024006.
- Stylogiannis A, Prade L, Buehler A, et al. Continuous wave laser diodes enable fast optoacoustic imaging. Photoacoustics. 2017;9:31–38.
- Wang LV. Tutorial on photoacoustic microscopy and computed tomography. IEEE J Sel Top Quant. 2008;14(1):171–179.
- Kim J, Park S, Jung Y, et al. Programmable real-time clinical photoacoustic and ultrasound imaging system. Sci Rep. 2016;12(6):35137.
- Laser Institute of America. American national standard for safe use of lasers ANSI Z136.1-2007. New York: American National Standards Institute, Inc.; 2007.
- Wang LV, Photoacoustic Tomography: HS. In Vivo imaging from organelles to organs. Science. 2012;335(6075):1458–1462.
- Stenberg I, Huland D, Vermesh O, et al. Photoacoustic clinical imaging. Photoacoustics. 2019;14:77–98.
- Shah J, Park S, Aglyamov S, et al. Photoacoustic imaging and temperature measurement for photothermal cancer therapy. J Biomed Opt. 2008;13(3):034024.
- Yao J, Ke H, Tai S, et al. Absolute photoacoustic thermometry in deep tissue. Opt Lett. 2013;38(24):5228–5231.
- Zhou Y, Li M, Liu W, et al. Thermal memory based photoacoustic imaging of temperature. Optica. 2019;6(2):198–205.
- Landa FJO, Deán-Ben XL, Sroka R, et al. Volumetric optoacoustic temperature mapping in photothermal therapy. Sci Rep. 2017;7(1):9695.
- Petrova EV, Brecht HP, Motamedi M, et al. In vivo optoacoustic temperature imaging for image-guided cryotherapy of prostate cancer. Phys Med Biol. 2018;63(6):064002.
- Kim J, Choi W, Park EY, et al. Real-time photoacoustic thermometry combined with clinical ultrasound imaging and high-intensity focused ultrasound. IEEE Trans Biomed Eng. 2019;66(12):3330–3338.
- Lin E, Alessio A. What are the basic concepts of temporal, contrast, and spatial resolution in cardiac CT? J Cardiovasc Comput Tomogr. 2009;3(6):403–408.
- Boas FE, Fleischmann D. Evaluation of two iterative techniques for reducing metal artifacts in computed tomography. Radiology. 2011;259(3):894–902.
- Peller M, Reinl HM, Weigel A, et al. T1 relaxation time at 0.2 Tesla for monitoring regional hyperthermia: feasibility study in muscle and adipose tissue. Magn Reson Med. 2002;47(6):1194–1201. .
- Haynes M, Stang J, Moghaddam M. Real-time microwave imaging of differential temperature for thermal therapy monitoring. IEEE Trans Biomed Eng. 2014;61(6):1787–1797.
- Meaney PM, Zhou T, Fanning MW, et al. Microwave thermal imaging of scanned focused ultrasound heating: phantom results. Int J Hyperthermia. 2008;24(7):523–536.
- Marcus RP, Koerner E, Aydin R, et al. The evolution of radiation dose over time: measurement of a patient cohort undergoing whole-body examinations on three computer tomography generations. Eur J Radiol. 2017;86(1):63–69.
- Choy G, Khalilzadeh O, Michalsk M, et al. Current applications and future impact of machine learning in radiology. Radiology. 2018;288(2):318–328.
- Seip R, Ebbini ES. Noninvasive estimation of tissue temperature response to heating fields using diagnostic ultrasound. IEEE T Bio-Med Eng. 1995;42(8):828–839.
- Ghoshal G, Kemmerer JP, Karunakaran C, et al. Quantitative ultrasound imaging for monitoring In Situ high- intensity focused ultrasound exposure. Ultrason Imaging. 2014;36(4):239–255.