
 ?Mathematical formulae have been encoded as MathML and are displayed in this HTML version using MathJax in order to improve their display. Uncheck the box to turn MathJax off. This feature requires Javascript. Click on a formula to zoom.
ABSTRACT
The environmental conditions during the Tokyo Olympic and Paralympic Games are expected to be challenging, which increases the risk for participating athletes to develop heat-related illnesses and experience performance loss. To allow safe and optimal exercise performance of Dutch elite athletes, the Thermo Tokyo study aimed to determine thermoregulatory responses and performance loss among elite athletes during exercise in the heat, and to identify personal, sports-related, and environmental factors that contribute to the magnitude of these outcomes. For this purpose, Dutch Olympic and Paralympic athletes performed two personalized incremental exercise tests in simulated control (15°C, relative humidity (RH) 50%) and Tokyo (32°C, RH 75%) conditions, during which exercise performance and (thermo)physiological parameters were obtained. Thereafter, athletes were invited for an additional visit to conduct anthropometric, dual-energy X-ray absorptiometry (DXA), and 3D scan measurements. Collected data also served as input for a thermophysiological computer simulation model to estimate the impact of a wider range of environmental conditions on thermoregulatory responses. Findings of this study can be used to inform elite athletes and their coaches on how heat impacts their individual (thermo)physiological responses and, based on these data, advise which personalized countermeasures (i.e. heat acclimation, cooling interventions, rehydration plan) can be taken to allow safe and maximal performance in the challenging environmental conditions of the Tokyo 2020 Olympic and Paralympic Games.
Introduction
The Tokyo 2020 Olympic and Paralympic Games will be held amid Tokyo’s summer, characterized by hot (ambient temperature (Tambient) >30°C) and humid (relative humidity (RH) ±70%) environmental conditions [Citation1–3], with only little relief overnight [Citation4]. As several events are scheduled at the hottest time of the day (midday) [Citation3], these circumstances may expose athletes to the most challenging environmental conditions ever observed in the modern history of the Olympic and Paralympic (Summer) Games. Apart from the external thermoregulatory burden (i.e. solar radiation, ambient temperature and humidity), exercise itself is the most important source of heat production. Only 20% to 25% of the total substrate oxidation during exercise is used for mechanical muscle activity, while the remaining 75% to 80% is dissipated as heat [Citation5,Citation6]. The combination of environmental heat stress and exercise-induced heat production is likely to exceed the body’s heat dissipating capabilities [Citation7,Citation8], resulting in profound core temperature (Tc) elevations [Citation7,Citation9,Citation10].
Progressive increases in Tc may result in exertional hyperthermia placing athletes at risk of developing heat-related illnesses such as heat exhaustion and heat stroke [Citation11–13]. A recent study of athletes competing at the 2016 UCI Road World Championships in Qatar revealed that 57% of participating athletes had a history of heat-related symptoms and 17% a history of exertional heat illness [Citation14]. It has been demonstrated that performance levels are markedly impaired during exercise in the heat [Citation15]. For example, the maximal aerobic capacity (i.e. VO2max) is compromised [Citation16], whereas self-paced and constant workload exercise performance is attenuated in warmer (>30°C) versus cooler (<20°C) environmental conditions [Citation17–20]. Since small reductions in performance levels have enormous consequences in professional sports, it is paramount to identify athletes who will demonstrate profound Tc elevations or large performance losses while exercising in the heat [Citation21].
To allow safe and optimal exercise performance of Dutch elite athletes competing in extreme environmental conditions, such as expected during the Tokyo 2020 Olympic Games, we established the interdisciplinary Thermo Tokyo consortium consisting of representatives from TeamNL (the umbrella organization of all Dutch sports federations), 4 Dutch universities, 6 national sports federations, and 3 TeamNL Training Centers. The overarching aim of the Themo Tokyo study was to increase our understanding of the individual thermoregulatory responses and performance loss among elite athletes during exercise in the heat and to identify personal, sports-related, and environmental factors that contribute to the magnitude of these responses. For this purpose, high-resolution data were collected during personalized exercise tests in a climate chamber and by assessing detailed anthropometric measures in a heterogeneous group of Olympic and Paralympic athletes. Besides, we used data derived from the exercise tests and anthropometric measures for computer simulations to investigate the impact of various Tokyo environmental conditions on the thermoregulatory responses of individual athletes. Altogether, findings of this study were used to inform elite athletes and coaches on how heat impacts their individual (thermo)physiological responses and, based on these data, to advise which countermeasures can be taken to mitigate the impact of exercise in the heat on Tc and performance outcomes. The aim of this article is to describe the rationale and design of the Thermo Tokyo study.
Methods
Participants
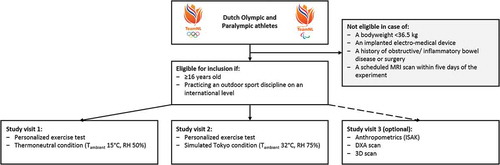
Olympic and Paralympic athletes were recruited via TeamNL infrastructure (i.e. national sports federations, coaches, embedded scientists). As we were specifically interested in the impact of acute heat stress on exercise performance and thermoregulation, only elite athletes (≥16 years) practicing an outdoor sport discipline on an international level were eligible to participate in our study. Exclusion criteria were based on the use of the ingestible temperature capsule: I) a bodyweight <36.5 kg, II) an implanted electro-medical device, III) a history of obstructive/inflammatory bowel disease or surgery, or IV) a scheduled magnetic resonance imaging (MRI) scan within 5 days of the experiment. We aimed to recruit as many athletes as possible, but a minimal sample size of n = 75 was anticipated.
Design
Study participants were invited for three study visits () between 1 October 2018 and 1 March 2020. Visits 1 and 2 included the performance of personalized incremental exercise tests in simulated control (Tambient 15°C, RH 50%) and Tokyo (Tambient 32°C, RH 75%) conditions, respectively. The exercise tests were performed on a cycle ergometer (Lode ergometer, Lode B.V., Groningen, Netherlands, or Tacx Neo Smart T2800, Tacx B.V., Wassenaar, Netherlands). Paralympic athletes with a disability that hinder them from cycling (i.e. spinal cord injury and/or amputated foot or leg) performed the exercise test on an arm ergometer (Tacx Booster T2500, Tacx B.V., Wassenaar, Netherlands, or Cyclus 2, RBM elektronik-automation, Leipzig, Germany or TechnoGym Top Excite+ 700i, TechnoGym, Cesena, Italy, depending on their sports equipment). The exercise test consisted of a 20 min warm-up phase, followed by an incremental phase until volitional exhaustion. The first exercise test was always conducted in the control condition, to determine the 20 min warm-up workload corresponding to 70% of the athlete’s maximal heart rate. During the incremental phase, the workload obtained during the warm-up phase was gradually increased by 5% every 3 min until volitional exhaustion. The second exercise test was performed in simulated Tokyo conditions, using the exact same individualized exercise protocol that was established during the first study visit (i.e. changes in workload over time), allowing us to assess the effects of exercise in different environmental conditions on performance and thermoregulatory outcomes. Exercise tests were performed between 08:30 am and 04:00 pm. For every participant, the exercise tests were separated by ≥48 h and were commenced at the same time of day to avoid any circadian rhythm effects between the control and Tokyo condition [Citation22]. Visit 3 was optional and included detailed assessment of anthropometric measures. First, anthropometric measurements were conducted according to the International Society for the Advancement of Kinanthropometry (ISAK) standards, followed by a dual-energy X-ray absorptiometry (DXA) scan on a fan-beam DXA scanner (Hologic Discovery A, Hologic, Bedford, MA). Finally, a 3D scan was made using an Artec-L scanner (Artec 3D, Luxemburg). All anthropometric measurements were performed by two experienced researchers (ISAK levels 1 and 2 accredited, respectively).
Figure 1. Flow chart of the Thermo Tokyo study design Personalized. DXA, dual-energy X-ray absorptiometry; ISAK, International Society for the Advancement of Kinanthropometry; MRI, magnetic resonance imaging; RH, relative humidity
Personalised exercise test
In preparation for each exercise test, participants were asked to refrain from strenuous exercise (>24 h) and consumption of alcohol or caffeine (>12 h). Furthermore, all participants were instructed to eat the same diet and wear the same clothes for both exercise tests, consume their last meal ≥3 h preceding the measurements, consume 500 mL of water ∼2 h before arriving at the laboratory and register their fluid intake on the day of each study visit from the moment they woke up. To perform Tc measurements, participants were asked to ingest a gastrointestinal temperature capsule 3 h prior to the exercise test on study visits 1 and 2. Furthermore, participants were told that they are not allowed to drink during the exercise test to avoid any interaction between Tc recordings and fluid intake [Citation23].
Upon arrival at the laboratory, written informed consent, the fluid intake form and personal data were obtained (i.e. sex, age, menstrual cycle phase, acclimation status). Subsequently, body height (Road Rod Portable Stadiometer, Hopkins medical products, Caledonia, USA) and weight (Seca robusta 813 scale, Hamburg, Germany) measurements were performed and measurement equipment for the assessment of gastrointestinal temperature (Tgi), skin temperature (Tskin) and heart rate (HR) was instrumented.
After participants entered the climate chamber, the bike ergometer was fitted to the participant by adjusting the height, inclination and position of the saddle and the height and inclination of the handlebar. If a Tacx or Cyclus 2 device was used, the participant’s bike was installed before entering the climate chamber. The ergometer type and settings will be the same for both tests. Then, a 5 min seated rest period was applied, and baseline values were obtained in the last minute. Thereafter, the athlete was instructed to start a 20 min warm-up by cycling at 100 W (cycle ergometer) or 30–70 W (hand cycle ergometer) at a pedaling speed of 80–100 revolutions per minute throughout the whole protocol. After 3 min, the initial workload was gradually adjusted to reach 70% of the athlete’s maximal HR, obtained from training data or a previously performed maximal exercise test. After reaching a stable target HR (i.e. 70% HRmax), workload was kept equal. At the 20 min mark, the incremental phase started and the workload was gradually increased by 5% every 3 min until volitional exhaustion. Verbal encouragement was used to motivate participants to give maximal effort. The test was terminated if the participant was unable to maintain the minimum of 80 revolutions per minute.
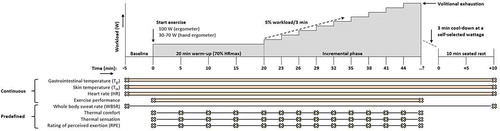
After exercise cessation, participants had a 3 min active cool-down at a self-selected wattage, followed by a 10 min seated rest period. Directly after completion of the protocol, participants left the climate chamber, the measurement equipment was removed, and post-exercise body weight was obtained. A complete overview of the personalized incremental exercise test protocol is presented in .
Figure 2. Overview of the Thermo Tokyo personalized exercise test protocol. After 5 min seated rest (Baseline), athletes will start to exercise at 100 W (ergometer) or 30–70 W (hand ergometer). After 3 min, the initial workload will be gradually adjusted to reach 70% of the athlete’s maximal heart rate. After 20 min, workload will gradually be increased every 3 min with 5% until volitional exhaustion. After exercise cessation, participants will have a 3 min cool-down at a self-selected wattage followed by 10 min seated rest. Gastrointestinal temperature (Tgi), skin temperature (Tsk), heart rate (HR), and exercise performance will be examined continuously throughout the protocol. Participant’s body mass will be measured at baseline and directly after finishing the experimental protocol to determine whole body sweat rate (WBSR). Perceptual outcomes will be scored at baseline, every 5 min during the warm-up phase and every 3 min during the incremental phase. The personalized exercise protocol (i.e. changes in workload over time) obtained during the control condition (Tambient 15°C, RH 50%) will subsequently be applied to the second exercise test in simulated Tokyo conditions (Tambient 32°C, RH 75%)
Measurements
Gastrointestinal temperature (Tgi)
We used a validated ingestible telemetric temperature capsule system (myTemp, Nijmegen, Netherlands) [Citation24,Citation25] to continuously measure Tgi (in °C) at predefined 10-s intervals. The temperature capsule measures Tgi using a negative temperature coefficient thermistor, and temperature data is sent wirelessly to the associated copper-wired waistband, worn at waist level and placed over participant’s sports clothing.
Exercise performance
Time to exhaustion (TTE) was measured from the start of the warm-up until volitional exhaustion and was expressed in minutes rounded to the nearest integer. Peak power output (PPO) was expressed as an absolute value (W) and normalized value (W/kg), and was calculated using the following formula:PPO(W)=workload in the highest completed(W) +((time in the hightest incomplete step(s)/step duration)*additional workload in the highest incomplete step(W))
Changes in TTE (min) and PPO (W and W/kg) in the Tokyo condition relative to the control condition were calculated using the following formula:
Skin temperature (Tsk)
Wireless temperature recorders (iButton DS1922L, Dallas Semiconductor Corp., USA) were attached to the skin at four distinct locations (i.e. neck, left hand, right shoulder, right shin) (Standard I.S.O. 9886, 2004) using sweat proof Tegaderm Film (Tegaderm, Neuss, Germany) to determine Tsk. Resolution was set at 0.0625°C and data were continuously collected at 20-s intervals. We calculated the weighted averages according to international standard operations (Standard I.S.O. 9886, 2004).
Heart rate (HR)
HR was measured using a Polar system (Polar V800, Polar Electro Oy, Kempele, Finland) with a chest strap (Polar chest strap H10, Polar Electro Oy, Kempele, Finland) using 1-s intervals.
Whole body sweat rate (WBSR). Participant’s body weight was measured to the nearest 100 g using an electronic weighting scale (Seca robusta 813 scale, Hamburg, Germany) at baseline and directly after the experimental protocol to determine WBSR. Body weight measurements were performed in shorts and underwear. Dehydration was defined as a body weight loss of >2% [Citation26].
Perceptual outcomes
Thermal comfort, thermal sensation and rating of perceived exertion (RPE) were ranked on a 4-point [Citation27], 7-point [Citation27] and 15-point scale [Citation28], respectively. Thermal comfort ranged from 1 (comfortable) to 4 (very uncomfortable), thermal sensation from −3 (very cold) to 3 (very hot), and RPE from 6 (very very light) to 20 (maximal exertion). Perceptual outcomes were scored at baseline, every 5 min during the warm-up phase, every 3 min during the incremental phase and every 5 min during the recovery phase.
Environmental conditions
Tambient, RH, and wet bulb globe temperature (WBGT) were measured during the baseline and the recovery period via a portable climate monitoring device (Davis instruments Inc., Hayward, USA) positioned on table height in the center of the climate chamber, and the ambient vapor pressure and absolute humidity were calculated accordingly.
Data analysis of personalized exercise tests
After data extraction, individual data records were cleaned by manually removing erroneous values caused by measurement errors in Tgi,Tsk and HR responses. Thereafter, minute averages of Tgi,Tsk and HR were calculated using a customized MATLAB and Statistics Toolbox (2012b, The MathWorks, Inc., Natick, USA) software package. Missing Tgi data was linearly interpolated using a customized MATLAB script if gaps were <5 min. Gaps >5 min were visually inspected by two researchers and only interpolated if the interpolated data fitted the Tc curve. In case of discrepancy between the two researchers, the evaluation of a 3rd researcher was decisive. All case-by-case visual data inspections were performed by three dedicated and experienced researchers.
Anthropometric measurements
To study the relation between anthropometric characteristics and the magnitude of individual thermoregulatory responses and performance loss, we assessed detailed anthropometrics, DXA scans and 3D scan measurements. Outcomes of these anthropometric measurements were used as an input for computer simulations to investigate the impact of various Tokyo environmental conditions on the thermoregulatory responses of individual athletes.
All anthropometric measurements were performed in the morning between 8:00 and 12:00. In preparation for the anthropometric, DXA and 3D scan measurements, participants were asked to refrain from exercise (at least 14 h prior to the measurements). A light continental breakfast was allowed to improve feasibility and compliance with the testing procedures. Upon arrival at the laboratory, participants were asked to empty their bladder, undress to underwear (or tight-fitting sportswear with no metal or hard plastic parts), remove jewelry, and bind long hair together to avoid interference or inaccuracies during the 3D scan measurements.
Anthropometrics
Body weight and height were measured using a digital scale with a stadiometer (Dongshan Jenix, DS-103, Seoul, Korea) with an accuracy of ±0.1 kg and ±1 mm, respectively. Skinfolds were assessed to the nearest 0.1 mm using a Harpenden Skinfold Caliper (Baty International, West Sussex, UK) calibrated as recommended by the manufacturer. Skinfold measurements were taken on the right side of the body using landmarks to identify the skinfold sites described by Norton [Citation29]. Eight skinfold sites (i.e. triceps, biceps, subscapular, iliac crest, supraspinal, abdominal, front thigh, and medial calf) were marked and measured. All skinfold measurements were performed in duplicates to determine within-day reliability. If the difference between the duplicate measures exceeded 5% for an individual skinfold, a third measurement was performed after all other measurements were completed. The mean of double measurements or median of triple measurements will be used for further analyses.
Dual-energy X-ray absorptiometry (DXA)
A whole body DXA scan was conducted using a fan-beam DXA scanner (Hologic Discovery A, Hologic, Bedford, Massachusetts, USA) using the array mode. The scanner was calibrated with a phantom at the beginning of each test day according to the manufacturer’s guidelines. Positioning of the participants was standardized according to the NHANES positioning protocol [Citation30]. The top of the head was positioned a few centimeters below the top line of the scan area. Consequently, the feet of tall participants (more than ~190 cm) was not completely scanned. Scans were analyzed by Apex 5.6 software (Hologic, Bedford, Massachusetts, USA) with the classic body composition analysis algorithm (i.e. without NHANES correction).
3D-scan measurements
A full body 3D scan was made using an Artec-L scanner (Artec 3D, Luxembourg) which was mounted on a tripod with vertical slide. Participants were asked to stand on a rotating platform (2 rpm) in a standing upright position (feet slightly apart, arms to the side, and head and eyes facing forward). The scanner was slowly moved downwards along the vertical slide to scan the rotating participant for approximately 4 min.
Analysis of 3D scan measurements
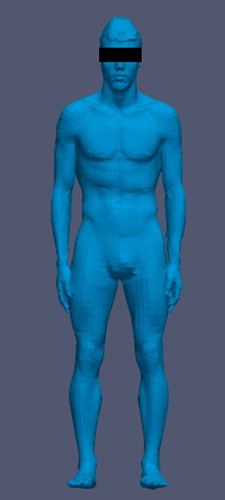
The 3D scans were automatically cleaned using Artec software (Artec Studio 13) and were submitted to an automated remeshing process (Wrap version 3) to obtain the appropriate quality by fitting a common body template (). The resulting re-meshed models provided a homology between the scanned bodies, meaning that the models had the same number of vertices and that the vertices were at corresponding anatomical locations. The homology was then exploited to consistently measure anthropometric dimensions with a custom-made Python script (version 3.7, Python Software Foundation, Beaverton, Oregon, USA). The selection of anthropometric dimensions was based on the anthropometry input variables of the simulation model (), expanded with body surface area (BSA) in m2. Anthropometric measures were defined according to the NASA Anthropometric Source Book [Citation31,Citation32] in accordance with Fiala et al [Citation33].
Table 1. Personalized input parameters for the Fiala-thermal-Physiology-and-Comfort (FPC) simulation model
Figure 3. Example of a processed 3D scan
Thermophysiological computer simulations
To assess the impact of different environmental conditions on thermoregulatory responses during exercise, we used data from the exercise tests and anthropometric measurements to feed the validated Fiala-thermal-Physiology-and-Comfort (FPC) simulation model (version 5.4) [Citation34,Citation35]. Specifically, personal characteristics (), exertional heat production (from power output), and climatic conditions served as input for the simulations, while output parameters were the thermoregulatory responses including rectal temperature (Tre). Below, we present the specific settings that were used to run our computer simulations.
Personal settings
Fitness level (VO2max in ml/kg/min) was estimated from the highest PPO individuals reached during the exercise tests in W, and body weight (BW) in kg, using the equation of Hawley and Noakes [Citation36]:
Acclimatization days were determined based on oral reports about exercise in hot conditions the previous month. Body height and weight were obtained from the anthropometry measurements and body fat percentage from the DXA scan. All other anthropometric measures were derived from the 3D scans as described above.
The initial thermophysiological status at the start of the exercise was simulated by a 10 min rest period at a 1.1 metabolic equivalent of task score (METS) in both the control and Tokyo environmental conditions. Subsequently, the exercise test was simulated by inserting METS for each full minute until exhaustion. METS were calculated from exercise test values, using the following American College of Sports Medicine equations [Citation37]:
The FPC-model considers metabolic energy to be completely converted into heat, which holds true for locomotive activity. However, accounting for the external mechanical power of cycling, an average gross efficiency factor of 0.2 was applied to the METS values before entering them into the model.
Conditions
As a validation step, the exercise tests for the control and Tokyo were simulated. Tambient and RH measured during the exercise tests were used as input, being close to the set values. By lack of radiation, mean radiant temperature was set equal to ambient temperature. Only natural air flow within the climate chamber was present, which will be accounted for by a standard air flow (Vair) value of 0.2 m/s. Convective cooling by pedaling movements was accounted for by an adjusted Vair of 1.0 m/s at the legs. Standardized clothing settings was selected for shirt and shorts.
To evaluate the impact of different environmental conditions on temperature responses, the Tokyo exercise test was simulated across nine different environmental conditions (). Environmental variations were defined within realistic boundaries of possible Tokyo conditions [Citation1]. First, a baseline simulation at 32°C and 75% RH was performed. Then, simulations with 6°C higher and lower ambient temperature and simulations with 15% higher and lower RH were performed. Furthermore, a fully acclimatized status (10 days), and a condition with maximal radiation (921 W/m2) was simulated. The latter is defined by the average maximal radiation during early afternoon [Citation1]. Finally, the worst and best case scenarios were simulated, based on the average Tokyo ambient temperature and relative humidity during the hottest time of the day (12.00 noon to 3.00 pm) plus or minus two standard deviations [Citation1]. The worst-case scenario also included maximal solar radiation, whereas the best case did not include solar radiation. Wind was kept constant at 0.2 m/s (at the legs 1.0 m/s).
Table 2. Different environmental conditions for the Fiala-thermal-Physiology-and-Comfort (FPC) simulation model
Outcome parameters
It is possible to extract many different outcome parameters from the FPC model, including cardiovascular, metabolic, thermophysiological and perceptual parameters. Nevertheless, Tre was chosen as the primary outcome parameter from simulations within the Thermo Tokyo study. To evaluate the effect of climatic conditions on simulated Tre, the rise in Tre (Tre_rise) was calculated from Tre at the start (Tre_start) and Tre at the end (Tre_end) of exercise for all conditions. Further, the simulations in thermoneutral and Tokyo conditions were used to validate the FPC-model for this specific population, comparing the simulated and measured Tgi response. Based on previous research, no significant differences were expected between Tre and Tgi responses during exercise [Citation38].
Data management and accessibility
All data is stored in the Digital Research Environment “DRE” an online, open-source and easy-to-use cloud platform which allows users across the globe to merge, analyze, store, share, archive and publish data in a safe and compliant way (i.e. security, ICT infrastructure, audit trail, GDPR compliant). Standard software packages are available for data handling and statistical analyses (e.g. SPSS, MatLab, R, Python). In line with the open science and FAIR principles (Findable, Accessible, Interoperable and Reusable), data from the Thermo Tokyo study are available for reuse upon reasonable request via the corresponding author. A data catalog is presented in .
Table 3. Data catalog table of the Thermo Tokyo study. Data is available for reuse upon reasonable request via the corresponding author
Statistical analysis
Statistical analyses were performed using SPSS Statistics 25 (IBM Corp, Armonk, NY) and R Core Team (2019). Analysis of the exercise tests results will be descriptive. Normally distributed data will be presented as mean (± standard deviation; SD), non-normally distributed data as median [interquartile range; Q25-Q75] and categories as frequencies with percentages. We will examine the differences between 1) the control and Tokyo condition, 2) sport disciplines (i.e. endurance versus strength versus skill versus mixed trained athletes), 3) Olympic and Paralympic athletes, and 4) Paralympic athletes with different types of injuries. Linear regression and multivariate regression analysis will be used to study the relations between personal (i.e. age, sex, anthropometrics), sports-related (i.e. type of sport), and exercise factors (i.e. power output, heart rate), and the magnitude of the individual thermoregulatory responses and performance loss. Detailed information about the statistical analysis per objective will be presented in the outcome papers of the Thermo Tokyo project.
Discussion
The Thermo Tokyo study aims to collect high-resolution data on (thermo)physiological responses and changes in performance levels among a large and heterogeneous cohort of Dutch Olympic and Paralympic athletes, who performed personalized maximal exercise tests in simulated control and hot and humid environmental conditions. Furthermore, detailed anthropometric data were collected in a subgroup of the cohort. The outcomes of this study will increase our understanding of the individual thermoregulatory responses and performance loss of elite athletes during exercise in the heat and will help to identify personal, sports-related, and environmental factors that contribute to excessive responses among elite athletes.
Practical implications
Current scientific knowledge on changes in performance levels or thermoregulatory responses during exercise in the heat is primarily derived from lab-based studies in moderate to highly trained individuals [Citation17,Citation19,Citation20,Citation39]. Although these studies provide important insight into the magnitude of exercise-induced Tc rises or performance loss, extrapolation of such findings to elite athletes may be of little use due to differences in anthropometrics (i.e. muscle mass, body fat%), absolute workload, and training status. Current information on the thermoregulatory responses of elite athletes in the heat is largely available from observational field studies with small to medium-sized cohorts [Citation40–43]. The setting (lab-based exercise tests in control and hot and humid conditions), cohort size (anticipated n > 75) and deep phenotyping of (thermo)physiological responses in the Thermo Tokyo study will, therefore, add novel insight on the impact of exercise in the heat on thermoregulatory responses and changes in exercise performance among elite athletes.
Outcomes of our study will be used to inform athletes and coaches on how heat impacts their individual responses. This is important as previous studies indicated that increases in exercise-induced Tc are highly variable across athletes [Citation41,Citation44,Citation45], making it crucial to determine which athletes are most vulnerable to exertional hyperthermia and associated performance loss. Such information is essential to drive individualized approaches [Citation21,Citation46] toward heat mitigation strategies, including heat acclimation [Citation21], hydration planning [Citation47,Citation48] and cooling interventions [Citation49,Citation50]. Only well-structured and individualized heat mitigation strategies that do not unduly impact or detract athletes in their preparation have the potential to allow safe and optimal performance in the heat [Citation50].
Scientific implications
Beyond the practical relevance of our study, it is also expected that Thermo Tokyo outcomes will provide novel scientific insight into the contribution of personal, sports-related, and environmental factors to hyperthermia and performance loss in elite athletes. Previous studies identified various subject characteristics (i.e. body mass index (BMI), lean body mass and surface area-to-mass ratio) [Citation51–55] that influence thermoregulatory responses and exercise performance in the heat. By using a combination of anthropometric, DXA and 3D scan measurements, the data collected within the Thermo Tokyo study allow us to determine whether previously identified predictors can also be used in elite athletes. Furthermore, we aim to identify additional subject characteristics that contribute to exercise-induced Tc elevations or performance losses during exercise in the heat.
In sports and exercise science, thermoregulatory behavior is increasingly recognized as a factor influencing exercise performance in the heat [Citation56]. In fact, previous studies found that higher thermal perception leads to decrements in exercise capacity [Citation57–59]. The assessment of perceptual outcome measures at different time points throughout the exercise tests will allow us to examine if this association between thermal perception and exercise performance is also present in elite athletes. The gathered information may also reveal novel avenues for mitigation measures to increase exercise performance in the heat.
Previous studies suggested that heat tolerance might be different across individuals with variations in aerobic capacities [Citation60,Citation61], which may also apply to our cohort due to differences in the static and dynamic components of Olympic training programs. Accordingly, thermoregulatory responses and the magnitude of performance loss during exercise in the heat may differ substantially across sport disciplines, although elite athletes may be more tolerant to profound temperature elevations than untrained or unfit individuals. Information on these responses may be even more relevant for Paralympic athletes, due to their potential predisposition to heightened thermal strain [Citation62]. However, evidence-based practices for Paralympic athletes are limited due to the paucity of thermoregulatory research and limited sharing of knowledge [Citation62,Citation63]. Therefore, we will compare our study outcomes across sport disciplines (i.e. endurance versus strength versus skill versus mixed trained athletes) and assess differences between Olympic and Paralympic athletes and Paralympic athletes with various impairments.
The actual environmental conditions at the time of the Olympic and Paralympic Games may differ from the standardized environmental conditions that we will use for our exercise tests in the climate chamber. As thermoregulatory responses largely depend on specific environmental conditions, testing athletes across a large range of environmental conditions is recommended [Citation21] but impractical for elite athletes. Therefore, we will simulate various Tokyo environmental conditions to investigate their specific impact on individual thermoregulatory responses. This information will allow athletes and coaches to adjust cooling and pacing strategies in an anticipatory way when the actual environmental conditions deviate from the standardized lab tests. Such information is not only relevant to achieve safe and maximal exercise performance during the upcoming Tokyo Olympic and Paralympic Games but can also be used to prepare for future sports events in the heat (i.e. 2022 FIFA World Cup (Qatar) and beyond).
Strengths & limitations
The strengths of the Thermo Tokyo project include the large, heterogeneous and representative cohort of Olympic and Paralympic athletes, the personalized exercise tests, the high-resolution data on (thermo)physiology, exercise performance and anthropometrics, and the thermal physiological computer simulations. A possible weakness of our study is the lack of a randomized study design, as the first exercise test was always conducted in the control condition to obtain the heart rate based personalized exercise protocol (i.e. changes in workload over time) for both conditions. We prefer the approach over a time trial performance protocol as the latter may induce additional variability in performance and pacing levels in athletes inexperienced with such type of exercise (i.e. field hockey, sailing, beach volleyball) due to learning effects [Citation64]. We also considered adding a familiarization session to our protocol, allowing randomization of the two other sessions. However, representatives of TeamNL and sports federations, advised against such an approach due to the busy training schedules of elite athletes and the impracticability to expose them to multiple exercise tests within a short period of time. Therefore, we deliberately chose the current approach that allows us to use personalized protocols, obtain thermoregulatory responses and performance outcomes by two study visits only. Another limitation of our study is that the exercise protocol does not reflect the nature of sport-specific activities and related (behavioral) thermoregulatory responses, hampering direct translation to a field setting. However, outcomes of our standardized exercise test may aid coaches to specifically collect field data in athletes with excessive responses.
Conclusion
Taken together, the Thermo Tokyo study used high-resolution (thermo)physiological data from individualized maximal exercise tests in combination with extensive assessment of anthropometric measures and thermal modeling to construct a deeply phenotyped dataset of a large cohort of Olympic and Paralympic athletes exercising in simulated control and Tokyo conditions. Findings of this study can be used to inform elite athletes and coaches on how heat stress impacts their individual (thermo)physiological responses and, based on these data, to advise which countermeasures (i.e. heat acclimation, cooling interventions, rehydration plan) need to be taken to allow safe and maximal performance in the challenging environmental conditions of the Tokyo 2020 Olympic and Paralympic Games.
Disclosure of potential conflicts of interest
No potential conflict of interest was reported by the authors.
Additional information
Funding
References
- Gerrett N, Kingma BRM, Sluijter R, et al. Ambient conditions prior to Tokyo 2020 Olympic and Paralympic Games: considerations for acclimation or acclimatization strategies. Front Physiol. 2019;10(414):414.
- Kakamu T, Wada K, Smith DR, et al. Preventing heat illness in the anticipated hot climate of the Tokyo 2020 Summer Olympic Games. Environ Health Prev Med. 2017;22(1):68.
- Vanos JK, Thomas WM, Grundstein AJ, et al. A multi-scalar climatological analysis in preparation for extreme heat at the Tokyo 2020 Olympic and Paralympic Games. Temperature. 2020;7(2):191–214.doi:https://doi.org/10.1080/23328940.2020.1737479.
- VanosJ. The heat is on: bracing for impacts in Tokyo. Temperature. 2020;7(1):1–2.doi:https://doi.org/10.1080/23328940.2020.1719625.
- Kristoffersen M, Sandbakk O, Ronnestad BR, et al. Comparison of short-sprint and heavy strength training on cycling performance. Front Physiol. 2019;10:1132.
- Lucía A, Hoyos J, Pérez M, et al. Inverse relationship between VO2max and economy/efficiency in world-class cyclists. Med Sci Sports Exerc. 2002;34(12):2079–2084.
- American College of Sports M, Armstrong LE, Casa DJ, Millard-Stafford M, et al. American college of sports medicine position stand. Exertional heat illness during training and competition. Med Sci Sports Exerc. 2007;39(3):556–572.
- Sawka MN, Leon LR, Montain SJ, et al. Integrated physiological mechanisms of exercise performance, adaptation, and maladaptation to heat stress. Compr Physiol. 2011;1(4):1883–1928.
- Cheuvront SN, Haymes EM. Thermoregulation and marathon running: biological and environmental influences. Sports Med. 2001;31(10):743–762.
- Kenefick RW, Cheuvront SN, Sawka MN. Thermoregulatory function during the marathon. Sports Med. 2007;37(4–5):312–315.
- Bouchama A, Knochel JP. Heat stroke. N Engl J Med. 2002;346(25):1978–1988.
- Casa DJ, DeMartini JK, Bergeron MF, et al. National athletic trainers’ association position statement: exertional heat illnesses. J Athl Train. 2015;50(9):986–1000.
- Wendt D, van Loon LJ, Lichtenbelt WD. Thermoregulation during exercise in the heat: strategies for maintaining health and performance. Sports Med. 2007;37(8):669–682.
- Racinais S, Nichols D, Travers G, et al. Health status, heat preparation strategies and medical events among elite cyclists who competed in the heat at the 2016 UCI road world cycling championships in qatar. Br J Sports Med. 2020;54(16):1003–1007.
- Periard JD, Eijsvogels TMH, Daanen HAM. Exercise under heat stress: thermoregulation, hydration, performance implications and mitigation strategies. Physiol Rev. 2021. doi:https://doi.org/10.1152/physrev.00038.2020
- Joyner MJ, Coyle EF. Endurance exercise performance: the physiology of champions. J Physiol. 2008;586(1):35–44.
- Periard JD, Racinais S. Performance and pacing during cycle exercise in hyperthermic and hypoxic conditions. Med Sci Sports Exerc. 2016;48(5):845–853.
- Racinais S, Periard JD, Karlsen A, et al. Effect of heat and heat acclimatization on cycling time trial performance and pacing. Med Sci Sports Exerc. 2015;47(3):601–606.
- Mitchell JB, Rogers MM, Basset JT, et al. Fatigue during high-intensity endurance exercise: the interaction between metabolic factors and thermal stress. J Strength Cond Res. 2014;28(7):1906–1914.
- Nybo L, Rasmussen P, Sawka MN. Performance in the heat-physiological factors of importance for hyperthermia-induced fatigue. Compr Physiol. 2014;4(2):657–689.
- Racinais S, Ihsan M. Why should I test my athletes in the heat several months before Tokyo 2020? Br J Sports Med. 2020;54(12):700–701.
- Weinert D, Waterhouse J. The circadian rhythm of core temperature: effects of physical activity and aging. Physiol Behav. 2007;90(2–3):246–256.
- Wilkinson DM, Carter JM, Richmond VL, et al. The effect of cool water ingestion on gastrointestinal pill temperature. Med Sci Sports Exerc. 2008;40(3):523–528.
- Bongers C, Hopman MTE, Eijsvogels TMH. Validity and reliability of the myTemp ingestible temperature capsule. J Sci Med Sport. 2018;21(3):322–326.
- Bongers C, Daanen HAM, Bogerd CP, et al. Validity, reliability, and inertia of four different temperature capsule systems. Med Sci Sports Exerc. 2018;50(1):169–175.
- Sawka MN, Noakes TD. Does dehydration impair exercise performance? Med Sci Sports Exerc. 2007;39(8):1209–1217.
- Gagge AP, Stolwijk JAJ, Hardy JD. Comfort and thermal sensations and associated physiological responses at various ambient temperatures. Environ Res. 1967;1(1):1–20.
- Borg G. Perceived exertion as an indicator of somatic stress. Scand J Rehabil Med. 1970;2(2):92–98.
- Norton KI. Standards for anthropometry assessment. In: Norton KI, Eston RG, editors. Kinanthropometry and exercise physiology. 4 ed. London: Routledge; 2018. p. 68–137.
- CDC. National Health and Nutrition Examination Survey (NHANES): body composition procedures manual 2018 [27-10-2020]. Available from: https://wwwn.cdc.gov/nchs/data/nhanes/2017-2018/manuals/Body_Composition_Procedures_Manual_2018.pdf
- NASA. Anthropology research project staff, Webb associates, editors. Anthropometric source book, volume I: anthropometry for designers. NASA reference publication 1024. Yellow Springs, Ohio: NASA; 1978.
- NASA. Anthropology research project staff, Webb associates, editors. Anthropometric source book, volume II: a handbook of anthropometric data. NASA Reference Publication 1024 Yellow Springs, Ohio: NASA; 1978.
- Havenith G, Fiala D. Thermal indices and thermophysiological modeling for heat stress. Compr Physiol. 2015;6(1):255–302.
- Fiala D, Psikuta A, Jendritzky G, et al. Physiological modeling for technical, clinical and research applications. Front Biosci (Schol Ed). 2010;2(3):939–968.
- Psikuta A, Fiala D, Laschewski G, et al. Validation of the Fiala multi-node thermophysiological model for UTCI application. Int J Biometeorol. 2012;56(3):443–460.
- Hawley JA, Noakes TD. Peak power output predicts maximal oxygen uptake and performance time in trained cyclists. Eur J Appl Physiol Occup Physiol. 1992;65(1):79–83.
- Ainsworth BE, Haskell WL, Herrmann SD, et al. The compendium of physical activities tracking guide: healthy lifestyles Research Center, College of Nursing & Health Innovation, Arizona State University; 2011. [cited 2020 Mar 03]; Available from: https://sites.google.com/site/compendiumofphysicalactivities
- Teunissen LP, de Haan A, de Koning JJ, et al. Telemetry pill versus rectal and esophageal temperature during extreme rates of exercise-induced core temperature change. Physiol Meas. 2012;33(6):915–924.
- Girard O, Racinais S. Combining heat stress and moderate hypoxia reduces cycling time to exhaustion without modifying neuromuscular fatigue characteristics. Eur J Appl Physiol. 2014;114(7):1521–1532.
- Mohr M, Nybo L, Grantham J, et al. Physiological responses and physical performance during football in the heat. PLoS One. 2012;7(6):e39202.
- Racinais S, Moussay S, Nichols D, et al. Core temperature up to 41.5 masculineC during the UCI road cycling world championships in the heat. Br J Sports Med. 2019;53(7):426–429.
- Stevens CJ, Ross ML, Periard JD, et al. Core temperature responses to elite racewalking competition. Int J Sports Physiol Perform. 2020;15(6):892–895.
- Racinais S, Ihsan M, Taylor L, et al. Hydration and cooling in elite athletes: relationship with performance, body mass loss and body temperatures during the Doha 2019 IAAF World Athletics Championships. Br J Sports Med. 2021; bjsports–2020–103613.
- Veltmeijer MT, Eijsvogels TM, Thijssen DH, et al. Incidence and predictors of exertional hyperthermia after a 15-km road race in cool environmental conditions. J Sci Med Sport. 2015;18(3):333–337.
- Veltmeijer MT, Thijssen DH, Hopman MT, et al. Within-subject variation of thermoregulatory responses during repeated exercise bouts. Int J Sports Med. 2015;36(8):631–635. doi:https://doi.org/10.1080/23328940.2018.1540964.
- van Delden M, Bongers C, Broekens D, et al. Thermoregulatory burden of elite sailing athletes during exercise in the heat: a pilot study. Temperature. 2019;6(1):66–76. doi:https://doi.org/10.1080/23328940.2018.1540964.
- Periard JD, Eijsvogels T, Daanen HAM, et al. Hydration for the Tokyo Olympics: to thirst or not to thirst? Br J Sports Med. 2021;55(8):410–411.
- Costa RJS, Gaskell SK, McCubbin AJ, et al. Exertional-heat stress-associated gastrointestinal perturbations during Olympic sports: management strategies for athletes preparing and competing in the 2020 Tokyo Olympic Games. Temperature (Austin). 2020;7(1):58–88.
- Bongers CC, Hopman MT, Eijsvogels TM. Cooling interventions for athletes: an overview of effectiveness, physiological mechanisms, and practical considerations. Temperature. 2017;4(1):60–78.doi:https://doi.org/10.1080/23328940.2016.1277003.
- Gibson OR, James CA, Mee JA, et al. Heat alleviation strategies for athletic performance: a review and practitioner guidelines. Temperature. 2020;7(1):3–36.doi:https://doi.org/10.1080/23328940.2019.1666624.
- Marino FE, Mbambo Z, Kortekaas E, et al. Advantages of smaller body mass during distance running in warm, humid environments. Pflugers Arch. 2000;441(2–3):359–367.
- Dennis SC, Noakes TD. Advantages of a smaller bodymass in humans when distance-running in warm, humid conditions. Eur J Appl Physiol Occup Physiol. 1999;79(3):280–284.
- Havenith G. Human surface to mass ratio and body core temperature in exercise heat stress—a concept revisited. J Therm Biol. 2001;26(4–5):387–393.
- Epstein Y, Shapiro Y, Brill S. Role of surface area-to-mass ratio and work efficiency in heat intolerance. J Appl Physiol Respir Environ Exerc Physiol. 1983;54(3):831–836.
- Tilkens MJ, Wall-Scheffler C, Weaver TD, et al. The effects of body proportions on thermoregulation: an experimental assessment of Allen’s rule. J Hum Evol. 2007;53(3):286–291.
- Flouris AD, Schlader ZJ. Human behavioral thermoregulation during exercise in the heat. Scand J Med Sci Sports. 2015;25(Suppl 1):52–64.
- van Cutsem J, Roelands B, De Pauw K, et al. Subjective thermal strain impairs endurance performance in a temperate environment. Physiol Behav. 2019;202:36–44.
- Tyler CJ, Sunderland C. Cooling the neck region during exercise in the heat. J Athl Train. 2011;46(1):61–68.
- Flood TR, Waldron M, Jeffries O. Oral L-menthol reduces thermal sensation, increases work-rate and extends time to exhaustion, in the heat at a fixed rating of perceived exertion. Eur J Appl Physiol. 2017;117(7):1501–1512.
- Cheung SS, McLellan TM. Heat acclimation, aerobic fitness, and hydration effects on tolerance during uncompensable heat stress. J Appl Physiol. 1998;84(5):1731–1739.
- Cramer MN, Jay O. Explained variance in the thermoregulatory responses to exercise: the independent roles of biophysical and fitness/fatness-related factors. J Appl Physiol. (1985). 2015;119(9):982–989.
- Griggs KE, Stephenson BT, Price MJ, et al. Heat-related issues and practical applications for Paralympic athletes at Tokyo 2020. Temperature. 2020;7(1):37–57.doi:https://doi.org/10.1080/23328940.2019.1617030.
- Paulson T, Goosey-Tolfrey V. Current perspectives on profiling and enhancing wheelchair court sport performance. Int J Sports Physiol Perform. 2017;12(3):275–286.
- Corbett J, Barwood MJ, Parkhouse K. Effect of task familiarisation on distribution of energy during a 2000 m cycling time trial. Br J Sports Med. 2009;43(10):770–774.