
ABSTRACT
This study investigated the effect of heat stress on locomotor activity within international field hockey at team, positional and playing-quarter levels. Analysis was conducted on 71 matches played by the Malaysia national men’s team against 24 opponents. Fixtures were assigned to match conditions, based on air temperature [COOL (14 ± 3°C), WARM (24 ± 1°C), HOT (27 ± 1°C), or VHOT (32 ± 2°C), p < 0.001]. Relationships between locomotor metrics and air temperature (AIR), absolute and relative humidity, and wet bulb globe temperature (WBGT) were investigated further using correlation and regression analyses. Increased AIR and WBGT revealed similar correlations (p < 0.01) with intensity metrics; high-speed running (AIR r = −0.51, WBGT r = −0.45), average speed (AIR r = −0.48, WBGT r = −0.46), decelerations (AIR r = −0.41, WBGT r = −0.41), sprinting efforts (AIR r = −0.40, WBGT r = −0.36), and sprinting distance (AIR r = −0.37, WBGT r = −0.29). In comparison to COOL, HOT, and VHOT matches demonstrated reduced high-speed running intensity (−14–17%; p < 0.001), average speed (−5-6%; p < 0.001), sprinting efforts (−17%; p = 0.010) and decelerations per min (−12%; p = 0.008). Interactions were found between match conditions and playing quarter for average speed (+4-7%; p = 0.002) and sprinting distance (+16-36%; p < 0.001), both of which were higher in the fourth quarter in COOL versus WARM, HOT and VHOT. There was an interaction for “low-speed” (p < 0.001), but not for “high-speed” running (p = 0.076) demonstrating the modulating effect of air temperature (particularly >25°C) on pacing within international hockey. These are the first data demonstrating the effect of air temperature on locomotor activity within international men’s hockey, notably that increased air temperature impairs high-intensity activities by 5–15%. Higher air temperatures compromise high-speed running distances between matches in hockey.
Introduction
Increased air temperature, particularly >25°C, appears detrimental to running performance in elite middle- and long-distance endurance events [Citation1]. The magnitude of performance decrement is proportional to both the event duration and the temperature difference versus purported optimal conditions for endurance performance of ~10–15°C [Citation2]. Increased atmospheric water vapor (i.e. humidity) and exposure to solar radiation (i.e. direct sunlight) also concurrently exacerbate the decrement [Citation3,Citation4]. Therefore, it is the interplay between high internal metabolic heat production (i.e. exercise intensity), clothing, and the environment, that determines heat storage and increases in body temperature, leading to performance impairment. Increased body temperature does not directly impact performance, with elite endurance athletes demonstrating resistance to core temperatures >40°C [Citation5], and team-sport athletes eliciting core temperatures of 39–40°C [Citation6–8]. However, the combination of cardiovascular strain [Citation9] and elevated skin temperature that occur when air temperature increases impairs performance via multiple mechanisms [Citation10], including behavioral modifications of exercise intensity [Citation11,Citation12].
Team-sports, such as field hockey (hockey), are characterized by high aerobic demands (mean ~85% of maximum heart rate) [Citation13] and intermittent/repeated bouts of sprint activity (21 ± 7 per game) [Citation14]. In combination, this activity profile provides a greater thermal challenge than continuous intensity exercise of the same mean intensity [Citation15]. The effect of air temperature on repeated-sprint performance is more complex than endurance performance. Increased locomotor muscle temperature can enhance muscle force production [Citation16], however, a point occurs where muscle temperature related benefits acquiesce to cardiovascular and metabolic strain [Citation17]. Laboratory experiments have shown elevated core and muscle temperatures to impair repeated-sprint performance by ~10% [Citation18], with this impairment consistent across hot-dry and hot-humid environment [Citation19]. Consequently, locomotor data from the 2014 FIFA soccer World Cup revealed consistent reductions in both high-intensity activity (e.g. the number of sprints) and the distance covered at high-intensity, in hot (wet-bulb globe temperature [WBGT] 34°C) versus cooler conditions (WBGT 19°C) [Citation20]. Ambient (air) temperature appears central to this effect, having been shown to elicit a greater effect on soccer match outcomes than relative humidity [Citation21]. Whilst equivalent analyses regarding international hockey have not been published, decreased 15 m repeated-sprint performance has been observed in hockey players during laboratory protocols in the heat (30°C [Citation22]).
Compared with other team-sports, modern hockey is characterized by a high average speed during matches (127 ± 15 m.min−1), with considerable high-speed (1191 ± 328 m, >14.5 km.h−1) and sprinting volumes (401 ± 144 m, >19 km.h−1) [Citation14]. Hockey is therefore considered a repeated-sprint activity, interspersed with low-intensity activities [Citation13]. We have previously identified locomotor outputs to reduce across playing quarters in international men’s hockey [Citation14]. We and others [Citation23,Citation24] have also found that the volume and intensity of outputs differs between playing positions. Notably, defenders accrue longer playing times (+27% versus forwards). However, forwards display higher playing intensities (+17% average speed versus defenders), and perform greater high-intensity and sprint activities per min (+50% sprinting distance versus defenders) [Citation14]. Fourteen matches played by the Singapore national team (26–33°C) indicated that players regulate low-intensity activity (<15 km.h−1), with high-intensity activity maintained across playing quarters [Citation25]. Whether this “pacing” profile is evident across varying air temperatures, and how different playing positions are affected, is unknown. Unlike in other team-sports, any behavioral modifications to high-intensity activity within hockey matches may be attenuated by the four-quarter match structure, which affords more regular rest periods. Furthermore, hockey permits unlimited substitutions, which are utilized to maintain team-level outputs [Citation26]. Therefore, the nature of any modifications to the activity profile within hockey under high air temperatures, may be different to other team-sports.
The aim of this study was to investigate the effect of heat stress on whole-match locomotor activity, and across playing quarters, within international men’s hockey. We hypothesized that at a team level, volume and intensity metrics characterizing sprint and high-intensity activity would decrease with increased heat stress (characterized by air temperature, absolute and relative humidity, and WBGT). Secondly, we hypothesized that high-intensity locomotor activities (i.e. high-speed running, sprinting distance, and sprinting efforts) of forwards would be to a greater extent than defenders, given they undertake more high-intensity activities per game. Thirdly, we hypothesized a reduction in high-intensity activities, during the fourth playing quarter in conditions where heat stress was greater.
Methods
Participants
Twenty-seven males from the Malaysia national hockey team (2018 world ranking [WR] #12, 2019 WR #11) participated in the study (age 25 ± 4 years, stature 172 ± 5 cm, body mass 68 ± 6 kg, sum of 7 skinfolds 45.3 ± 10.8 mm). The study had institutional ethical approval and all analysis was conducted retrospectively on anonymous data, in accordance with the Declaration of Helsinki (2013).
Design
A retrospective analysis was undertaken of 71 international matches played between March 2018 and November 2019 against 24 different opponents (WR 12 ± 11, range 1–60). Each player participated in 40 ± 20 matches (range 9–66). Data were derived from official matches and tournaments including: Hockey World Cup, Asian Games, Asian Champions Trophy, and World Series Finals. In line with other similar experiments [Citation21,Citation27], for correlation analyses, air temperature (range 9–40°C) and relative humidity (R.H.) data (range 19–100%) were extracted from the Integrated Surface Database (National Oceanic and Atmospheric Administration) and “weather underground” website referenced by the World Meteorological Organization. The most proximal location to the corresponding stadia was utilized. Absolute humidity was calculated according to established equations [Citation28] (Absolute humidity = {6.112 × exp[(17.67 × T)/(T + 243.5)] × RH × 2.1674}/(273.15 + T) where T is the dry bulb temperature and RH the relative humidity). Only air temperature was used for the group analysis, given the greater number of assumptions related to the estimation of WBGT using established models [Citation29]. Temperatures were separated into four conditions designed to create groups of similar sample size and distribution: cool (COOL: temperature <20.0°C, n = 14), warm (WARM: temperature 20.1–25.0°C, n = 10), hot (HOT: temperature 25.1–30.0°C, n = 31), and very-hot (VHOT: temperature >30.0°C, n = 16). Locomotor/accelerometer data are reported as volume (i.e. total values) and intensity (i.e. relative to playing time [per min]). Matches played in COOL took place in the Americas (n = 6), Australasia (n = 5) and Europe (n = 3) average time difference −6 hours. WARM took place in Asia (n = 7), Europe (n = 3) average time difference −2 hours. HOT took place in Asia (n = 23), Australasia (n = 3), Europe (n = 3) average time difference −1 hours. VHOT took place in Asia (n = 9), Australasia (n = 1), Europe (n = 1), middle east (n = 5) average time difference −1 hour. Three matches in WARM, twelve matches in HOT, and six matches in VHOT were played in Malaysia.
Data collection and processing
Following a 10 min central pitch localization, data were collected using triaxial 100 Hz accelerometer/10 Hz GPS units (G5, firmware v.7.40, Catapult Sports, Australia) [Citation14]. Players were familiarized with equipment from daily training and used the same device and vest where possible. Units were worn throughout the warm-up (~35-min) and national anthems (4-min). For one tournament (six matches), players used different devices from the same manufacturer (Catapult S5, firmware v.7.32). Measures of GPS quality; horizontal dilution of precision (HDOP: 0.75 ± 0.14) and satellite number (11.6 ± 0.8) were considered excellent by the manufacturer guidelines.
Devices were downloaded using a Catapult Sports docking station and processed using Openfield software (version 2.3.3, build #52,841). Match data were processed live, by the same individual. Data associated with large breaks in play were excluded, ensuring data used for analysis pertained to periods where the game clock is running and represents ’ball-in-play time’ [Citation25]. Each player’s individual playing time was used to calculate intensity data. Running velocities above and below 14.5 km.h−1 were considered “high-” and “low-speed running”, respectively. High-intensity accelerations and decelerations were processed from GPS data (Catapult Gen2) when exceeding 2.0 m.s−2. Velocity and acceleration dwell times were 1.0 and 0.4 s, respectively. Data from the inertial measurement unit were used to calculate Playerload. Accelerations, decelerations, and left/right changes of direction processed from the inertial measurement unit (IMU) were categorized as “very high-intensity” (VHI) when exceeding 3.5 m.s−2, and combined into a single metric of multi-directional load (total VHI movements), processed using inertial movement analysis (“IMA”) V2 [Citation30]. Match files not meeting our previously described inclusion criteria [Citation14] were discarded (3 cases).
Statistical analysis
Data are presented as mean ± SD and were analyzed using SPSS (version 26, SPSS Inc, USA) with alpha set at p < 0.05. All outcome variables met assumptions for normality of distribution using histograms, boxplots, and measures of skewness and kurtosis, prior to analysis. Pearson’s correlation coefficient was used to identify associations between heat stress parameters and locomotor activity data, at the team level (match average). Relationships were classified as; trivial: 0.00–0.09; small: 0.10–0.29; moderate: 0.30–0.49; large: 0.50–0.69; very-large: 0.70–0.89; nearly perfect: 0.90–0.99 and perfect: 1.00 [Citation31]. Linear regression was used to identify the ability of air temperature and WBGT to predict locomotor activities. One-way independent ANOVA were used to analyze the effect of air temperature on the team average locomotor activity, across four conditions (COOL, WARM, HOT, and VHOT), with Bonferroni post-hoc analyses. To determine the impact of playing position and match quarters (Q1, Q2, Q3, and Q4), a total of 4335 individual playing-quarter records were utilized, with players categorized as defenders (n = 353), midfielders (n = 365), or forward (n = 388). Two-way between subjects ANOVA were used to investigate changes between temperatures, with regards to position and two-way mixed ANOVA were also used to investigate changes between temperatures across match quarters, with Bonferroni correction utilized post-hoc.
Results
Effect of temperature on team locomotor activity
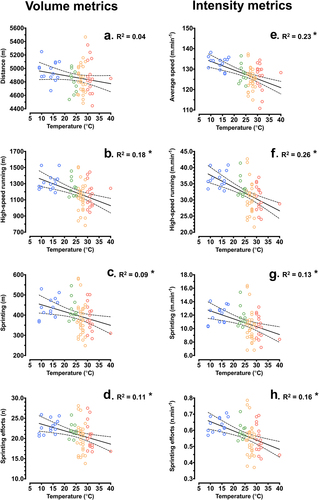
Air temperatures, humidity, and WBGT of each condition are shown in . There were differences in air temperature (f = 240.0, p < 0.001), absolute humidity (f = 19.4, p < 0.001), and WBGT (f = 131.3, p < 0.001) between match conditions, but not for relative humidity (f = 1.6, p = 0.195). At the team level (i.e. team average), significant correlation coefficients (all r = −0.26–0.51) and regression equations (all p < 0.05) were observed between air temperature, absolute humidity, and playing duration, average speed, high-speed running (volume and intensity), sprinting distance (volume and intensity), sprinting efforts (volume and intensity), Playerload (volume and intensity), acceleration efforts (intensity), and deceleration efforts (volume and intensity), see and . No relationships (all p > 0.05) were observed for the team’s (average); total distance, low-speed running (volume or intensity), acceleration efforts (volume), or VHI movements (volume or intensity). For WBGT, significant correlation coefficients (all r = −0.20–0.46) and regression equations (all p < 0.05) were observed between air temperature and playing duration, average speed, total distance, low-speed running (volume), high-speed running (volume and intensity), sprinting distance (volume and intensity), sprinting efforts (volume and intensity), Playerload (volume and intensity), acceleration efforts (intensity), and deceleration efforts (volume and intensity), see and . No relationships (all p > 0.05) were observed for low-speed running (intensity) or VHI movements (volume or intensity).
Table 1. Mean ± SD of volume and intensity metrics for all matches and for each condition (COOL, WARM, HOT, and VHOT).
Figure 1. Panel of scatter plots demonstrating the relationship between temperature and volume (panels a-d) and intensity (panels e-h) metrics.
The [team] average for high-speed running volume (f = 5.5, p = 0.002), total sprinting efforts (f = 2.9, p = 0.041), and total decelerations (f = 3.2, p = 0.029) were greater in COOL than both HOT and VHOT. Full post-hoc analysis is contained in and . Average total distance, low speed running, sprinting distance, Playerload, accelerations, and VHI movements did not differ across temperatures (p > 0.05). When adjusted for playing time (intensity), [team] average speed (f = 7.7, p < 0.001), high-speed running (f = 8.6, p < 0.001), sprinting distance (f = 4.0, p = 0.011), sprint efforts (f = 4.1, p = 0.010), Playerload (f = 7.3, p < 0.001), and deceleration efforts (f = 4.3, p = 0.008) were all higher in COOL, than both HOT and VHOT ( and ). Low-speed running, accelerations, and VHI movements did not differ between temperatures (p > 0.05). Differences for each temperature condition versus the grand mean are displayed in .
Figure 2. Mean ± SD panel of selected volume (panels B&C) and intensity (panels D-I) metrics depicting responses across conditions (COOL, WARM, HOT, VHOT).
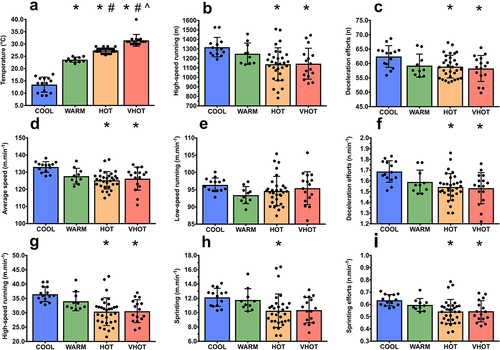
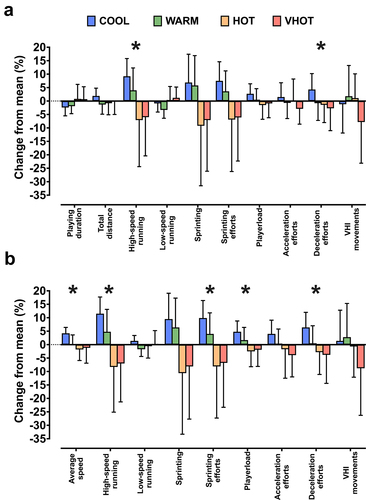
Figure 3. Summary figure outlining the change (%) in volume (a) and intensity (b) metrics in COOL, WARM, HOT and VHOT from the group mean.
Effect of temperature on playing position
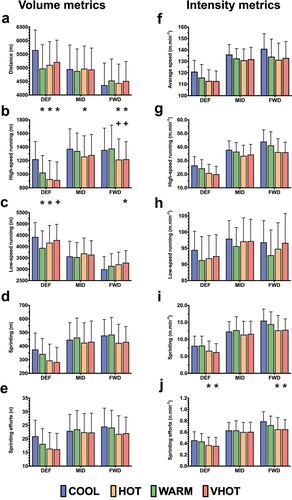
Differences between positions are displayed in and full post-hoc comparisons are contained within supplementary . Interaction effects were observed between playing positions and temperatures for total playing duration (f = 2.9, p = 0.009) and total distance (f = 4.2, p < 0.001), high-speed distance (f = 2.8, p = 0.010), low-speed distance (f = 3.6, p = 0.001), Playerload (f = 4.2, p < 0.001), and total deceleration efforts (f = 3.3, p = 0.003). When adjusted for playing time, sprinting efforts (f = 2.3, p = 0.033) and acceleration efforts (f = 2.4, p = 0.027) demonstrated interaction effects.
Figure 4. Mean ± SD panel of positional responses across conditions (COOL, WARM, HOT, VHOT).
Effect of temperature across playing quarters
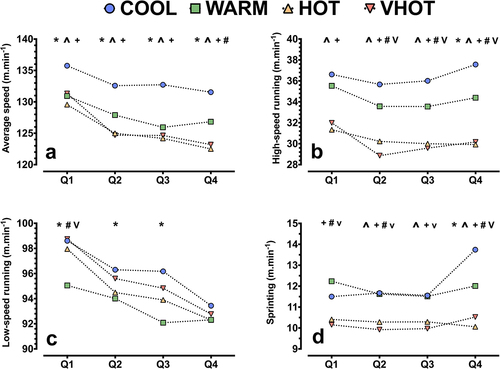
Differences across playing quarters are displayed in and full post-hoc comparisons are contained within Supplementary . Interaction effects were observed between playing-quarter and temperatures for the [team] average high-speed running volume (f = 2.1, p = 0.030), sprinting distance (f = 3.5, p < 0.001), and sprinting efforts (f = 2.3, p = 0.015). For intensity, interaction effects were found for [team] average speed (f = 3.0, p = 0.002), low speed running (f = 2.4, p = 0.011), sprinting distance (f = 3.6, p < 0.001), Playerload (f = 4.6, p < 0.001), acceleration efforts (f = 2.4, p = 0.009), and deceleration efforts (f = 3.1, p = 0.001).
Figure 5. Panel of A – average speed (m.min−1), B – high speed running (m.min−1), C – low speed running (m.min−1), and D – sprinting distance (m.min−1) responses across playing quarters and conditions (circle = COOL, square = WARM, triangle = HOT, nabla = VHOT). Error bars removed for clarity.
Discussion
In accordance with our first hypothesis, the team average high-intensity and sprinting distances reduced with increased air temperature, absolute humidity, and WBGT. Most notably, there was a large correlation between with air temperature, and a moderate correlation with WBGT and absolute humidity, for high-speed running per min. Relative humidity demonstrated small/insignificant correlations suggesting utilising this metric alone to be without merit. The largest decrements in locomotor activity were found for high-intensity activities during HOT (27 ± 1°C) and VHOT (32 ± 2°C) matches, compared with COOL (14 ± 3°C) and WARM (24 ± 1°C). Interestingly, the performance decline did not continue to extend beyond those observed in HOT conditions, suggesting this may be a “threshold” beyond which the impact on performance does not continue to worsen. Comparatively, low-intensity activities and total distance were maintained. These data, derived from a highly ranked international team, also revealed greater effects of air temperature on high-intensity activities of defenders and forwards, compared with midfielders.
Team whole-match responses
At the team level, air temperatures exceeding 25°C (i.e. HOT and VHOT conditions) elicited a detrimental effect on high-intensity activities (i.e. high-speed running, sprinting distance, sprinting efforts, and decelerations). These metrics revealed the largest percentage changes and regression models explaining large proportions of variance (). These data are the first to examine the specific effect of air temperature within international hockey and support previous laboratory protocols that demonstrated impaired hockey skill and repeated-sprint performance in the heat (30°C) [Citation22]. Whilst ambient temperature alone (range 7–41°C) has been demonstrated to be a poor predictor of international cross-country cycling performance [Citation28], data from team sports, e.g. hockey, seemingly demonstrates different outcomes. Compared with cycling, running involves lower movement speeds and higher heat production for a given metabolic rate. Therefore, performance is affected at much lower ambient temperatures [Citation32]. Moreover, we identified comparable correlations for air temperature and predicted WBGT with most locomotor variables. This indicates that the addition of relative humidity does not meaningfully explain a greater proportion of the variance in locomotor activity within the current dataset. Indeed, the effect of relative humidity is likely to be most pronounced when ambient temperature is already high (i.e. ‘hot-wet) and thus would elicit less effect on matches in cooler conditions, such as COOL and WARM. The reduction in high-intensity activities that we observed is also congruent with international soccer, where reduced sprinting efforts (~-14%) and high-speed distance (~-8%), were observed in high, versus low heat stress matches played at the 2014 FIFA World Cup [Citation20]. It is interesting to note this comparable trend in hockey, despite differences between the match format of these team-sports, with hockey played across four, shorter playing quarters and utilizing unlimited substitutions giving players more frequent rest periods.
We observed no differences in total distance, however average speed (m.min−1) was significantly lower during HOT/VHOT versus COOL conditions. The range of mean differences between COOL and WARM, HOT and VHOT conditions was ~5–8 m.min−1, which may be considered meaningful given the smallest worthwhile change (SWC) previously identified for this team is 3 m.min−1 [Citation14]. When average speed is segregated into “low-” (<14.5 km.h−1) and “high-speed” (>14.5 km.h−1) running intensities, we found differences between COOL and HOT/VHOT conditions for high-speed, but not low-speed running. Moreover, the respective correlation and regression coefficients for low-speed (r = −0.11) and high-speed running (r = −0.51) corroborate a stronger effect of air temperature on high-speed running only. The reduction of high-speed running contrasts with reported within-match activity profiles of team-sports, whereby both hockey [Citation25] and soccer [Citation33] players have been shown to regulate low-intensity activity, but preserve high-speed activities across playing quarters/match halves.
In soccer, whole-match sprinting output (>19.5 km.h−1) appears unaffected by heat stress [Citation33]. We similarly found the relationships with changes in sprinting (>19 km.h−1) intensity to be weaker (sprinting [m.min−1] r = −0.38) than for high-speed running (>14.5 km.h−1). This indicates sprinting may be more of a requisite activity, possibly due to the demands of the game/opponent, and it is activity within the ~15-19 km.h−1 range (“striding”) that players regulate between matches of higher air temperatures. Such modulations of exercise intensity would serve to avoid further increases in core and muscle temperature, thereby maintaining cardiovascular strain in comparison to cooler conditions [Citation7,Citation33]. Despite high-intensity activity being associated with greater metabolic heat production and heat storage [Citation15], these actions appear critical for success in team-sports [Citation34], thus players are required to offset lower intensity activity to reduce overall intensity.
Team within-match responses
We hypothesized a greater reduction in high-intensity activities in Q4 of HOT and VHOT matches, compared with WARM and COOL. Although thermal strain develops progressively and proportionally to the volume and intensity of physical work completed [Citation35], we did not predict notable reductions during Q3, as this is preceded by a 10-min half-time break. Mechanistic support for this can be derived from the work of Mohr et al. [Citation7], who observed average sprint speed to be different between the first and second halves in soccer, but unmodified during the first 15-min of each half, despite the ~22°C temperature gradient between fixtures. Whilst we did not observe an interaction between temperature and playing quarter for high-speed running intensity, there was an interaction for sprinting distance. This predominantly reflected increased sprinting during Q4 in COOL matches (supplementary ), rather than a decrement per se during HOT and VHOT. Nevertheless, the capacity for greater sprinting in the final quarter is notable, as this may be a critical period to determine the match result of team-sports [Citation36].
We also observed an interaction for average speed, characterized by larger reductions from Q1 to Q4 in VHOT (−8 m.min−1, −6%) and HOT (−7 m.min−1, −5%), compared with WARM (−4 m.min−1, −3%) and COOL (−4 m.min−1, −3%). Overall, our data supports previous statements regarding the within-match pacing profile in hockey [Citation25], that high-intensity activities remain relatively consistent across playing quarters, with low-intensity outputs regulated. In soccer, it has been suggested that such behavioral “pacing” modifications may serve to complement technical skills during the match (e.g. pass completion rate) whilst ensuring high-intensity locomotor activity is maintained [Citation20]. Similarly, others have reported a “cool” soccer match (21°C), to display a deficit in high-speed running in the second versus first half, which was not observed in an equivalent “hot” match (43°C) [Citation7]. Such patterns contrast with our third hypotheses and are surprising given the potential for hotter conditions to induce greater fatigue. Indeed, we [Citation14], and others [Citation13,Citation23,Citation25] have reported overall locomotor activity reducing in latter halves/quarters of elite hockey. Interactions between locomotor activity and temperature are therefore evidently complex. Possible explanations for the opposing atypical high-intensity responses of others [Citation7] could be that fatigue is induced by a higher absolute playing intensity in cooler conditions, which is greater than that evoked by temperature. Pacing strategies may also be altered in the heat from the start of the fixture in an anticipatory manner [Citation11]. Nevertheless, our data demonstrate that in combination with tactically driven player rotations and hockey player’s modulation of low-intensity work, there is a minimal decrement of high-intensity outputs across playing quarters. However, in COOL conditions, players were able to increase sprinting distance in Q4 from Q3 (+20%), which was apparently not possible in warmer matches.
Positional responses
We have previously observed that forwards play shorter durations and report greater high-intensity activities versus defenders, but not midfielders [Citation14]. Thus, we hypothesized that high-intensity activities of forwards would be impacted by air temperature more than defenders. In contrast to our hypothesis, the volume (total distance, high- and low-speed running distances) and intensity (sprinting and acceleration efforts per min) of locomotor outputs are most greatly affected in both defenders and forwards, compared with midfielders. Whilst changes in average speed from Q1 to Q4 were comparable in defenders (−8 m.min−1, −7%) and forwards (−8 m.min−1, −6%), for high-speed running activity, the reduction in defenders (−25%) was considerably higher than either forwards (−10%) or midfielders (−7%). Defenders may therefore acquiesce to thermal strain because of longer playing durations in combination with intense activity. For forwards, the impact of air temperature is likely reflecting the greater high-intensity nature of their activity [Citation7,Citation15]. Finally, whilst the locomotor outputs of forwards and defenders appear sensitive to changes in air temperature, the locomotor demands for midfielders were maintained, which may elicit greater physiological strain in tournaments with repeated HOT/VHOT matches.
Limitations
Within stadia, pitch-side measurement of air flow, solar radiation, temperature, and humidity throughout the game would have enhanced the precision of our analysis by enabling a more precise calculation of WBGT or additional heat stress calculations [Citation21]. Future work should implement this methodological approach to improve the characterization of the environmental conditions of each match. Therefore, we cannot fully discern the specific influences of other factors that modify thermal equilibrium, such as solar radiation and absolute/relative humidity [Citation28,Citation37]. The collection of physiological (e.g. skin/core/muscle temperatures) and perceptual data (e.g. exertion/thermal comfort/thermal sensation) would add greater mechanistic insight into the factors eliciting locomotor changes across different temperatures [Citation7]; however, there remains logistical challenges with collecting many of these data during competitive international fixtures.
Given the home environmental conditions of the team analyzed can be categorized as equatorial (i.e., hot and humid), it is possible that some level of acclimatization was present within the players. Accordingly, a greater performance reduction may be observed in those teams residing in cooler conditions, warranting further investigation. The location of the match did not appear to influence our analysis given COOL presented players with the greatest time difference and travel challenge. Furthermore, we highlight that match-day preparations for some, but not all VHOT matches included established cooling interventions [Citation38]. This may have mitigated larger reductions in locomotor activity. Our findings also cannot extend to teams that have vastly different substitution policies, for example 8–10 min rotations versus the 4–8 min approach typically utilized by the team in this study. Finally, it is beyond the scope of this analysis to examine the influence of training/competition phase, competition importance, match outcome, and opponent ranking, though the authors acknowledge that these are also influencing factors in team sport locomotor activity.
Practical applications
The relationship between air temperature and locomotor activity within a leading international men’s hockey team habituating a hot climate, is noteworthy for coaches and practitioners within this global sport. Average speed is a widely used metric used to compare player’s locomotor activity during matches and our data indicate a 10°C increase in air temperature, may elicit a 4 m.min−1 reduction in average speed (± 5 m.min−1 standard error of the estimate). This equates to −3% of the grand mean () and is comparable to the SWC of 3 m.min−1 [Citation14]. The strongest relationship between volume metrics and temperature was for high-speed running, which indicates just a 1°C increase in air temperature, may elicit a − 11 m reduction in high-speed distance across a match. Therefore, a 6°C increase is a comparable reduction (−5% versus grand mean) to the SWC (66 m). Thus, these data allude to potential performance advantages from implementing practical pre-competition acute [Citation39–41] and chronic heat alleviation strategies [Citation42–44] to mitigate these declines. These strategies may include modified warm-ups [Citation45], prompt cooling [Citation46], rehydration and specific nutritional interventions [Citation38] on/after a game day. In the weeks prior, preparation such as acclimation [Citation47], that uses controlled exercise protocols [Citation48], overdressing [Citation49,Citation50], hot water immersion [Citation51], or a combination of approaches [Citation52], can be implemented to suit individual/team needs. Furthermore, our data indicate that defenders and forwards appear to be the positions most impacted by increases in air temperature. Individual-level heat alleviation screening may therefore be relevant for these positions, prior to tournaments with heat stress (i.e. >25°C air temperature) in order to minimize decrements to locomotor output. However, the maintenance of external demands for midfielders, irrespective of temperature, may exacerbate physiological strain during HOT and VHOT matches, potentially impairing between-match recovery. Given the high match density of hockey tournaments (often eight games in <16 days), specific recovery strategies for heat stress should be considered for all players, but especially for midfielders, the intention of these being to reduce exercise-heat orientated detriments in physical, cognitive, and perceptual parameters [Citation53–57].
Finally, coaches should consider modifications to substitution strategies across all positions (i.e. shorter rotation durations), to help mitigate expected increases in body temperature and/or perceived thermal discomfort, that may result in reduced locomotor activity and/or greater physiological strain. Moreover, coaches can anticipate the largest reduction in “striding” activity during hotter matches and may therefore wish to adjust in-possession/out of possession tactics accordingly.
Conclusion
These are the first match data demonstrating the effect of air temperature on locomotor activity within international men’s hockey. Increased air temperature impairs high-intensity activities by 5–15%. Coaches and practitioners should consider acute and chronic heat alleviation approaches to mitigate performance and health consequences of competing in hot environments.
Abbreviations
Supplemental Material
Download MS Word (35.1 KB)Disclosure statement
No potential conflict of interest was reported by the authors.
Supplementary material
Supplemental data for this article can be accessed here.
Additional information
Funding
References
- Guy JH, Deakin GB, Edwards AM. Adaptation to hot environmental conditions: an exploration of the performance basis, procedures and future directions to optimise opportunities for elite athletes. Sports Med. 2014;45(3):303–311.
- Ely MR, Cheuvront SN, Roberts WO. Impact of weather on marathon-running performance. Med Sci Sports Exerc. 2007;39(3):487–493.
- Otani H, Kaya M, Tamaki A. Effects of solar radiation on endurance exercise capacity in a hot environment. Eur J Appl Physiol. 2016;116(4):769–779.
- Maughan RJ, Otani H, Watson P. Influence of relative humidity on prolonged exercise capacity in a warm environment. Eur J Appl Physiol. 2012;112(6):2313–2321.
- Racinais S, Moussay S, Nichols D. Core temperature up to 41.5°C during the UCI road cycling world championships in the heat. Br J Sports Med. 2019;53:426–429.
- Duffield R, Coutts AJ, Quinn J. Core temperature responses and match running performance during intermittent-sprint exercise competition in warm conditions. J Strength Cond Res. 2009;23(4):1238–1244.
- Mohr M, Nybo L, Grantham J. Physiological responses and physical performance during football in the heat. PLoS One. 2012;7(6):e39202.
- Henderson MJ, Chrismas BCR, Stevens CJ. Changes in core temperature during an elite female rugby sevens tournament. Int J Sports Physiol Perform. 2020;15(4):571–580.
- González-Alonso J, Crandall CG, Johnson JM. The cardiovascular challenge of exercising in the heat. J Physiol. 2008;586(1):45–53.
- Nybo L, Rasmussen P, Sawka MN. Performance in the heat-physiological factors of importance for hyperthermia-induced fatigue. Compr Physiol. 2014;4:657–689.
- Flouris AD, Schlader ZJ. Human behavioral thermoregulation during exercise in the heat. Scand J Med Sci Sports. 2015;25:52–64.
- James CA, Hayes M, and Willmott AGB. Defining the determinants of endurance running performance in the heat. Temperature. 2017;4:314–329. doi:10.1080/23328940.2017.1333189.
- Lythe J, Kilding AE. Physical demands and physiological responses during elite field hockey. Int J Sports Med. 2011;32(7):523–528.
- James CA, Gibson OR, Dhawan A. Volume and intensity of locomotor activity in international men’s field hockey matches over a two-year period. Front Sport Act Living. 2021;3:108.
- Maxwell NS, Aitchison TC, Nimmo MA. The effect of climatic heat stress on intermittent supramaximal running performance in humans. Exp Physiol. 1996;81(5):833–845.
- Sargeant AJ. Effect of muscle temperature on leg extension force and short-term power output in humans. Eur J Appl Physiol Occup Physiol. 1987;56(6):693–698.
- Girard O, Brocherie F, Bishop DJ. Sprint performance under heat stress: a review. Scand J Med Sci Sports. 2015;25:79–89.
- Drust B, Rasmussen P, Mohr M. Elevations in core and muscle temperature impairs repeated sprint performance. Acta Physiol Scand. 2005;183(2):181–190.
- Hayes M, Castle PC, Ross EZ. The influence of hot humid and hot dry environments on intermittent-sprint exercise performance. Int J Sports Physiol Perform. 2014;9(3):387–396.
- Nassis GP, Brito J, Dvorak J. The association of environmental heat stress with performance: analysis of the 2014 FIFA world cup Brazil. Br J Sports Med. 2015;49(9):609–613.
- Brocherie F, Girard O, Farooq A. Influence of weather, rank, and home advantage on football outcomes in the gulf region. Med Sci Sports Exerc. 2015;47(2):401–410.
- Sunderland C, Nevill ME. High-intensity intermittent running and field hockey skill performance in the heat. J Sports Sci. 2005;23(5):531–540.
- Morencos E, Romero-Moraleda B, Castagna C. Positional comparisons in the impact of fatigue on movement patterns in hockey. Int J Sports Physiol Perform. 2018;13(9):1149–1157.
- Cunniffe E, Grainger A, McConnell W. A comparison of peak intensity periods across male field hockey competitive standards. Sports. 2021;9(5):58.
- Ihsan M, Yeo V, Tan F. Running demands and activity profile of the new four-quarter match format in men’s field hockey. J Strength Cond Res. 2018;35:512–518.
- Lythe J, Kilding AE. The effect of substitution frequency on the physical and technical outputs of strikers during field hockey match play. Int J Perform Anal Sport. 2013;13(3):848–859.
- Zhou C, Hopkins WG, and Mao W. Match performance of soccer teams in the Chinese super league—effects of situational and environmental factors. Int J Environ Res Public Health. 2019;6(21):16. https://www.mdpi.com/1660-4601/16/21/4238.
- Brocherie F, Fischer S, and De Larochelambert Q. Influence of environmental factors on olympic cross-country mountain bike performance. Temperature. 2020;7(2):149–156. doi:10.1080/23328940.2020.1761577.
- Liljegren J, Carhart R, Lawday P. Modeling the wet bulb globe temperature using standard meteorological measurements. J Occup Environ Hyg. 2008;5(10):645–655.
- James CA, Dhawan A, and Jones T. Quantifying training demands of a 2-week in-season squash microcycle. Int J Sports Physiol Perform. 2021;16:779–786. https://pubmed.ncbi.nlm.nih.gov/33547264/.
- Hopkins WG, Marshall SW, and Batterham AM. Progressive statistics for studies in sports medicine and exercise science. Med. Sci. Sports Exerc. 2009:3–12. doi: 10.1249/MSS.0b013e31818cb278. https://pubmed.ncbi.nlm.nih.gov/19092709/
- Junge N, Jørgensen R, and Flouris AD. Prolonged self-paced exercise in the heat - environmental factors affecting performance. Temperature. 2016;3:539–548. doi:10.1080/23328940.2016.1216257.
- Özgünen KT, Kurdak SS, Maughan RJ. Effect of hot environmental conditions on physical activity patterns and temperature response of football players. Scand J Med Sci Sports. 2010;20:140–147.
- Gabbett TJ. Influence of the opposing team on the physical demands of elite rugby league match play. J Strength Cond Res. 2013;27(6):1629–1635.
- Gibson OR, Willmott AGB, James CA. Power relative to body mass best predicts change in core temperature during exercise-heat stress. J Strength Cond Res. 2017;31:403–414.
- Hausler J, Halaki M, Orr R. Application of global positioning system and microsensor technology in competitive rugby league match-play: a systematic review and meta-analysis. Sport Med. 2016;46(4):559–588.
- Muhamed AMC, Atkins K, and Stannard SR. The effects of a systematic increase in relative humidity on thermoregulatory and circulatory responses during prolonged running exercise in the heat. Temperature. 2016;3(3):455–464. doi:10.1080/23328940.2016.1182669.
- Gibson OR, James CA, and Mee JA. Heat alleviation strategies for athletic performance: a review and practitioner guidelines. Temperature. 2020;7(1):1–34. doi:10.1080/23328940.2019.1666624.
- James CA, Richardson AJ, Watt PW. Physiological responses to incremental exercise in the heat following internal and external precooling. Scand J Med Sci Sports. 2015;25:190–199.
- James CA, Richardson AJ, Willmott AG. Short-term heat acclimation and precooling, independently and combined, improve 5 km running performance in the heat. J Strength Cond Res. 2018;32:1366–1375.
- Castle PC, Macdonald AL, Philp A. Precooling leg muscle improves intermittent sprint exercise performance in hot, humid conditions. J Appl Physiol. 2006;100(4):1377–1384.
- Ruddock AD, Thompson SW, and Hudson SA. Combined active and passive heat exposure induced heat acclimation in a soccer referee before 2014 FIFA world cup. Springerplus. 2016;5:617. https://pubmed.ncbi.nlm.nih.gov/27330883/.
- Willmott AGB, Hayes M, James CA. Once- and twice-daily heat acclimation confer similar heat adaptations, inflammatory responses and exercise tolerance improvements. Physiol Rep. 2018;6:e13936.
- Gibson OR, Mee JA, Taylor L. Isothermic and fixed-intensity heat acclimation methods elicit equal increases in Hsp72 mRNA. Scand J Med Sci Sports. 2015;25:259–268.
- Racinais S, Cocking S, and Périard JD. Sports and environmental temperature: from warming-up to heating-up. Temperature. 2017;4(3):227–257. doi:10.1080/23328940.2017.1356427.
- Bongers CCWG, Hopman MTE, and Eijsvogels TMH. Cooling interventions for athletes: an overview of effectiveness, physiological mechanisms, and practical considerations. Temperature. 2017;4:60–78. doi:10.1080/23328940.2016.1277003.
- Pryor JL, Johnson EC, and Roberts WO. Application of evidence-based recommendations for heat acclimation: individual and team sport perspectives. Temperature. 2018;6:37–49. doi:10.1080/23328940.2018.151653.
- Gibson OR, Mee JA, Tuttle JA. Isothermic and fixed intensity heat acclimation methods induce similar heat adaptation following short and long-term timescales. J Therm Biol. 2015;49–50:55–65.
- Willmott AGB, Gibson OR, and James CA. Physiological and perceptual responses to exercising in restrictive heat loss attire with use of an upper-body sauna suit in temperate and hot conditions. Temperature. 2018;5:162–174. doi:10.1080/23328940.2018.1426949.
- Mee JA, Peters S, Doust JH. Sauna exposure immediately prior to short-term heat acclimation accelerates phenotypic adaptation in females. J Sci Med Sport. 2018;21(2):190–195.
- Zurawlew MJ, Walsh NP, Fortes MB. Post‐exercise hot water immersion induces heat acclimation and improves endurance exercise performance in the heat. Scand J Med Sci Sports. 2015;26:745–754.
- Ruddock AD, Thompson SW, Hudson SA. Combined active and passive heat exposure induced heat acclimation in a soccer referee before 2014 FIFA world cup. Springerplus. 2016;5(1):617.
- Piil JF, Lundbye-Jensen J, and Trangmar SJ. Performance in complex motor tasks deteriorates in hyperthermic humans. Temperature. 2017;4(4):420–428. doi:10.1080/23328940.2017.1368877.
- Willmott AGB, Hayes M, and James CA. Heat acclimation attenuates the increased sensations of fatigue reported during acute exercise-heat stress. Temperature. 2020;7:178–190. doi:10.1080/23328940.2019.1664370.
- Kingma BRM, Roijendijk LMM, and Maanen L Van. Time perception and timed decision task performance during passive heat stress. Temperature. 2020;8:53–63. doi:10.1080/23328940.2020.1776925.
- Korte JQ de, Bongers CCWG, and Hopman MTE. Performance and thermoregulation of Dutch olympic and paralympic athletes exercising in the heat: rationale and design of the thermo Tokyo study. The journal Temperature toolbox. Temperature. 2021; 8(3) :1–14. https://doi.org/10.1080/23328940.2021.1925618 https://www.ncbi.nlm.nih.gov/pmc/articles/PMC8409773/.
- Veneroso CE, Ramos GP, and Mendes TT. Physical performance and environmental conditions: 2014 world soccer cup and 2016 summer Olympics in Brazil. Temperature. 2015;2(4):439–440. doi:10.1080/23328940.2015.1106637.