
ABSTRACT
The synthetic cathinone (“bath salt”) methylone induces a hyperthermia response and with chronic administration tolerance to this hyperthermia has been reported. The microbiome-gut-brain axis has been implicated in multiple bodily systems and pathologies, and intentional manipulation of the gut-microbiome has yielded clinically significant results. Here, we examined the effects of bi-directional Fecal Microbiota Transplantation (FMT) between methylone-induced hyperthermic tolerant (MHT) and methylone-naïve (MN) rats. Rats treated with methylone once per week developed tolerance to methylone-induced hyperthermia by the fourth week. Once tolerant, daily bi-directional FMT between the two groups were performed for seven days prior to the next methylone treatment. The FMT abated the developed tolerance in the MHT group. When treated with methylone for the first time following FMT, recipient MN rats displayed significant tolerance to hyperthermia despite it being their initial drug treatment. Post-FMT, MHT rats displayed elevations in norepinephrine and expression of UCP1, UCP3 and TGR5 in brown adipose tissue, with reductions in expression of TGR5 and UCP3 in skeletal muscle. The pre- and post-FMT methylone tolerance phenotypes of transplant recipients are concurrent with changes in the relative abundance of several classes of Proteobacteria, most evident for Gammaproteobacteria and Alphaproteobacteria. MHT recipients demonstrated a marked increase in the relative proportion of the Firmicutes class Erysipelotrichia. These findings suggest that transplantation of gut-microbiomes can confer phenotypic responses to a drug and that the microbiome may be playing a major role in sympathomimetic-mediated hyperthermia.
Abbreviations: 3,4-methylenedioxymethamphetamine (MDMA); methylone-induced hyperthermic tolerant (MHT); methylone-naïve (MN); fecal microbiota transplantation (FMT); uncoupling protein (UCP); subcutaneous (sc); intraperitoneal (ip); brown adipose tissue (BAT); skeletal muscle (SKM); sympathetic nervous system (SNS); norepinephrine (NE); quantitative PCR (qRT-PCR); quantification cycle (Cq); High Performance Liquid Chromatography-Electrochemical Detection (HPLC-EC); amplicon sequence variants (ASVs); principal coordinates analysis (PCoA); permutational multivariate analysis (PERMANOVA)
Introduction
Use of the sympathomimetic agent methylone, the β-keto analog of 3,4-methylenedioxymethamphetamine (MDMA), in warm ambient environments has been shown to induce an acute rise in body temperature [Citation1], and fatal hyperthermia upon ingestion of methylone has been documented in case reports [Citation2]. Of the synthetic cathinones (aka “Bath Salts”), methylone was found to be the most potent thermogen [Citation1]. Hyperthermia mediated by sympathomimetic agents, such as methylone, has both central and peripheral mechanisms. Centrally, activation of dopaminergic [Citation3] and serotonergic [Citation4] receptors in thermoregulatory circuits in the hypothalamus [Citation5–7] contribute to the activation of the sympathetic nervous system (SNS). Peripherally, elevated levels of circulating norepinephrine acting at the α1- adrenergic receptor induce peripheral vasoconstriction, resulting in a decrease of heat dissipation [Citation8]. Concurrently, activity of norepinephrine at the β3-adrenergic receptor results in increases of free fatty acids and the activation of mitochondrial uncoupling proteins (UCP). These UCP enzymes then facilitate proton flux from the intermembrane space to the mitochondrial matrix in a manner that sheds the kinetic energy as heat instead of producing ATP, otherwise known as non-shivering thermogenesis [Citation9]. Despite the neural pathways being well-documented, there is preliminary evidence of another contributor to the activation of sympathomimetic-induced thermogenesis: the gut microbiome (GM) [Citation10]. Critically, [Citation10] demonstrated that the administration of nonabsorbable antibiotics attenuated the hyperthermia mediated by MDMA and reduced the expression of genes that regulate UCP synthesis, namely, UCP1, UCP3 and the bile acid receptor gene TGR5. Although there is growing appreciation for the contributions of the GM in mediating a variety of bodily responses, the GM’s role in the mechanistic basis for temperature generation as a result of sympathomimetic agent stimulation remains poorly understood.
Recent studies have demonstrated that the microbiome-gut-brain axis plays a major role in maintaining body temperature regulation [Citation10–12]. [Citation11] demonstrated that gut microbiome depletion as a result of treatment with multiple cocktails of antibiotics altered thermogenesis in mice exposed to cold environmental temperatures. The antibiotic treated mice displayed significantly lower core body temperatures at ambient room temperature, consistent with decreased UCP1 gene expression in brown adipose tissue. [Citation10] demonstrated that the administration of antibiotics for 14 days prior to MDMA treatment significantly reduced core body temperature increases, and blunted expression of UCP1, UCP3 and the bile acid receptor gene TGR5 (a regulator of UCP expression). These latter findings suggest a potential link between the microbiome-gut-brain axis and sympathomimetic-induced hyperthermia.
In addition to thermogenesis, the microbiome-gut-brain axis has become increasingly implicated in a variety of physiologies and conditions, including obesity, cancer, and neurodegenerative disorders such as Parkinson’s Disease and Alzheimer’s [Citation13–15], and has quickly become a major target area in attempts to advance our understanding of the bacterial influence on health and disease. Naturally, researchers have begun to manipulate the microbiome in attempts to modulate these pathways and have begun to elucidate the communication between the gut, the brain, endocrine, and immune systems. To date, microbial manipulations have shown to effectively mitigate depressive symptoms in mice, demonstrating the ability to modulate mood through selective transfer of the microbiome [Citation16]. In other medicinal areas, fecal microbiota transplantations (FMT), where one organisms gut bacteria are transplanted into the GI tract of another organism, have been used to successfully treat inflammatory bowel disease [Citation17] and Clostridium difficile infection [Citation18], further establishing that the intentional manipulation of the gut microbiome can result in novel and clinically relevant outcomes. While previous experiments have indicated that microbial manipulations are capable of treating and inducing disease states, to date no analyses have been performed to explore the role they play in development of phenotypic responses such as drug-induced hyperthermia.
In the present study, we hypothesized that chronic exposure to methylone drives changes in bacterial populations within the gastrointestinal tract that contribute to the methylone hyperthermic tolerance development [Citation19] as shown in our previous work. If so, then transplanting the microbiota of methylone-induced hyperthermic tolerant rats to animals naïve to methylone administration could influence the microbial component to the temperature response and impart the same tolerance to temperature increases upon the first dosing of methylone despite their naivety to the drug. In the same way, we hypothesized that the transfer from naïve rats to those with an existing methylone-induced hyperthermia tolerance could effectively abate the observed tolerance. Here, we sought to determine the effects of bi-directional fecal microbiota transplant on the temperature responses of naïve and methylone-induced hyperthermic tolerant rats.
Materials and methods
Animals
Adult, male (N = 12, 275–300 g) Sprague-Dawley (Rattus norvegicus domesticus) rats were obtained from Envigo (Indianapolis, IN). Animals were housed one per cage (cage size: 21.0 × 41.9 × 20.3 cm) and maintained on a 12:12 h light/dark schedule. Animals were individually housed in order to monitor food intake and for ease of fecal dropping collection. To maximize the thermogenic response, animals were maintained at an ambient temperature of 25°C to 28°C and fed a minimum 10% fat diet [Citation20,Citation21]. Animals received food in the form of a ground powder in glass container in order to habituate them for fecal microbial transplant methods. Animal maintenance and research were conducted in accordance with the eighth edition of the Guide for the Care and Use of Laboratory Animals; as adopted and promulgated by the National Institutes of Health, with protocols approved by the Bowling Green State University Animal Care and Use Committee.
Drug and chemicals
Racemic methylone was obtained from Cayman Chemicals (Ann Arbor, MI) as a hydrochloride salt. On the day of the study, methylone solutions were made fresh at a concentration of 10 mg/mL in 0.9% normal saline. All other chemicals and reagents were obtained from Sigma Chemical (St. Louis, MO).
Induction of hyperthermia tolerance
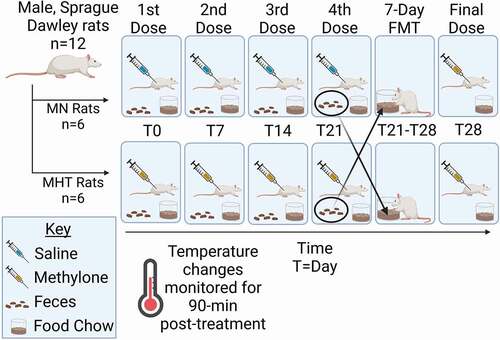
Male rats were randomly assigned into two groups of six (6) each, the first group being the treatment group and the second serving as the saline controls. On testing day, all subjects were weighed prior to drug challenge, and a core temperature reading was taken with a rectal thermometer at time zero. On treatment days, the ambient temperature averaged 27.4 ± 0.12°C. Following the first temperature measurement each week, the male treatment group received a 10 mg/kg subcutaneous (sc) dose of methylone, and the control group received an equal volume of saline solution. In order to induce tolerance to the methylone-induced hyperthermia, one group of animals were treated with methylone once a week for 4 weeks. This treatment group was referred to as the methylone hyperthermic-tolerant (MHT) group. The second treatment group was treated with saline once a week for 4 weeks. This treatment group was referred to as the methylone-naïve (MN) group [Citation19]. Between weeks 3 and 4, fecal droppings were collected for the FMT from both the MHT and MN groups, with reciprocal transplantations then performed. Therefore, all animals experienced coprophagy under identical circumstances. The first day of FMT was considered day 0 and served as the fecal composition baseline for each group. After 7 days of FMT, the fecal droppings were again collected to determine differences before (day 0) and after (day 7) FMT. Following drug treatment, core temperature readings were recorded at the 30-, 60- and 90-minute time points. This treatment schedule was maintained once a week for a total of four consecutive weeks, until the hyperthermic response of the methylone treatment group was statistically insignificant. Those animals treated weekly for four weeks with methylone were designated as MHT and those that received only saline for four weeks were designated MN. depicts the study design. Rectal temperatures were measured in all animals using a Physiotemp Thermalert TH-8 thermocouple (Physitemp Instruments, Clifton, NJ) attached to a RET-2 (rat) rectal probe coated with white petrolatum prior to insertion. RET-2 probes were inserted 5 cm into the rectum, where they remained for at least fifteen seconds, until a stable temperature was obtained.
Figure 1. Study design. Animals were treated once a week with either saline or methylone (10 mg/kg, sc). Tolerance to the hyperthermia induced by methylone was seen after the fourth week of treatment and the FMT between the treatment groups occurred in the 4th and 5th week time period. Following the one week FMT period, a final dose of methylone was given and temperature monitored in 30 minute intervals for a total of 90 minutes before tissue collection. This figure was generated using BioRender.
Fecal microbiota transplantation
As mentioned previously, animals had up to this point become habituated to consuming ground food powder. To initiate FMT, cage fecal droppings from the weekly period directly prior to the hyperthermia-tolerant treatment were collected from each cage and pooled by MHT and MN groups. Droppings were ground into powder in a mortar and pestle and mixed in with food powder in a 15% (w/w) ratio in a fashion similar to that described in the literature [Citation22,Citation23]. Animals were provided 30 g of food powder daily. Beginning the same day after the treatment in which methylone rats did not exhibit statistically significant hyperthermia, bi-directional FMT was conducted where each rat received ab libitum access to FMT food powder of alternate group. This feeding schedule continued every day for 7 days until the next methylone treatment schedule. Food consumption was monitored daily.
Upon final treatment day (seven days from previous methylone dose during which FMT was administered daily), all 12 rats received methylone treatment at 10 mg/kg and temperature measurements were recorded as explained previously. After 90-minutes, rats were euthanized with CO2 and cardiac punctures were performed to collect blood samples. Plasma samples were stored at −20°C. Brown adipose tissue (BAT) and skeletal muscle (SKM), namely the gastrocnemius, were removed and flash frozen with liquid nitrogen, before being stored at −80°C.
RNA isolation and qRT-PCR
Total RNA was purified from homogenized pooled SKM and BAT tissues using PureZOL™ RNA Isolation reagent (BioRad, CA) as described [Citation24,Citation25]. RNA concentration and quality were determined using a NanoDrop Spectrophotometer (Thermo, MI) and by 1% agarose gel electrophoresis, respectively. Reverse transcription reactions were performed to synthesize cDNA from 200 ng of total RNA using the iScript™ Reverse Transcription Supermix for RT-qPCR (Biorad, CA). Real-time quantitative PCR (qRT-PCR) was carried out in the CFX Connect Real-Time PCR Detection System (Biorad, CA) using iTaq™ universal SYBR® Green supermix (Biorad, CA). The PCR parameters were as previously described [Citation10,Citation19]. Quantification cycle (Cq) values for all genes were compared and analyzed by using the ∆∆C(t) method [Citation26]. All primer pairs used for the analysis of UCP1, UCP3, TGR5 (a regulator of UCP expression), and actin were as described [Citation10]. Beta-actin was used as a reference gene.
High Performance Liquid Chromatography-Electrochemical Detection (HPLC-EC)
The plasma samples collected from each rat were purified and norepinephrine (NE) was extracted according to the combined methods of [Citation27] and [Citation28]. After extraction, NE levels were assessed using HPLC-EC (Shimadzu, Canby, OR). The mobile phase consisted of 14% methanol, and an 86% mixture of 0.05 M phosphate, 0.03 M citric acid buffer, 0.6 mM octasulfonic acid, and 1.0 mM EDTA-disodium. The pump flow rate was 0.55 ml/min and was set to an operating temperature of 30°C. NE was separated using a PP-ODS II reverse phase C18-column (Shimadzu, Colombia, MD) and identified according to the retention time of the standard, and concentrations were quantified by comparison with peak heights of the standard concentration curve (104–108 pg/μL). The quantification of sample NE concentrations was performed using an Epsilon electrochemical (EC) detector connected to the HPLC. The detector sensitivity was 5 µA and the oxidation potential was fixed at +700 mV using a glassy carbon working electrode versus an Ag/AgCl reference electrode. Lab Solution software was used to integrate and analyze the raw data for determination of norepinephrine levels.
Microbial community analysis
Once tolerance to methylone-induced hyperthermia was displayed (4th week of treatment), week 3 fecal droppings were utilized to initiate FMT. This was considered day 0 which was one day prior to the initiation of FMT. During the 7 days of FMT, individual animal fecal droppings were collected, and the cages changed. On the 7th day of FMT, fecal droppings were collected (day 7) followed by treatment with methylone. Collected feces were stored at −80°C.
Isolation of DNA from fecal droppings was performed using a DNeasy Powersoil Kit according to manufacturer’s instructions (Qiagen Inc., CA). The concentration and quality of the DNA were determined using a NanoDrop Spectrophotometer (Thermo, MI) and by 0.8% agarose gel electrophoresis, respectively.
Isolated DNA samples were submitted to LC Sciences (Houston, TX) for 16S rRNA gene amplicon sequencing, using universal primers (338 F 5’-ACTCCTACGGGAGGCAGCAG-3’, 806 R 5’-GGACTACHVGGGTWTCTAAT-3’) [Citation29] that amplify a ~ 465 bp region spanning the V3 and V4 regions. The amplicon libraries were sequenced on a NovaSeq platform as paired-end reads (2x250 bp). The resulting raw sequence reads were trimmed to remove primers and low-quality ends, then error-corrected and dereplicated using DADA2 (35) to generate amplicon sequence variants (ASVs) of 100% sequence similarity [Citation30]. Taxonomies were assigned using SILVA Release 132 [Citation31] and the NT-16S database, with a confidence level of >0.7. Principal coordinates analysis (PCoA) and permutational multivariate analysis (PERMANOVA) by weighted Unifrac distances were performed on communities using the Vegan package [Citation32] in R.
Statistical analysis
GraphPad InStat v.6.0 software was used to complete all statistical analyses of data except the microbiome data set. The results are presented as the mean ± SEM of the rectal core body temperatures of the treatment/control groups and where appropriate individual number with median are also presented. A mixed two-way ANOVA with a Student-Newman-Keuls post-hoc test was utilized to compare temperature findings When only two groups were compared, a two-tailed t-test was performed. Significance was established at p < 0.05 a priori.
Linear regression and correlation coefficients were determined by plotting individual data points for each subject within the MHT and MN groups (n = 6) for maximal change in temperature following methylone administration and NE levels. The linearity of relationships between plasma NE and maximal change in temperature were determined by linear regression analysis. Statistical significance was determined using a linear relationship ANOVA test.
Results
Methylone-induced changes in body temperature
The maximal temperature change was significantly higher in the MHT compared to the MN controls (p = 0.001) on the first week of treatment (). In the second week, significant hyperthermia was again achieved in the MHT group compared to MN controls (p = 0.001). By week three, hyperthermia was still achieved by MHT group (p = 0.05) compared to maximal temperature change in the MN group. No differences in maximal temperature change were seen within the MHT group between weeks 1 and 2 (p > 0.05); a significantly lower hyperthermic response (p = 0.01) was seen at week three compared to week one. By the fourth week, the hyperthermic response was lost in the MHT group and the temperature did not differ from the MN group (p > 0.05). Throughout the first four weeks of treatment, saline injections did not have an effect on body temperature in the MN group when compared back to the first week of treatment. Weekly core temperature responses and time point changes are presented in supplementary Fig. 1 and , respectively.
Figure 2. Maximal temperature associated with once-a-week dosing of methylone (10 mg/kg, sc). (a) Weekly maximal temperature changes. “FMT” bar between weeks four and five indicates the duration of the fecal microbial transplant between treatments. *indicates significant difference between each week’s maximal temperature change between the MHT and MN group (p < 0.001). ϕ indicates significantly different from MHT maximal temperature change week 1 (p < 0.01). Each value is the average ± SEM (n = 6). (b) Individual animal maximal temperature changes over the five week treatment period. The horizontal black line indicates the median for the MHT group, and the red line is the median for the MN group.
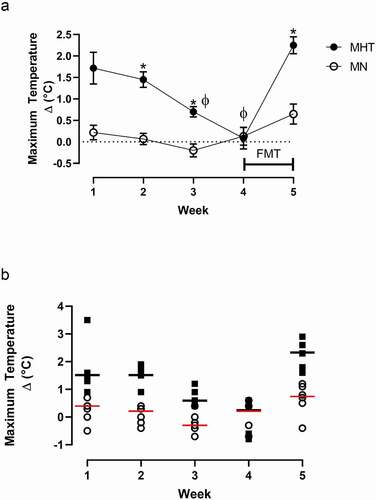
Following FMT between weeks four and five, MHT rats exhibited a complete loss of tolerance to methylone-induced hyperthermia, yielding a substantially increased maximal temperature change (p = 0.001) compared to the previous week where total tolerance was seen. The MN group, who received their first dose of methylone at week 5 following the FMT, did not display a significant change in temperature following methylone treatment (p > 0.05) and responded in a fashion similar to the MHT group after that group had displayed a tolerance in week 4. Food consumption did not vary between the treatment groups duing the FMT period (Supplementary Fig. 3).
Methylone-induced changes in plasma norepinephrine levels
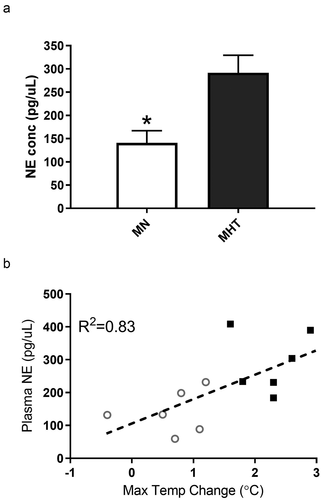
Plasma samples obtained from both groups showed significant increases in circulating norepinephrine levels 90 minutes after methylone treatment (). MN rats that received FMT from MHT rats had lower plasma norepinephrine levels than the corresponding MHT rats that received FMT from the MN animals. Linear regression analysis was performed to compare each animal’s norepinephrine level and the maximal change in temperature induced by methylone. The results demonstrated a significant relationship between plasma levels of norepinephrine and maximal temperature change ().
Figure 3. (a) NE plasma concentrations (pg/µL) for MHT and MN rats following the fifth dose (once a week) of methylone (10 mg/kg, sc) in the MHT group and a single dose of methylone in the MN group. Each value is the average ± SEM (n = 6). *indicates significant differences from MHT group (p = 0.008). (b) Linear correlation between individual plasma NE levels and maximal temperature changes following methylone treatment.
Expression of genes involved in methylone stimulation are modulated by FMT
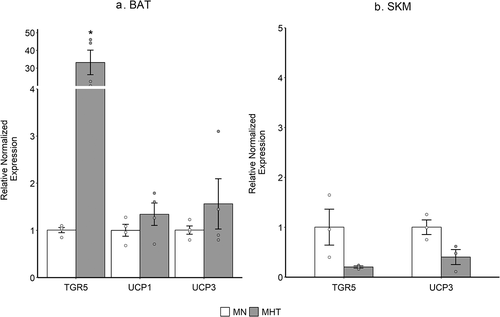
The expression of mRNA was measured by qRT-PCR and a Wilcoxon signed-rank non-parametic test was used to analyze the relative expression of TGR5, UCP1 and UCP3 genes. In the brown adipose tissue (BAT), an increase in expression of all three genes was observed in MHT compared to MN. However, only TGR5 was significantly increased in expression (p-value = 0.05) while the expressions of the UCP1 and UCP3 in MHT were not significantly different from that of MN (). Conversely, in skeletal muscle (SKM), the expression of TGR5 and UCP3 was decreased although not significantly different from that of MN while the expression of UCP1 was below the level of detection ().
Figure 4. (a) Relative mRNA expression of TGR5, UCP1 and UCP3 was measured by qRT-PCR of MHT group compared to MN group in brown adipose tissue (BAT) and (b) in the skeletal muscle (SKM). β-actin was used as a normalization control. Expression of UCP1 in SKM was below the level of detection. Each bar represents the mean ± SEM of pooled samples ran in quadruplicate (BAT) or triplicate (SKM). Statistical analysis was performed with Wilcoxon non-parametric test (p < 0.05). * indicates significant differences of relative gene expression.
Fecal microbiome composition changes associated with FMT
While fecal samples were collected from all animals before and after FMT, not all samples yielded high-quality DNA, as defined by DNA concentration and genome integrity as evidenced by development on 0.8% agarose gels. Therefore, we limited microbiome comparisons to six animals (three MHT, and three MN) for which high-quality DNA had been isolated both prior to (day 0) and following (day 7) FMT.
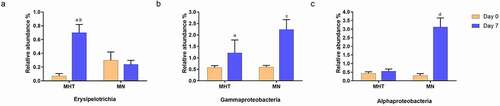
Principal coordinates analysis (PCoA) identified MN and MHT animals as having distinct fecal microbiomes, with greater intra-group similarity in the MHT group than in the MN group (). PERMANOVA confirmed that communities of the treatment groups were significantly different (p = 0.03). Focusing solely on Day 0 animals, the microbiome differences are evident from the PCoA plot though PERMANOVA did not reach statistical significance (p = 0.1), due in part to relatively low replicate count (n = 3 per treatment). Taxonomic comparisons at the phylum level indicated that for both MN and MHT animals, ~80% of the fecal microbiota taxa consisted of Firmicutes (~60%; dominant classes Clostridia and Bacilli) and Bacteroidetes (20%; dominant class Bacteroides), with the Proteobacteria a distant third at 1–6% (). Taxonomic comparisons at the class level provided greater resolution, with changes in several taxa evident following FMT. MHT recipients demonstrated a marked increase in the relative proportion of the Firmicutes class Erysipelotrichia, whereas the reciprocal transplant did not significantly alter Erysipelotrichia levels in MN recipients (). Notably, the relative proportion of Erysipelotrichia was four-fold less in the MHT group than in the MN group. Conversely, for the Proteobacteria classes Gammaproteobacteria and Alphaproteobacteria, relative proportions were similar between MHT and MN animals prior to transplant but increased several folds in each of the MN animal recipients following FMT from MHT donors. In the reciprocal transplants, the relative abundance of Gammaproteobacteria remained similar for two of the three MHT recipients, with the third recipient showing a multifold increase in the relative abundance of Gammaproteobacteria (, MHT6, ). Similarly, Alphaproteobacteria displayed multi-fold increases in each of the three MN animal recipients following FMT, and little change for two of the three MHT recipients, again with same animal showing a several-fold increase following FMT from the MN donor ().
Figure 5. Principal coordinate analysis (weighted, UniFrac; p = 0.019) of overall microbiome composition pre- and post-FMT. Colored circles represent the microbiome of an individual at the 95% confidence interval, with the group membership identified by color, as indicated in the key, where; “MN day 0” (Orange circles) represents untreated control animals prior to FMT, “MN day 7” (green circles) represents untreated control animals following to FMT, “MHT day 0” (blue circles) represents methylone tolerant animals prior to FMT and “MHT day 7” (purple circles) represents methylone tolerant animals following to FMT. Ellipses are added to highlight each experimental group.
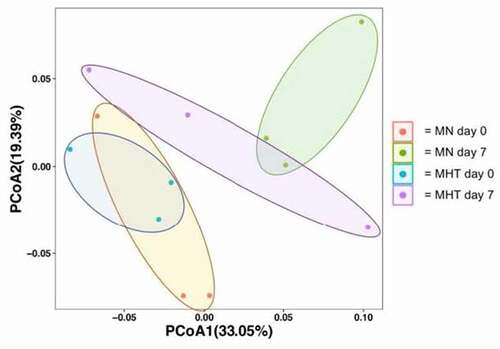
Figure 6. Stacked barplot of the five most abundant bacterial classes identified for individual animals prior to (“0”) and following (“7”) FMT, with classes identified by color, as indicated by the key at the right. The phylum of each class is listed in parentheses. Methylone hyperthermia-tolerant (MHT) and methylone-naive (MN) animals are identified by number.
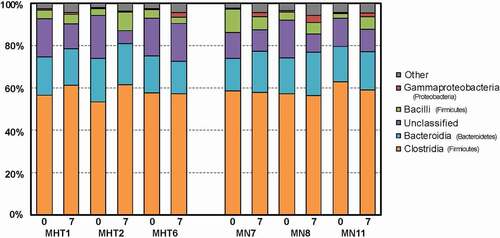
Figure 7. Mean relative percentage of microbiota as the class Erysipelotrichia (a), Gammaproteobacteria (b) and Alphaproteobacteria (c) pre- (day 0) and post- (day 7) FMT. aindicates significantly different than MHT day 0 (p < 0.05); bindicates significantly different than MN day 7 (p < 0.05); cindicates significantly different than MN day 0 (p < 0.05); dindicates significantly different than all other groups (p < 0.001). Each value is the mean ± SEM (n = 3).
Discussion
Here, we demonstrate for the first time that FMT can influence the temperature response changes induced by sympathomimetic agents such as methylone. By the fourth week of treatment, tolerance to the drug-induced hyperthermia had developed. This tolerance response to methylone was seen a week earlier than we had seen in our previous study [Citation19]. Therefore, the FMT was conducted between weeks four and five. Following FMT, the MHT rats exhibited a complete loss of tolerance to methylone-induced hyperthermia, yielding a substantially increased maximal temperature change compared to the previous week where total tolerance was observed. Moreover, the MN group which received their first methylone treatment and would normally be expected to experience significant increases in body temperature, displayed no significant change in temperature after receiving the FMT from MHT donors. This lack of response in the methylone naïve group is intriguing and requires further investigation as to the potential mechanism of the role of dysbiosis or to the specific bacterial changes that may have contributed to this response. Overall, these findings are consistent with a previous study that suggested the potential link between sympathomimetic-induced thermogenesis and gut bacteria [Citation10], and strikingly, provided evidence that the FMT is capable of modulating the temperature response. To our knowledge, these results appear to be the first evidence to demonstrate that a pharmacologically mediated temperature response to a drug can be reproduced from donor to recipient through fecal microbial transplant in an animal model. In this case, based on the norepinephrine differences between the treatment groups, FMT had a substantial influence on the sympathetic nervous system and introduced a tolerance effect to the drug naïve group that would otherwise only occur in subjects that had been repeatedly exposed to the drug.
The restoration of methylone-induced hyperthermia in the MHT group was associated with a significant increase in plasma norepinephrine levels as compared to the MN group which did not display a hyperthermic response. The gut-microbiota has been shown to produce catecholamines [Citation33], and norepinephrine has been suggested to play a key communication role in the microbiome-gut-brain axis. Additionally, exogenously administered norepinephrine can induce Escherichia coli chemotaxis, motility, and virulent gene expression [Citation34] through binding to the bacterial norepinephrine-like receptor, QseC [Citation35]. Given that sympathomimetic agents can increase plasma norepinephrine up to 35-fold [Citation36], it is not surprising that these agents can influence the gut microbiome and vice versa.
The gut microbiome has been linked to sympathomimetic-induced hyperthermia [Citation10] and body temperature regulation in general [Citation11,Citation12]. Intra-gastic supplementation with Lactobacillus paracasei has been shown to increase sympathetic nervous system activity through the increase in lipolysis and brown adipose mediated thermogenesis [Citation37]. [Citation11] found that antibiotic depletion of the gut microbiome prior to cold exposure (4°C) for 48 hours impaired body temperature regulation. This alteration of thermogenesis was attributed mainly to reduced expression of UCP1 and a decrease in the browning process (conversion of white adipose tissue to brown adipose tissue). In a similar fashion, we had found that antibiotic treatment for 10 days prior to MDMA administration significantly attenuates the hyperthermia mediated by MDMA and the expression of UCP1, UCP3 and TGR5 [Citation10].
UCP1 and UCP3 have further been demonstrated to play complementary roles in the onset (UCP1) and maintenance (UCP3) of sympathomimetic-induced hyperthermia [Citation38]. We have previously demonstrated that in male rats, tolerance to methylone-induced hyperthermia occurs between the fourth and fifth weeks following once a week treatment [Citation19]. In that study, the gene expression levels for UCP1, UCP3 and TGR5 were also measured in brown adipose tissue (BAT) and skeletal muscle (SKM). Tolerance was associated with an increase in UCP3 in BAT and increases in UCP1 and UCP3 in skeletal muscle [Citation19]. Here, following FMT, BAT demonstrated an increase in the expression of TGR5, UCP1, and UCP3 in the MHT group relative to the MN group. Conversely, in SKM, both TGR5 and UCP3 gene expression was decreased in the MHT group. These changes are consistent with the key roles UCPs play in mediating sympathomimetic hyperthermia and the restoration of the hyperthermic response following FMT in the MHT treatment group.
Previously, a hyperthermic dose of MDMA was shown to lead to the enrichment of the relative proportion of a Proteus mirabilis strain in the ceca [Citation10]. In that same study, antibiotic treatment not only prevented the Proteus mirabilis enrichment but also attenuated MDMA-induced hyperthermia. [Citation39] examined the effects of synthetic cathinones on the diversity and taxonomic structure of the gut microbiome. Those authors found that the two phyla most altered by the synthetic cathinones were Firmicutes and Bacteroidetes. The genus- and species-level identities of the microbes involved in the present temperature changes are unknown due to the insufficient resolving power of the partial 16S rRNA gene; however, the concordance of changes in the relative abundance of Gammaproteobacteria and Alphaproteobacteria following FMT implicates members of these two classes as potential contributors to the establishment of methylone tolerance. The lower relative abundance of Erysipelotrichia in MHT animals, and its increase following FMT similarly implicates this class as a potential contributor.
There are a number of critical considerations to be made in the interpretation of these data. While the roles that clinical and recreational agents have in contributing to dysbiosis of the microbiome have just begun to be characterized and the overall effects appear to be compound specific, there is often significant individual variation between microbe communities in test subjects [Citation40,Citation41], complicating the interpretation of the changes induced by the drugs. Based upon our experiments, we do not know whether methylone itself is directly mediating changes to the microbiome or if these changes are indirect and secondary to a pharmacodynamic response (e.g. hyperthermia) to the drug. Although the findings in the present study suggest a link between the gut-brain axis and sympathomimetic-induced hyperthermia, the gut microbiome changes may also be playing a peripheral role in altering the thermogenesis mediated by methylone. The use of FMT may have selected for aerobic or facultative anaerobic taxa which may be reflected in our post-FMT taxonomic differences. Changes in drug metabolism have been associated with the gut microbiome, specifically for the sympathomimetic agent amphetamine can bind to tyramine oxidase from Escherichia Coli [Citation42]. In the present study, plasma drug concentrations of methylone were not compared between the two treatment groups. We have previously reviewed the pharmacokinetics of the synthetic cathinones [Citation43]. The synthetic cathinones are primarily excreted in the urine with phase I metabolism being mediated by the P450 system (namely CYP2D6) and therefore, methylone would not be expected to be excreted in the feces. Finally, FMT and other gut microbiome remodeling studies in animal models has shown to be challenging due to several factors that affect the composition and diversity of the core gut microbiome [Citation44,Citation45]. These factors include but not limited to: animal supplier, age, diet, water source, recent transferal and handling, health condition of the animals and housing conditions (bedding type, single vs group-housed, etc.).
In the present study, the bi-directional FMT between MHT and MN resulted in a reversal of the predicted hyperthermic response in the MN group. After displaying tolerance to the hyperthermia mediated by methylone, the FMT from MN to MHT resulted in a return of hyperthermia in animals that had previously displayed tolerance. Given that the gut microbiota has been demonstrated to impact thermoregulation in general [Citation11], the results from the present study further support the contention that the gut microbiome plays a contributing role in the hyperthermia mediated by sympathomimetic agents such as methylone, and that fecal microbial transplants may be able to transfer phenotypic responses to pharmacological agents [Citation46].
Data
BioProject ID PRJNA707312.
Supplemental Material
Download Zip (357.3 KB)Disclosure statement
No potential conflict of interest was reported by the authors.
Supplementary material
Supplemental data for this article can be accessed online at https://doi.org/10.1080/23328940.2022.2069965
Additional information
Funding
References
- Grecco GG, Sprague JE. Impact of functional group modifications on designer phenethylamine induced hyperthermia. Chem Res Toxicol. 2016;29(5):871–878.
- Borek HA, Holstege CP. Hyperthermia and multiorgan failure after abuse of “bath salts” 253 containing 3,4-methylenedioxypyrovalerone. Ann Emerg Med. 2012;60(1):103–105.
- Mechan AO, Esteban B, O’Shea E, et al. The pharmacology of the acute hyperthermic response that follows administration of 3,4-methylenedioxymethamphetamine (MDMA, ‘ecstasy’) to rats. Br J Pharmacol. 2002;135(1):170–180.
- Herin DV, Liu S, Ullrich T, et al. Role of the serotonin 5-HT2A receptor in the hyperlocomotive and hyperthermic effects of (+)-3,4-methylenedioxymethamphetamine. Psychopharmacology (Berl). 2005;178(4):505–513.
- Benamar K, Geller EB, Adler MW. A new brain area affected by 3,4-methylenedioxymethamphetamine: a microdialysis-biotelemetry study. Eur J Pharmacol. 2008;596(1–3):84–88.
- Hargreaves GA, Hunt GE, Cornish JL, et al. High ambient temperature increases 3,4-methylenedioxymethamphetamine (MDMA, “ecstasy”)-induced Fos expression in a region-specific manner. Neuroscience. 2007;145(2):764–774.
- Rusyniak DE, Sprague JE. Toxin-induced hyperthermic syndromes. Med Clin N Am. 2005;89(6):1277–1296.
- Pedersen NP, Blessing WW. Cutaneous vasoconstriction contributes to hyperthermia induced by 3,4-methylenedioxymethamphetamine (Ecstasy) in conscious rabbits. J Neurosci. 2001;21(21):8648–8654.
- Cannon B, Nedergaard J. Brown adipose tissue: function and physiological significance. Physiol Rev. 2004;84(1):277–359.
- Ridge EA, Pachhain S, Choudhury SR, et al. The influence of the host microbiome on 3,4-methylenedioxymethamphetamine (MDMA)-induced hyperthermia and vice versa. Sci Rep. 2019;9(1):4313.
- Li B, Li LM, Lam SM, et al. Microbiota depletion impairs thermogenesis of brown adipose tissue and browning of white adipose tissue. Cell Rep. 2019;26(10):2720–2737.e5.
- Rosenbaum M, Knight R, Leibel RL. The gut microbiota in human energy homeostasis and obesity. Trends Endocrinol Metab. 2015;26(9):493–501.
- Ghaisas S, Maher J, Kanthasamy A. Gut microbiome in health and disease: linking the microbiome-gut-brain axis and environmental factors in the pathogenesis of systemic and neurodegenerative diseases. Pharmacol Ther. 2016;158:52–62.
- Maruvada P, Leone V, Kaplan LM, et al. The human microbiome and obesity: moving beyond associations. Cell Host Microbe. 2017;22(5):589–599.
- Rajagopala SV, Vashee S, Oldfield LM, et al. The human microbiome and cancer. Cancer Prevention Res. 2017;10(4):226–234.
- Zhang Y, Huang R, Cheng M, et al. Gut microbiota from NLPR3-deficient mice ameliorates depressive-like behaviors by regulating astrocyte dysfunction via circHIPK2. Microbiome. 2019;7(1):116–131.
- Wang AY, Popov J, Pai N. Fecal microbial transplant for the treatment of pediatric inflammatory bowel disease. World J Gastroenterol. 2016;22(47):10304–10315.
- Liubakka A, Vaughn BP. Clostridium difficile infection and fecal microbiota transplant. AACN Adv Crit Care. 2016;27(3):324–337.
- Goldsmith RS, Pachhain S, Choudhury SR, et al. Gender differences in tolerance to the hyperthermia mediated by the synthetic cathinone methylone. Temperature. 2019;6:334–340. doi:10.1080/23328940.2019.1648988.
- Dafters RI. Effect of ambient temperature on hyperthermia and hyperkinesis induced by 3,4-methylenedioxymethamphetamine (MDMA or “ecstasy”) in rats. Psychopharmacology (Berl). 1994;114(3):505–508.
- Mills EM, Weaver KL, Abramson E, et al. Influence of dietary fats on ecstasy‐induced hyperthermia. Br J Pharmacol. 2007;151(7):1103–1108.
- Kohl KD, Weiss RB, Cox J, et al. Gut microbes of mammalian herivores facilitate intake of plant toxins. Ecol Lett. 2014;17(10):1238–1246.
- Miller AW, Dale C, Dearing M,D. The induction of oxalate metabolism In Vivo is more effective with functional microbial communities than with functional microbial species. mSystems. 2017;2(5):e00088–17.
- Blaxter M, Mann J, Chapman T, et al. Defining operational taxonomic units using DNA barcode data. Philos Trans R Soc Lond B Biol Sci. 2005;360(1462):1935–1943.
- Callahan BJ, McMurdie PJ, Rosen MJ, et al. DADA2: high-resolution sample inference from Illumina amplicon data. Nat Methods. 2016;13(7):581–583.
- Livak KJ, Schmittgen TD. Analysis of relative gene expression data using real-time quantitative PCR and the 2− ΔΔCT method. Methods. 2001;25(4):402–408.
- Denfeld QE, Habecker BA, Woodward WR. Measurement of plasma norepinephrine and 3,4-dihydroxyphenylglycol: method development for a translational research study. BMC Res Notes. 2018;11(1):248.
- Holmes C, Eisenhofer G, Goldstein DS. Improved assay for plasma dihydroxyphenylacetic acid and other catechols using high-performance liquid chromatography with electrochemical detection. J Chromatogr B. 1994;653(2):131–138.
- Peng W, Yi P, Yang J, et al. Association of gut microbiota composition and function with a senescence-accelerated mouse model of Alzheimer’s Disease using 16S rRNA gene and metagenomic sequencing analysis. Aging (Albany NY). 2018;10(12):4054–4065.
- Mizrahi-Man O, Davenport ER, Gilad Y. Taxonomic classification of bacterial 16S rRNA genes using short sequencing reads: evaluation of effective study designs. PLoS One. 2013;8(1):e53608.
- Pruesse E, Quast C, Knittel K, et al. SILVA: a comprehensive online resource for quality checked and aligned ribosomal RNA sequence data compatible with ARB. Nucleic Acids Res. 2007;35(21):7188–7196.
- Oksanen J, Guillaume Blanchet F, Friendly M, et al., 2020. vegan: community ecology package. R package version 2.5-7. Accessed January 25, 2022. https://CRAN.R-project.org/package=vegan
- Asano Y, Hiramoto T, Nishino R, et al. Critical role of gut microbiota in the production of biologically active, free catecholamines in the gut lumen of mice. Am J Physiol Gastrointest Liver Physiol. 2012;303(11):G1288–95.
- Bansal T, Englert D, Lee J, et al. Differential Effects of epinephrine, norepinephrine, and indole on Escherichia coli O157:H7 Chemotaxis, colonization, and gene expression. Infect Immun. 2007;75(9):4597–4607.
- Clarke MB, Hughes DT, Zhu C, et al. The QseC sensor kinase: a bacterial adrenergic receptor. Proc Natl Acad Sci USA. 2006;103(27):10420–10425.
- Sprague JE, Moze P, Caden D, et al. Carvedilol reverses hyperthermia and attenuates rhabdomyolysis induced by 3,4-methylenedioxymethamphetamine (MDMA, Ecstasy) in an animal model. Crit Care Med. 2005;33(6):1311–1316.
- Tanida M, Shen J, Maeda K, et al. High-fat diet-induced obesity is attenuated by probiotic strain Lactobacillus paracasei ST11 (NCC2461) in rats. Obes Res Clin Pract. 2008;2(3):159–169.
- Riley CL, Dao C, Kenaston MA, et al. The complementary and divergent roles of uncoupling proteins 1 and 3 in thermoregulation. J Physiol. 2016;594(24):7455–7464.
- Angoa-Perez M, Zagorac B, Winters AD, et al. Differential effects of synthetic psychoactive cathinones and amphetamine stimulants on the gut microbiome in mice. PLoS One. 2020;15(1):e0227774.
- Franklin CL, Ericsson AC. Microbiota and reproducibility of rodent models. Lab Anim (NY). 2017;46(4):114–122.
- Human Microbiome Project Consortium. Structure, function and diversity 28of the healthy human microbiome. Nature. 2012;486(7402): 207–214.
- Kumar K, Dhoke GV, Sharma AK, et al. Mechanistic elucidation of amphetamine metabolism by tyramine oxidase from human gut microbiota using molecular dynamics simulations. J Cell Biochem. 2019;120(7):11206–11215.
- Calinski DM, Kisor DF, Sprague JE. A review of the influence of functional group modifications to the core scaffold of synthetic cathinones on drug pharmacokinetics. Psychopharmacology (Berl). 2019;236(3):881–890.
- Ericsson AC, Franklin CL. Manipulating the gut microbiota: methods and challenges. ILAR J. 2015;56(2):205–217.
- Turner PV. The role of the gut microbiota on animal model reproducibility. Animal Model Exp Med. 2018;1(2):109–115.
- Ericsson AC, Davis JW, Spollen W, et al. Effects of vendor and genetic background on the composition of the fecal microbiota of inbred mice. PLoS One. 2015;10(2):e0116704.