
 ?Mathematical formulae have been encoded as MathML and are displayed in this HTML version using MathJax in order to improve their display. Uncheck the box to turn MathJax off. This feature requires Javascript. Click on a formula to zoom.
ABSTRACT
A paradoxical heat sensation (PHS) is the misperception of warmth when the skin is cooled. PHS is uncommon in healthy individuals but common in patients with neuropathy and is associated with reduced thermal sensitivity. Identifying conditions that contribute to PHS may indirectly help us understand why some patients experience PHS. We hypothesized that pre-warming increased the number of PHS and that pre-cooling had minimal effect on PHS. We tested 100 healthy participants’ thermal sensitivity on the dorsum of their feet by measuring detection and pain thresholds to cold and warm stimuli and PHS. PHS was measured using the thermal sensory limen (TSL) procedure from the quantitative sensory testing protocol of the German Research Network on Neuropathic Pain and by using a modified TSL protocol (mTSL). In the mTSL we examined the participants’ thermal detection and PHS after pre-warming of 38°C and 44°C and pre-cooling of 26°C and 20°C. Compared to a baseline condition, the number of PHS responders was significantly increased after pre-cooling (20°C: RR = 1.9 (1.1; 3.3), p = 0.023 and 26°C: RR = 1.9 (1.2; 3.2), p = 0.017), but not significantly after pre-warming (38°C: RR = 1.5 (0.86; 2.8), p = 0.21 and 44°C: RR = 1.7 (.995; 2.9), p = 0.078). Pre-warming and pre-cooling increased the detection threshold of both cold and warm temperatures. We discussed these findings in relation to thermal sensory mechanisms and possible PHS mechanisms. In conclusion, PHS and thermosensation are closely related and pre-cooling can induce PHS responses in healthy individuals.
Introduction
The accurate perception of innocuous and noxious temperatures is a core function of the human thermosensory system. Thermal sensitivity is typically impaired in patients with peripheral and central nervous system disorders [Citation1–4]. This reduced thermal sensitivity may be accompanied by a misperception of warmth when the skin is cooled. This phenomenon is known as a paradoxical heat sensation (PHS) [Citation5–8]. PHS is uncommon in healthy individuals [Citation9] but more common in patients with nervous system lesions where they are thought of as pathological signs that are specific to the body part affected by thermal sensory loss [Citation2]. For example, patients with polyneuropathy commonly have PHS in the feet and to a lesser extent in the hands [Citation8,Citation10,Citation11]. Similarly, patients with acute herpes zoster have PHS at the affected site but not at the contralateral site [Citation8,Citation12]. Even though the presence of PHS is rare in healthy individuals, it can be induced when the skin is preheated or sensitized with capsaicin [Citation7,Citation9,Citation13–16]. Identifying the conditions that facilitate the occurrence of PHS may indirectly help us to clarify the underlying physiology, which can help us understand why some patients with nervous system lesions experience PHS.
The mechanism underlying PHS is unknown. One theory suggests that it is linked to dysfunction of cold-specific A-delta fibers, which leads to the unmasking or disinhibition of C-fiber inputs involved in heat and pain sensing [Citation8,Citation17–19]. This theory is previously discussed in the context of the thermal grill illusion [Citation20,Citation21] and states that the specific C-fiber activity is centrally inhibited by myelinated A-fibers involved in cold sensing. However, when A-fibers are inhibited, for example, by warmth, the activity of the C-fibers is disinhibited, resulting in a warm or hot sensation. In line with the theory, some studies on PHS found an association between reduced cold sensitivity and PHS, whereas other studies did not find this association [Citation6,Citation11,Citation22]. The relation between cold sensory loss and PHS is therefore still unclear.
PHS is generally measured using the thermal sensory limen (TSL) procedure of the quantitative sensory testing (QST) protocol from the German Research Network on Neuropathic Pain [Citation2,Citation23]. In the TSL, warming and cooling of the same skin area is alternated every time participants press a button to indicate the perception of a new thermal sensation (). Due to the methodology of the TSL procedure, it is possible for participants to register a change in sensation before the temperature returns to baseline (32°C). In this case, warming and cooling of the skin are both within the same temperature range, and it is not possible to conclude whether a participant experienced a PHS (). Furthermore, the extent to which the skin is warmed or cooled at each trial is determined by the participant’s sensitivity. This implies that the magnitude of the warm-cold difference (i.e. the TSL measure) systematically varies between individuals with normal and impaired thermal sensitivity ( vs. ), which might influence the occurrence of PHS.
Figure 1. Measurements of PHS. The standard and modified thermal sensory limen (TSL and mTSL) protocol. Participants pressed a button every time they registered a new sensation and reported whether it was warm or cold. A PHS was registered if the participant reported a warm sensation during cooling (a, b, c, d, e, and g) and a PCS was registered if the participant reported a cold sensation during warming (a, b, c, f, and h). a-c: The original thermal sensory limen (TSL) with alternating warming and cooling temperatures during three different situations: a: TSL measure from a healthy individual with normal thermal sensitivity. b: All button presses in the warm range, c: TSL measure from an individual with reduced thermal sensitivity. d-h: The modified thermal sensory limen (mTSL). Participants were told to press the button as soon as they felt a change in temperature after the auditory cue. d: mTSL with alternating warming and cooling temperatures similar to the TSL except for an auditory cue indicating when the temperature returned to baseline. e: mTSL with pre-warming and detection of temperature changes in the cold range and possible PHS. f: mTSL with pre-warming and detection of temperature changes in the warm range and possible PCS. g: mTSL with pre-cooling and detection of temperature changes in the cold range and possible PHS. h: mTSL with pre-cooling and detection of temperature changes in the warm range and possible PCS. For simplicity, only pre-warming of 44°C and pre-cooling of 20°C is presented. Blue lines: temperatures <32°C, dots: button presses and reported quality, horizontal line: baseline, Orange lines: temperatures >32°C, and rhombus: auditory cue.
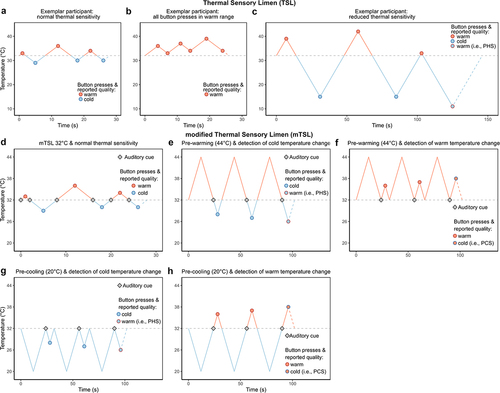
Although rarely described, the TSL protocol can be used to assess paradoxical cold sensations (PCS), i.e. the sensation of cold during warming of the skin, because the procedure also includes measurements of thermal changes in the warm range.
The aim of this study was to systematically investigate the effect of transient pre-warming and pre-cooling on PHS as well as thresholds associated with the detection of new thermal changes in healthy volunteers. Specifically, we assessed whether the occurrence of PHS was influenced by the magnitude of the preceding temperature change. We hypothesized that pre-warming temperatures would increase the number of PHS and the thresholds for detection of a cooling thermal change [Citation14]. We included pre-cooling as a control condition, and we anticipated that pre-cooling temperature would have a minimal effect on the detection of a warming thermal change [Citation24,Citation25]. To our knowledge, no studies have investigated the effect of pre-cooling on PHS responses. Lastly, we hypothesized that larger warm-cold differences would result in a higher number of PHS responses than moderate warm-cold differences.
Materials and methods
Participants
One hundred participants were included in the study. Inclusion criteria were healthy individuals, age ≥18 years. Participants were recruited via web-based participant pool software systems (www.forsøgspersoner.dk and Sona Systems; https://cfin.sona-systems.com), and through advertisements at Aarhus University, Denmark. Based on previous studies, the number of participants was chosen as 50 [Citation13,Citation26]. However, due to a skewed age distribution of the first 50 (mostly younger individuals, but a subset between 30 and 75 years), we made a supplementary protocol for the local ethical committee. After approval, we recruited 50 additional participants to balance the number of individuals across age decades. Exclusion criteria were as follows: inability to speak, read, and understand Danish; chronic pain or acute pain in the previous week lasting more than 4 hours or pain on the day of investigation; pain medication within the previous week; medication within the previous week that could affect assessment; history or symptoms of significant diseases that could impact the outcomes (e.g. diabetes, psychiatric, neurological, or other diseases); pregnancy or lactation; jetlag or sleep deprivation; alcohol or drug abuse; consumption of cannabis within the previous 4 weeks; and consumption of alcohol within the previous 48 hours. The study was conducted at the Danish Pain Research Center, Aarhus University, Denmark, between January 2019 and November 2020 and was conducted according to the Declaration of Helsinki II. Approval was given by the Central Denmark Region Committees on Health Research Ethics (no. 1-10-72-320-18), and the study was registered in the Central Denmark region internal registration to the Danish Data Protection Agency (no. 1.16-02-630-18). Participants gave their written informed consent and received 400 DKK as compensation.
Study design
The study design was cross-sectional and consisted of a single session. Participants’ thermal sensitivity and presence of PHS were tested using standardized QST measures [Citation2,Citation15], as well as a modified thermal sensory limen protocol. All tests were administered by the same investigator (ELS) for all participants and were performed on the dorsum of either foot. The location was chosen to match the body area that typically exhibits altered sensitivity in patients with diabetic polyneuropathy [Citation27]. To account for variations in skin temperature [Citation28,Citation29] and to maintain a constant and equal skin temperature, the feet were warmed with a heating lamp to 32 ± 0.5°C during the tests and the skin temperature was monitored regularly [Citation29]. All tests were performed in a quiet room with the participants sitting in a comfortable chair with their feet resting on a small platform or briefcase. Stimuli were first applied either on the right or the left foot in a randomized and balanced order. To control for potential carry-over effects, the location of the delivered stimuli was alternated between the two feet after each measurement (supplementary Fig. S1). The participants were instructed to look away from the location where the stimuli were applied. In addition, participants were informed that only safe temperatures, with no associated risk of skin damage, would be applied and that the stimulations were aimed at eliciting cold, warm, and painful sensations, respectively. Importantly, the participants were naive with respect to the hypotheses of the study and received no information on the exact temperatures applied on the skin, the order of the stimulation temperatures, or the expected quality of their thermal sensations. During the tests, the participants did not receive any feedback on whether their reported quality matched the actual temperatures.
Quantitative sensory testing
Thermal threshold testing was performed using the QST protocol of the German Research Network on Neuropathic Pain (DFNS) [Citation2,Citation15]. The QST protocol includes standardized equipment and verbal instructions, and our center is certified according to the DFNS standards. Thermal tests were conducted using the Thermal Sensory Analyzer thermode (Medoc, Israel), with a contact area of 3.2 × 3.2 cm2 and cutoff temperatures of 0°C and 50°C. The thresholds were achieved by a continuous increase or decrease in the temperature by 1°C/s and terminated when the participants pressed a button. The thermode returned to a baseline temperature of 32°C before each test. Prior to the beginning of the QST measurements, the participants received detailed instructions on the procedures and completed a brief demonstration of each QST measure. They were demonstrated and tested in the same order: First, detection thresholds for cold (CDT) and warm (WDT); second, the standard version of thermal sensory limen (TSL); last, pain thresholds for cold (CPT) and heat (HPT). Each threshold (CDT, WDT, CPT, HPT) was repeated three consecutive times. The TSL consisted of the alternation of dynamic warming and cooling of the skin (). Participants were instructed to press a button every time they felt a temperature change, and to verbally describe their sensations for six consecutive temperature changes. The number of PHS was defined based on a qualitative report of a warm or burning sensation, during cooling of the skin, and corresponded to a value between 0 and 3. Vice versa, the number of PCS was defined as the report of a cold sensation during warming of the skin (0–3 PCS). The individual threshold was determined by the mean of the three results for each of the WDT, CDT, CPT, and HPT (in °C). The individual TSL was calculated by subtracting the mean of the cold detection threshold from the mean of the warm detection threshold as measured by the TSL test.
Modified thermal sensory limen (mTSL) protocol
The general procedure of the mTSL aimed to measure warm and cold temperature changes after different fixed preceding temperatures (i.e. pre-warming and pre-cooling). Each fixed preceding temperature was followed by a temperature change in either the warm or cold direction that required a response from the participant. In addition to the fixed temperatures, we incorporated a control condition, labeled “mTSL32°C” (), with alternating warm and cold temperature changes identical to the TSL. As in the TSL, each temperature change required a button press (i.e. six responses in total). The only difference was the presence of an auditory cue every time the thermode crossed the baseline temperature (32°C).
The fixed temperatures consisted of pre-cooling from baseline (32°C) to 26°C or 20°C or pre-warming from baseline to 38°C or 44°C, and subsequent return to baseline (). By choosing these temperatures, it was possible to examine thermal changes on the feet after smaller (±6°C from baseline) and larger (±12°C from baseline) temperature differentials without inducing too painful pre-heating stimuli. To indicate to participants when they had to detect a temperature change, an auditory cue (“beep”) was presented after the return to baseline. All auditory cues were thus presented at 32°C and were immediately followed by a slow (1°C/s) temperature increment or decrement, requiring a response from the participant. Participants were instructed to press a stop button as soon as they perceived a temperature change after the auditory cue, and to report verbally whether the temperature change was felt as “warm,” “cold,” or “burning” or if they were in doubt about the quality of their sensation.
The mTSL protocol started with the control condition (mTSL32°C) with alternating temperature and was followed by either fixed temperature conditions (20°C, 26°C, 38°C, and 44°C) in a counterbalanced manner to control for order and time effects (supplementary Fig. S1). Each fixed temperature level was presented a total of six consecutive times, three trials followed by warming to assess the participants’ ability to detect temperature changes in the warm range and PCS, and three trials followed by cooling to assess the participants’ ability to detect temperature changes in the cold range and PHS. From pilot studies, we decided on a serial approach during the mTSL protocol with pre-warming and pre-cooling since alternating the temperatures as well as pre-warming or pre-cooling the skin made it very difficult to register a change in temperature. A PHS was registered if participants described a cooling trial as “warm” or “burning” and a PCS was registered if a warming trial was described as cold.
Finally, we tested whether pre-warming or pre-cooling the skin changed the thermal pain thresholds as well as whether the body location influenced the presence of PHS and PCS in the mTSL. The cold pain threshold was tested after pre-warming of 44°C, whereas the warm pain threshold was tested after pre-cooling of 20°C. The influence of body location on the presence of a paradoxical sensation was tested by assessing the frequency of PHS/PCS and cold/warm detection threshold after one fixed temperature change (20°C or 44°C) on the dorsum of the hand.
To ensure that only thermal thresholds and not possible responses to the auditory cues were included in the analyses, we excluded trials in which the reaction times were less than 250 milliseconds (ms) (corresponding to a change of ±0.25°C) after the auditory cue, as the reaction time between hearing a sound and a button press is between 200 and 280 ms [Citation30–32]. Further, we also excluded trials where a participant was unable to detect any sensation (i.e. no button press) within the tested temperature range (0–50°C) since PHS/PCS could not be determined.
Statistics
Stata for Windows (version 14.2; StataCorp LP, College Station, TX, USA) and R (Free Software Foundation’s GNU Public License) were used for data analysis. Continuous data was visually inspected for an acceptable normal distribution using QQ-plots and histograms and was presented as means ± SD if normally distributed, alternatively medians with interquartile range (IQR). QST data was analyzed in accordance with the DFNS protocol using Z-scores, and those exceeding 95% of the prediction interval of the DFNS reference group were considered as abnormal values (±1.96 standard deviation).
We defined participants as responders or non-responders. A PHS responder was defined as having at least one sensation of warmth/burning during cooling of the skin for each TSL protocol or pre-condition. For example, a participant could be a PHS responder during mTSL32°C and a non-responder (no PHS) in mTSL38°C. A non-responder reported a cold sensation during all three cooling stimuli. We compared the number of PHS responders between mTSL32°C and the different fixed pre-temperatures using the McNemar’s exact test and risk ratios (RR) and 95% confidence intervals (CI) as effect size estimates. To assess differences between thermal thresholds across pre-temperatures and compare to the QST detection thresholds, we used Wilcoxon signed-rank tests using Z-statistic and reported the effect size as median and IQR of the threshold differences. McNemar’s exact test, as well as RR and CI were also used in the comparison of PHS responders between TSL and mTSL32°C. The difference in skin temperature between the TSL and mTSL32°C was tested using a paired t-test. To evaluate a possible difference in age associated with PHS, we used the Mann–Whitney U-test. Any difference in gender associated with PHS was evaluated using Fisher’s exact test, with RR and CI as effect size estimates. P-values < 0.05 were considered statistically significant.
In a secondary exploratory linear regression analysis, PHS responders were defined at the single trial level for each participant. Since every measurement was repeated three times (three trials), each participant classified as a responder in the primary analysis may have a different combination of PHS trials or non-PHS trials. In this analysis, we performed a multilevel mixed-effect model to examine the relationship between threshold values and PHS. By doing so, we aimed at identifying whether there were significant differences in the threshold values associated with reports of PHS (yes, no). As fixed effects, we entered age group (decade), gender, trial number (1, 2, or 3), order of pre-temperature, PHS (yes, no), interaction between PHS and pre-temperatures, interaction between PHS and trial number, interaction between PHS and age group (decade), and interaction between PHS and gender. As random effects, we modeled random intercepts for participants and pre-temperatures within participants. To ensure that the assumption of the normality distribution of the residuals was met, we did not model the absolute threshold values, but the difference from baseline (32°C). Hence, the estimates correspond to positive values that reflect the extent of the temperature change needed to perceive cooling of the skin. Lower values indicate increased sensitivity, while higher values indicate decreased sensitivity. Tests for interactions were performed using the Wald test, and p-values were calculated from chi-squared distributions.
Results
One hundred healthy, adult volunteers participated in the study. Of these, 58 were females. Age range was between 18 and 77 years (median age: 44.5 (IQR: 26.5; 54) years). There were no dropouts.
Skin temperature
The baseline foot temperature was 29.3 ± 2.1°C [Citation33]. After the heating lamp was applied, all mean skin temperatures were in the range of 32 ± 0.5°C. There was a statistically significant difference in skin temperature between the QST and mTSL, difference: 0.26 ± 0.03°C (t = 9.45, p < 0.001). However, given that the absolute difference was a small fraction of a degree, we reasoned that the skin temperature change was too little to explain differences in PHS and thresholds between the QST/TSL and the mTSL measurements.
Thermal detection and pain thresholds
summarizes the participants’ thermal QST thresholds. The QST values were within the normal range [Citation9], except for TSL and HPT. For these measures, 14 and 36 individuals showed higher sensitivity than expected during TSL and HPT, respectively (supplementary Fig. S2).
Table 1. Thermal QST data presented as medians (IQR). CDT: cold detection threshold, CPT: cold pain threshold, HPT: heat pain threshold, TSL: thermal sensory limen, and WDT: warm detection threshold.
Paradoxical heat sensations
Exclusion of mTSL trials
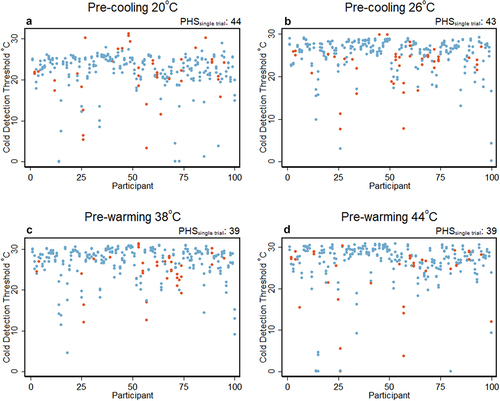
In the mTSL, we excluded 16 trials: 5 trials (4 cooling and 1 warming temperature changes) in which the reaction times were less than 250 ms, and 11 trials (4 cooling and 7 warming temperature changes) in which no button press was registered. More details are provided in Table S1 in the supplementary material. illustrates the distribution of the cold threshold values for each participant after we applied such exclusion. Also from it is seen that there were PHS responses following all pre-temperatures which will be elaborated upon further in the next section.
Figure 2. Trial-level results. The figure depicts single trial threshold values in °C associated with PHS (Orange) and normal values (blue) for each participant separately. Trials in which the response time was less than 250 ms and trials with no button press were excluded from the analysis (details in supplementary Table S1). The subtitle “PHSsingle trial” on top of each graph depicts the number of PHS in total for all trials. a: pre-cooling of 20°C. b: pre-cooling of 26°C. c: pre-warming of 38°C. d: pre-warming of 44°C. Blue: thresholds (°C) rated as cold, and Orange: thresholds (°C) rated as PHS.
Number of paradoxical heat sensation responders
There were 7 (54 (25; 81) %) more PHS responders during the TSL protocol (20 PHS responders) than during the mTSL32°C protocol (13 PHS responders), but the difference was not statistically significant ( = 3.27, p = 0.12, RR = 0.65 (0.41; 1.0)) (). Pre-cooling temperatures of 20°C and 26°C increased the number of PHS responders compared to mTSL32°C () and the differences were statistically significant (20°C:
= 6.0, p = 0.023, RR = 1.9 (1.1; 3.3) and 26°C:
= 6.55, p = 0.017, RR = 1.9 (1.2; 3.2)). Similarly, pre-warming temperatures of 38°C and 44°C increased the number of PHS responders compared to the control condition, although it did not reach statistical significance (38°C:
= 2.13, p = 0.21, RR = 1.5 (0.86; 2.8) and 44°C:
= 3.86, p = 0.078, RR = 1.7 (0.995; 2.9)). We compared the effect of pre-cooling (combined 20°C and 26°C) vs. pre-warming (combined 38°C and 44°C), and we found no differences in the number of PHS responders (cold vs. warm:
= 0.57, p = 0.57, RR = 1.1 (0.83; 1.5)). Finally, we tested whether the temperature differential from baseline influenced the number of PHS responders. We compared the 6°C difference (combined 26°C and 38°C) vs. the 12°C difference (combined 20°C and 44°C), and here, we also found no difference in the number of PHS responders (6°C vs. 12°C,
= 0.57, p = 0.57, RR = 1.1 (0.83; 1.5)).
Figure 3. Results. a: Bar chart with the number of participants with at least one PHS during the different preceding temperatures in the mTSL protocol. For the control sequence (32°C) the temperature was alternating while for temperatures with pre-warming or pre-cooling the temperature change was always in one direction. The number of PHS was larger during pre-temperatures of 20°C and 26°C than during baseline mTSL32°C. * p < 0.025 (McNemar’s exact test), number on top of bars: number of PHS responders, and whiskers: 95% CI. b and c: Boxplot of cold (b) and warm (c) detection thresholds from the mTSL, after different fixed temperatures. Higher cold and warm detection thresholds for all fixed temperatures than CDT and WDT from the QST. * p < 0.001 (Wilcoxon signed-rank test), CDT: cold detection threshold, dots: individual values, hinge: inter quartile range, horizontal line: median, WDT: warm detection threshold, and whiskers: adjacent values. d: Adjusted predictions of the temperature values (difference from baseline, °C) illustrating the interaction between pre-temperatures and PHS. The predicted variable was the temperature values (°C) at which participants detected a temperature change in the cold range. The fixed effects were gender (female), age (44, median of population), trial [Citation1], and sequence [Citation1]. The random effect was participant ID. The CI intervals should be interpreted carefully since data is paired. The circled markers represent the predicted mean of the temperature difference (°C) associated with the detection of temperature changes perceived as cold (i.e. normal sensation). Instead, the triangular markers represent the predicted mean of the temperature difference (°C) associated with the detection of temperature changes perceived as warm (i.e. PHS). The whiskers depict the upper or lower CI – for clarity only the upper or lower CIs are presented. * p = 0.013 (joint test of all the coefficients associated with the interaction of pre-temperature and PHS are equal to 0).
![Figure 3. Results. a: Bar chart with the number of participants with at least one PHS during the different preceding temperatures in the mTSL protocol. For the control sequence (32°C) the temperature was alternating while for temperatures with pre-warming or pre-cooling the temperature change was always in one direction. The number of PHS was larger during pre-temperatures of 20°C and 26°C than during baseline mTSL32°C. * p < 0.025 (McNemar’s exact test), number on top of bars: number of PHS responders, and whiskers: 95% CI. b and c: Boxplot of cold (b) and warm (c) detection thresholds from the mTSL, after different fixed temperatures. Higher cold and warm detection thresholds for all fixed temperatures than CDT and WDT from the QST. * p < 0.001 (Wilcoxon signed-rank test), CDT: cold detection threshold, dots: individual values, hinge: inter quartile range, horizontal line: median, WDT: warm detection threshold, and whiskers: adjacent values. d: Adjusted predictions of the temperature values (difference from baseline, °C) illustrating the interaction between pre-temperatures and PHS. The predicted variable was the temperature values (°C) at which participants detected a temperature change in the cold range. The fixed effects were gender (female), age (44, median of population), trial [Citation1], and sequence [Citation1]. The random effect was participant ID. The CI intervals should be interpreted carefully since data is paired. The circled markers represent the predicted mean of the temperature difference (°C) associated with the detection of temperature changes perceived as cold (i.e. normal sensation). Instead, the triangular markers represent the predicted mean of the temperature difference (°C) associated with the detection of temperature changes perceived as warm (i.e. PHS). The whiskers depict the upper or lower CI – for clarity only the upper or lower CIs are presented. * p = 0.013 (joint test of all the coefficients associated with the interaction of pre-temperature and PHS are equal to 0).](/cms/asset/127632ae-9f45-434a-984b-261bfa0214eb/ktmp_a_2088028_f0003_oc.jpg)
Table 2. The number of PHS responders (one or more PHS out of three cold stimuli) for each TSL protocol and pre-temperature. Pre-temp: pre-temperature, TSL: thermal sensory limen, and mTSL: modified TSL.
Responses before baseline
In the standard TSL (i.e. without the auditory stimulus), two participants pressed the button before the stimulation temperature reached baseline while the skin was cooled (one before all three cooling stimuli, one before the second cooling stimulus). The participants reported the temperature as cold (or more correctly “colder” than the preceding warm temperature) even though the temperature was above 32°C. The measurements were registered as normal (i.e. not as PCS) since the previous stimuli were warm.
Age, gender, and PHS
PHS responders were older than non-responders during both the TSL (median age 53 (IQR: 42; 62) vs. 43 (26; 53) years (U = 2894.5, p < 0.001) and mTSL32°C (55 (51; 65) vs. 43 (26; 52) years (U = 1801, p < 0.001)). Further, more males than females were PHS responders, 13 (31%) vs. 7 (12%), = 5.43, p = 0.019 and RR = 1.8 (1.2; 2.8) in the TSL and 9 (21%) vs. 4 (7%),
= 4.55, p = 0.034 and RR = 1.8 (1.2; 2.9) in the mTSL32°C. There was no difference in age between PHS responders and normal responders during the pre-warming or pre-cooling conditions (UTSL26 = 763, p ≥ 0.16). The gender distribution of PHS responders also did not differ during the pre-warming or pre-cooling conditions,
TSL20 = 1.37, p ≥ 0.24) (details in supplementary Table S3).
Thermal thresholds after pre-warming and pre-cooling
Detection: Both pre-warming and pre-cooling temperatures increased detection thresholds of a cold temperature change compared to the cold detection thresholds during the QST (Zmin = 4.87, all p-values < 0.001, min. median threshold difference: −1.0 (−2.8; 0.35) °C), (see supplementary Table S2 for specific values). Pre-cooling caused higher thresholds than pre-warming and the change was also influenced by the magnitude of the pre-cooling, so that thresholds in the 20°C pre-cooling condition were significantly higher (colder) than the thresholds in the 26°C condition (Z = 8.15, p < 0.001, median threshold difference: −2.7 (−3.8; −1.7) °C). We also found that pre-warming and pre-cooling temperatures increased detection thresholds of a warm temperature change compared to the warm detection thresholds during the QST (Zmin = −8.04, all p-values < 0.001, min. median threshold difference: 2.3 (1.2; 4.1) °C) (). The warm thresholds during the pre-warming conditions were higher than during the two pre-cooling conditions, and the thresholds in the 44°C pre-warming condition were significantly higher than the thresholds in the 38°C condition (Z = −6.62, p < 0.001, median threshold difference: 2.0 (0.4; 3.4)°C).
Pain: We found increased cold pain thresholds (i.e. reduced sensitivity) following pre-warming of 44°C compared to CPT from the QST (CPT = 11.96 (5.03; 22.7)°C, Z = −2.17, p = 0.029, median threshold difference: −1.2 (−6.9; 3.0)°C). Similarly, heat pain thresholds were markedly increased following pre-cooling of 20°C (44.7 (42.9; 46.5)°C, Z = −8.02, p < 0.001, median threshold difference: 2.3 (1.2; 3.6)°C). See supplementary Fig. S3 for details.
Mixed-effect analysis: Modeling the relationship between PHS and mTSL cold thresholds
Our model demonstrated a statistically significant interaction between the different pre-temperatures and PHS using data on every trial separately (p = 0.011) (). After pre-cooling to 20°C, the thresholds of a subsequent temperature change perceived as PHS were estimated to be −1.23°C (0.26; 2.29)°C lower (increased sensitivity) than the thresholds associated with no PHS (p = 0.013). There were no differences between the thresholds associated with PHS or no PHS, after pre-cooling or pre-warming to 26°C or 38°C. After the skin was pre-warmed to 44°C, thresholds perceived as PHS were 0.95 (−0.06; 1.97)°C higher than the thresholds associated with no PHS; however, this effect did not cross the significance threshold (p = 0.06). In general, the thresholds were higher (i.e. decreased sensitivity) for the pre-temperature of 20°C compared to the other three pre-temperatures regardless of the presence of PHS.
Furthermore, trial numbers 2 and 3 exhibited higher thresholds than trial number one. The order of the pre-temperatures had no effect on the thresholds (p = 0.32). We found no interaction between PHS and trial number (p = 0.17), no interaction between PHS and age group (p = 0.28), nor interaction between PHS and sex (p = 0.94). Aging and sex had a significant impact on the thresholds. Increasing age and being male were associated with higher thresholds (i.e. decreased sensitivity). The detailed results from the mixed-effects linear regression model are presented in Table S4 in the supplementary material.
Paradoxical cold sensations
The number of PCS responders was low and with no statistical difference across trials: 3 during the TSL, 5 during mTSL32°C, 3 during mTSL20, 2 during TSL26, 6 during mTSL38, and 11 during mTSL44. We thus found higher frequency of PCS after warmer pre-temperatures, but the difference was not statistically significant compared to mTSL32°C (38°C: = 0.11 p = 1.00, RR = 1.2 (0.41; 3.5) and 44°C:
= 2.25, p = 0.21, RR = 2.2 (0.76; 6.3)). When comparing the effect of pre-warming with the effect of pre-cooling, PCS was increased during the pre-warming condition (cold vs. warm:
= 5.56, p = 0.031, RR = 3.0 (1.1; 7.8)).
Exploratory analyses
Some participants expressed doubts about the quality of the sensations that they were experiencing. In a control analysis, we combined individuals that described at least one cooling as warm or as a sensation that they were unsure whether it was cold or warm (mTSL20°C: 33, mTSL26°C: 28, mTSL38°C: 22 and mTSL44°C: 28 participants). We found similar results irrespective of the definition of PHS (data in supplementary Fig. S4 and Table S5).
Paradoxical sensations and detection thresholds on the hand during pre-warming of 44°C or pre-cooling of 20°C
Finally, we assessed whether the occurrence of PHS was site specific, by testing a short version of mTSL (including only pre-cooling to 20°C or pre-warming to 44°C) on the dorsum of the hands. The results revealed no paradoxical sensations on the dorsum of the hands after pre-cooling or pre-warming the skin, but both pre-temperatures increased the thresholds needed to detect new temperature changes, in line with the results obtained when the mTSL was performed on the feet. See supplementary S2.4 for details.
Discussion
We investigated the occurrence of paradoxical heat sensations (PHS) as well as the ability to detect temperature changes in healthy individuals after transient pre-cooling and pre-warming of the skin using the standard and a modified version of the Thermal Sensory Limen (mTSL). Contrary to our hypothesis, we found a statistically significant increase in the number of PHS responders when the skin was pre-cooled, while the increment was not significant after the skin was pre-warmed, compared to a control condition. To our knowledge, this is the first study reporting an increase in PHS after pre-cooling of the skin in healthy individuals. Also, contrary to our hypothesis, we did not observe an increase in the frequency of PHS responders during the most intense compared to moderate pre-warming or pre-cooling (i.e. 12°C vs. 6°C from baseline).
Our secondary hypothesis that pre-warming of the skin would decrease the sensation of cold was confirmed. Pre-warming increased the cold detection thresholds as well as the warm detection thresholds. We also found that pre-cooling increased both the warm and cold detection thresholds, in a similar way as pre-warming. Interestingly, this increment in thresholds was enhanced when two successive temperature changes were of the same temperature direction (i.e. pre-warming followed by a new warm stimulus or pre-cooling followed by a new cold stimulus). These results are consistent with a previous study that showed increased cold detection thresholds during mild cooling of the skin (to 27°C) [Citation29], but no effect on warm thresholds as well as no effect on detection threshold after warming the skin (up to 37°C) [Citation29]. Similarly, a recent study demonstrated decreased thermal intensities after tonic warm and cold stimulation [Citation34].
The increased thermal thresholds during the TSL can be explained by different factors, such as habituation, sensory adaptation, or synaptic fatigue. Habituation is a type of non-associative learning that refers to reduced behavioral responses after repeated stimulation [Citation35]. Studies have shown that the habituation is observed when investigating thermal pain threshold [Citation36,Citation37] but did not (or in a very limited manner) impact thermal detection thresholds [Citation37]. In this study, we focused on thermal detection rather than thermal pain and, therefore, a possible influence of habituation seems negligible. One alternative possibility is that the reduced thermal detection thresholds are related to sensory adaptation since the detection of a subsequent thermal stimulus depends on the adapting skin temperature [Citation38,Citation39]. A recent study demonstrated that cold sensations are relative to the baseline skin temperature [Citation40]. Here, the baseline temperature of the skin was set to 40°C for 5 seconds, which led to cold detection thresholds at around 35°C [Citation40]. An adaptation effect may partly explain the increased thermal thresholds in the present study, although we only transiently cooled or warmed the skin and afterward returned the temperature of the thermode to 32°C before a new stimulus was initiated.
Furthermore, studies have shown reduced nerve conduction and thereby larger thermal thresholds [Citation41,Citation42] when thoroughly cooling the skin. Since we only transiently cool or warm the skin (duration of maximum cold/warm was 12 s), it seems unlikely that nerve conduction velocity is changed due to either cooling or warming the skin. Finally, one further mechanism can be synaptic fatigue, which refers to the temporary inability of peripheral neurons to respond to specific sensory inputs, due to short term synaptic plasticity [Citation34,Citation43].
Consistently with the disinhibition theory, the increased cold thresholds following pre-warming and pre-cooling could be due to reduced activity in cold sensing primary afferents, which could lead to disinhibition of warm responding second-order neurons resulting in PHS [Citation20]. Meanwhile, the theory is at odds with the findings from the mixed-effect analysis. Here, pre-cooling of 20°C was associated with less increased cold thresholds (lower thresholds, but still increased compared to the baseline condition) for PHS than for no PHS, which is in contradiction with the theory. Additionally, cold pain thresholds were increased after pre-warming, and heat pain thresholds were increased after pre-cooling, which suggest that the occurrence of PHS cannot simply be explained by a shift of the cold pain threshold toward baseline.
The absence of PHS on the dorsum of the hand during cooling of the skin after pre-warming of 44°C or pre-cooling of 20°C could be explained by the participants’ remaining ability to sense a change in temperature despite the pre-conditioning. Furthermore, both during pre-warming and pre-cooling the dorsum of the hand, we observed an increase in detection thresholds in line with the findings on the feet. This also underlines, that it is unclear whether PHS/PCS is due to increased thresholds or larger preceding temperatures. Our results indicate that the mechanisms underlying PHS are more complex than previously described and that PHS is not related uniquely to cold sensory loss [Citation17,Citation18].
Additionally, we found no association between PHS and age during the pre-warming and pre-cooling, opposed to the TSL and mTSL32° where the frequency of PHS was higher in older individuals. The lack of this age effect indicates that the number of PHS responders after pre-conditioning was increased in younger participants. This could be due to a relatively larger increase in threshold for younger individuals, if the increment of PHS responses is generated by the decreased thresholds. Our model also showed an increase in threshold during trials 2 and 3 compared to the first trial, which indicates a habituation effect during repeated cooling.
Focusing on the opposite phenomena, i.e. paradoxical cold sensations (PCS), we found larger PCS frequencies during the warm pre-temperatures than the pre-cold temperatures. These results indicate that PCS can be induced using pre-warming, but adequately powered studies are needed to assess this hypothesis.
Neural coding of warmth and cold and implication on PHS
Even though advancements in neuroimaging technology have contributed greatly to the mapping of human sensory and pain related neural activity [Citation44–47], detailed studies of peripheral and central neuronal coding mechanisms of warm and cold in humans are scarce [Citation48]. In an electrophysiological study on cold sensitive nerve fiber activity in humans, cooling and rewarming the superficial radial nerve by 1°C/s led to a rapid increase in frequency when cooling, then to a steady firing frequency, whereas rewarming stopped the discharge and the frequency was gradually increased until reaching baseline activity [Citation49]. This could be an explanation for the observed increase in cold thresholds after pre-cooling. Since the mentioned study did not measure the activity when cooling after rewarming, we can only hypothesize this relationship. Additionally, previous microneurographic studies of peripheral, cutaneous nerve fibers demonstrated different subtypes of C-fibers responsive to both cooling and warming [Citation17,Citation50] and suggested that altered activity in these fibers may facilitate the generation of PHS. These electrophysiological findings highlight the dynamic and adaptive activity of thermosensitive neurons and also that innocuous cold is conducted both by Aδ and C-fibers [Citation13].
Recent animal studies have demonstrated the existence of different coding mechanisms for warm and cold neural activity [Citation51–53]. They found that warm sensory afferents responded in a graded fashion with stimulation intensity (i.e. higher temperature induced higher firing rate and recruitment of more neurons) [Citation51,Citation52]. In contrast, cold sensory neurons responded in a combinatorial manner, with different patterns of cold responding neurons interacting differently depending on the cold temperature [Citation52]. Furthermore, these studies revealed that about half of the neurons were polymodal, as they responded to both temperature qualities and mechanical stimulation [Citation51,Citation53]. Molecular studies inactivating the cold and menthol-sensitive transient receptor potential (TRP) channel M8 (TRPM8) in mice (knockout or ablation) found increased or unaltered firing rates of warm sensing neurons [Citation51,Citation52] and paradoxically that TRPM8 receptors were required for the perception of warm [Citation51].
Taken together, these findings indicate close interactions between cold and warm sensing pathways. The evidence in animal models of different thermal coding mechanisms underlying warm and cold sensing offer interesting hypothesis that should be tested in humans and may explain the observed higher occurrence of paradoxical heat vs. cold sensations in humans. These different coding strategies are compatible with a population coding framework, postulating that temperature perception depends on the integration of neural activity across fibers or pathways that were previously thought to operate independently (for review see [Citation54]).
Limitations
This study should be interpreted within the context of certain limitations. Previously, PHS showed low test–retest reliability [Citation55,Citation56]. It is unknown what the test–retest reliability of the mTSL is compared to the TSL. To mitigate possible temporal effects, we performed the testing of all mTSL trials within the same day and the order of the pre-temperatures was fully counterbalanced across participants. In the mixed effect modeling, we entered the pre-temperature order for each individual as a fixed effect. The results indicated a lack of a significant effect of the pre-temperatures order on the threshold values.
For diagnostic purposes, having one out of three PHSs in individuals over 40 years of age is considered normal [Citation15]. In this study, we decided to define all participants with one or more PHS, regardless of the age of the individuals as PHS responders, since we were investigating how warming and cooling the skin influenced the number of PHS responses and not whether PHS was a pathological sign. Therefore, the number of PHS responders was higher in our sample than in a normal healthy population. It should be noticed that the TSL values from the QST were in the normal range compared to the reference data [Citation15].
The lack of a statistically significant increase in PHS response after pre-warming could be due to lower pre-temperatures as compared to prior studies. Susser et al. and Hämäläinen et al. both used individually calibrated pre-warming temperatures in the heat pain range (all pre-warming values were above 47°C [Citation7,Citation13]). Since the pre-temperature of 44°C was above the median (and near the upper quartile) of the heat pain threshold measured by the QST, one should expect it to be sufficient in terms of replicating prior findings [Citation7,Citation13].
The sequences of the temperatures differed between the mTSL32°C and the mTSL protocols with pre-warming and pre-cooling, where the temperature was always in the cold or warm direction and not alternating. This difference may introduce smaller difference in the number of PHS between PHS mTSL32°C compared to the other mTSL protocols.
Both QST thermal detection thresholds and mTSL thresholds were measured using a similar test sequence (i.e. temperature increments and decrements were applied three times in a row and not alternating as in the TSL). However, during the QST measurements, the participants were informed about the expected quality of the temperature, and no auditory cue was presented. This confound could possibly influence the thresholds, but since the key part of the test (i.e. the sequence of the temperatures) was similar, the confound may be negligible. Moreover, because we compared thermal thresholds between both feet, it should be considered whether the sensitivity between the feet is the same. Rolke et al. found no significant left–right differences in the QST parameters in 180 healthy volunteers [Citation15] and we therefore insinuated that a possible difference was minimal. Furthermore, the order of the stimuli on each foot was counterbalanced across participants.
Conclusion
In conclusion, we found a higher number of PHS responders after the skin was transiently pre-cooled (ca. 19% increment) immediately before the PHS assessment and a non-significant increment when the skin was transiently pre-warmed. Pre-warming and pre-cooling increased thermal detection thresholds, and we discussed this finding in relation to habituation, sensory adaptation, and synaptic fatigue. We did not find a clear-cut association between PHS responses and reduced cold sensitivity (i.e. higher thresholds), indicating that the increased thresholds following pre-warming and pre-cooling were not sufficient to fully explain PHS.
Our results warrant future investigation on the potentially distinct coding mechanisms underpinning warm and cold sensing in humans and to understand why some individuals with intact thermal function experience paradoxical heat sensations, and why this phenomenon is common in certain neurological diseases.
Author contributions
ELS, NBF, and FF designed the experiment. ELS acquired the data. ELS, NTA, and FF analyzed the data. ELS, NTA, NBF, and FF wrote the paper.
Abbreviations
Supplemental Material
Download Zip (369.1 KB)Acknowledgments
The authors thank Micah Allen, Camila Sardeto Deolindo, Alexandra Grace Mitchell, and Niia Nikolova for their comments on a previous version of the manuscript.
Disclosure statement
No potential conflict of interest was reported by the author(s).
Supplementary material
Supplemental data for this article can be accessed online at https://doi.org/10.1080/23328940.2022.2088028
Additional information
Funding
References
- Osterberg A, Boivie J. Central pain in multiple sclerosis - sensory abnormalities. Eur J Pain. 2010;14(1):104–110. Epub 2009/04/11. PubMed PMID: 19359204
- Maier C, Baron R, Tolle TR, et al. Quantitative sensory testing in the German research network on neuropathic pain (DFNS): somatosensory abnormalities in 1236 patients with different neuropathic pain syndromes. Pain. 2010;150(3):439–450.
- Backonja MM, Attal N, Baron R, et al. Value of quantitative sensory testing in neurological and pain disorders: neuPSIG consensus. Pain. 2013;154(9):1807–1819. Epub 2013/06/08. PubMed PMID: 23742795
- Terkelsen AJ, Karlsson P, Lauria G, et al. The diagnostic challenge of small fibre neuropathy: clinical presentations, evaluations, and causes. Lancet Neurol. 2017;16(11):934–944. Epub 2017/10/17. PubMed PMID: 29029847
- Hansen C, Hopf HC, Treede RD. Paradoxical heat sensation in patients with multiple sclerosis. Evidence for a supraspinal integration of temperature sensation. Brain. 1996;119(5):1729–1736.
- Baron R, Maier C, Attal N, et al. Peripheral neuropathic pain: a mechanism-related organizing principle based on sensory profiles. Pain. 2017;158(2):261–272. Epub 2016/11/29. PubMed PMID: 27893485; PubMed Central PMCID: PMCPMC5266425 the end of this article
- Hamalainen H, Vartiainen M, Karvanen L, et al. Paradoxical heat sensations during moderate cooling of the skin. Brain Res. 1982;251(1):77–81.
- Yosipovitch G, Yarnitsky D, Mermelstein V, et al. Paradoxical heat sensation in uremic polyneuropathy. Muscle Nerve. 1995;18(7):768–771.
- Magerl W, Krumova EK, Baron R, et al. Reference data for quantitative sensory testing (QST): refined stratification for age and a novel method for statistical comparison of group data. Pain. 2010;151(3):598–605. Epub 2010/10/23. PubMed PMID: 20965658
- Escolano-Lozano F, Barreiros AP, Birklein F, et al. Transthyretin familial amyloid polyneuropathy (TTR-FAP): parameters for early diagnosis. Brain Behav. 2018;8(1):e00889. Epub 2018/03/24. PubMed PMID: 29568686; PubMed Central PMCID: PMCPMC5853640
- Ventzel L, Madsen CS, Karlsson P, et al. Chronic pain and neuropathy following adjuvant chemotherapy. Pain Med. 2017. doi:10.1093/pm/pnx231.
- Kramer S, Baeumler P, Geber C, et al. Somatosensory profiles in acute herpes zoster and predictors of postherpetic neuralgia. Pain. 2019;160(4):882–894. Epub 2018/12/27. PubMed PMID: 30585985
- Susser E, Sprecher E, Yarnitsky D. Paradoxical heat sensation in healthy subjects: peripherally conducted by A delta or C fibres? Brain. 1999;122(2):239–246. Epub 1999/03/10. PubMed PMID: 10071052
- Schaldemose EL, Horjales-Araujo E, Svensson P, et al. Altered thermal grill response and paradoxical heat sensations after topical capsaicin application. Pain. 2015;156(6):1101–1111.
- Rolke R, Baron R, Maier C, et al. Quantitative sensory testing in the German research network on neuropathic pain (DFNS): standardized protocol and reference values. Pain. 2006;123(3):231–243.
- Jenkins WL, Karr AC. Paradoxical warmth: a sufficient condition for its arousal. Am J Psychol. 1957;70(4):640–641. Epub 1957/12/01. PubMed PMID: 13487840.
- Campero M, Baumann TK, Bostock H, et al. Human cutaneous C fibres activated by cooling, heating and menthol. J Physiol. 2009;587(23):5633–5652.
- Fruhstorfer H. Thermal sensibility changes during ischemic nerve block. Pain. 1984;20(4):355–361. Epub 1984/12/01. PubMed PMID: 6522070
- Prescott SA, Ma Q, De Koninck Y. Normal and abnormal coding of somatosensory stimuli causing pain. Nat Neurosci. 2014;17(2):183–191. Epub 2014/01/30. PubMed PMID: 24473266; PubMed Central PMCID: PMCPMC4079041
- Craig AD, Bushnell MC. The thermal grill illusion: unmasking the burn of cold pain. Science (New York, NY). 1994;265(5169):252–255.
- Craig AD. The functional anatomy of lamina I and its role in post-stroke central pain. Prog Brain Res. 2000;129:137–151. Epub 2000/12/01. PubMed PMID: 11098686
- Blankenburg M, Kraemer N, Hirschfeld G, et al. Childhood diabetic neuropathy: functional impairment and non-invasive screening assessment. Diabet Med. 2012;29(11):1425–1432. Epub 2012/04/18. PubMed PMID: 22507184
- Rolke R, Magerl W, Campbell KA, et al. Quantitative sensory testing: a comprehensive protocol for clinical trials. Eur J Pain. 2006;10(1):77–88.
- Binder A, Stengel M, Klebe O, et al. Topical high-concentration (40%) menthol-somatosensory profile of a human surrogate pain model. J Pain. 2011;12(7):764–773. Epub 2011/04/05. PubMed PMID: 21459681
- Namer B, Kleggetveit IP, Handwerker H, et al. Role of TRPM8 and TRPA1 for cold allodynia in patients with cold injury. Pain. 2008;139(1):63–72. Epub 2008/04/29. PubMed PMID: 18440147
- Bouhassira D, Kern D, Rouaud J, et al. Investigation of the paradoxical painful sensation (‘illusion of pain’) produced by a thermal grill. Pain. 2005;114(1–2):160–167.
- Gylfadottir SS, Weeracharoenkul D, Andersen ST, et al. Painful and non-painful diabetic polyneuropathy: clinical characteristics and diagnostic issues. J Diabetes Investig. 2019;10(5):1148–1157. Epub 2019/06/22. PubMed PMID: 31222961; PubMed Central PMCID: PMCPMC6717899
- Romanovsky AA. Skin temperature: its role in thermoregulation. Acta Physiol (Oxf). 2014;210(3):498–507. Epub 2014/04/10. PubMed PMID: 24716231; PubMed Central PMCID: PMCPMC4159593
- Hagander LG, Midani HA, Kuskowski MA, et al. Quantitative sensory testing: effect of site and skin temperature on thermal thresholds. Clin Neurophysiol. 2000;111(1):17–22. Epub 2000/02/03. PubMed PMID: 10656506
- Kohfeld DL. Simple reaction time as a function of stimulus intensity in decibels of light and sound. J Exp Psychol. 1971;88(2):251–257. Epub 1971/05/01. PubMed PMID: 5577177
- Callsen MG, Moller AT, Sorensen K, et al. Cold hyposensitivity after topical application of capsaicin in humans. Exp Brain Res. 2008;191(4):447–452.
- Gormsen L, Ribe AR, Raun P, et al. Pain thresholds during and after treatment of severe depression with electroconvulsive therapy. Eur J Pain. 2004;8(5):487–493. Epub 2004/08/25. PubMed PMID: 15324780
- Nardin RA, Fogerson PM, Nie R, et al. Foot temperature in healthy individuals: effects of ambient temperature and age. J Am Podiatr Med Assoc. 2010;100(4):258–264. Epub 2010/07/28. PubMed PMID: 20660876.
- Mulders D, de Bodt C, Lejeune N, et al. Dynamics of the perception and EEG signals triggered by tonic warm and cool stimulation. PLoS One. 2020;15(4):e0231698. Epub 2020/04/24. PubMed PMID: 32324752; PubMed Central PMCID: PMCPMC7179871
- Rankin CH, Abrams T, Barry RJ, et al. Habituation revisited: an updated and revised description of the behavioral characteristics of habituation. Neurobiol Learn Mem. 2009;92(2):135–138. Epub 2008/10/16. PubMed PMID: 18854219; PubMed Central PMCID: PMCPMC2754195
- Jepma M, Jones M, Wager TD. The dynamics of pain: evidence for simultaneous site-specific habituation and site-nonspecific sensitization in thermal pain. J Pain. 2014;15(7):734–746. Epub 2014/04/29. PubMed PMID: 24768695; PubMed Central PMCID: PMCPMC4083082
- Agostinho CM, Scherens A, Richter H, et al. Habituation and short-term repeatability of thermal testing in healthy human subjects and patients with chronic non-neuropathic pain. Eur J Pain. 2009;13(8):779–785. Epub 2008/11/21. PubMed PMID: 19019713
- Handwerker HO, Keck FS, Neermann G. Detection of temperature increases in the operating range of warm receptors and of nociceptors. Pain. 1982;14(1):11–20. Epub 1982/09/01. PubMed PMID: 7145436
- Green BG, Akirav C. Threshold and rate sensitivity of low-threshold thermal nociception. Eur J Neurosci. 2010;31(9):1637–1645. Epub 2010/06/09. PubMed PMID: 20525076; PubMed Central PMCID: PMCPMC2882706
- Lithfous S, Trocmet L, Pebayle T, et al. Investigating cold Aδ fibers in the 0-40 °C temperature range: a quantitative sensory testing and evoked potentials study. Clin Neurophysiol. 2022;134:81–87. Epub 2022/01/07. PubMed PMID: 34991016
- Lowitzsch K, Hopf HC, Galland J. Changes of sensory conduction velocity and refractory periods with decreasing tissue temperature in man. J Neurol. 1977;216(3):181–188. Epub 1977/10/07. PubMed PMID: 72136
- Rutkove SB. Effects of temperature on neuromuscular electrophysiology. Muscle Nerve. 2001;24(7):867–882. Epub 2001/06/19. PubMed PMID: 11410914
- Greffrath W, Baumgärtner U, Treede RD. Peripheral and central components of habituation of heat pain perception and evoked potentials in humans. Pain. 2007;132(3):301–311. Epub 2007/05/30. PubMed PMID: 17533117
- Cahill CM, Stroman PW. Mapping of neural activity produced by thermal pain in the healthy human spinal cord and brain stem: a functional magnetic resonance imaging study. Magn Reson Imaging. 2011;29(3):342–352. Epub 2011/01/21. PubMed PMID: 21247717
- Seifert F, Maihöfner C. Central mechanisms of experimental and chronic neuropathic pain: findings from functional imaging studies. Cell Mol Life Sci. 2009;66(3):375–390. Epub 2008/09/16. PubMed PMID: 18791842
- Weber KA 2nd, Chen Y, Wang X, et al. Functional magnetic resonance imaging of the cervical spinal cord during thermal stimulation across consecutive runs. Neuroimage. 2016;143:267–279. Epub 2016/09/13. PubMed PMID: 27616641; PubMed Central PMCID: PMCPMC5124507
- Rempe T, Wolff S, Riedel C, et al. Spinal and supraspinal processing of thermal stimuli: an fMRI study. J Magn Reson Imaging. 2015;41(4):1046–1055. Epub 2014/04/17. PubMed PMID: 24737401
- Devigili G, De Filippo M, Ciana G, et al. Chronic pain in Gaucher disease: skeletal or neuropathic origin? Orphanet J Rare Dis. 2017;12(1):148. Epub 2017/09/02. PubMed PMID: 28859662; PubMed Central PMCID: PMCPMC5580212
- Hensel H, Boman KK. Afferent impulses in cutaneous sensory nerves in human subjects. J Neurophysiol. 1960;23:564–578. Epub 1960/09/01. PubMed PMID: 13713454
- Campero M, Bostock H. Unmyelinated afferents in human skin and their responsiveness to low temperature. Neurosci Lett. 2010;470(3):188–192. Epub 2009/07/07. PubMed PMID: 19576956
- Paricio-Montesinos R, Schwaller F, Udhayachandran A, et al. The sensory coding of warm perception. Neuron. 2020;106(5):830–41.e3. Epub 2020/03/26. PubMed PMID: 32208171; PubMed Central PMCID: PMCPMC7272120
- Ran C, Hoon MA, Chen X. The coding of cutaneous temperature in the spinal cord. Nat Neurosci. 2016;19(9):1201–1209. Epub 2016/07/28. PubMed PMID: 27455110; PubMed Central PMCID: PMCPMC5599125
- Wang F, Bélanger E, Côté SL, et al. Sensory afferents use different coding strategies for heat and cold. Cell Rep. 2018;23(7):2001–2013. Epub 2018/05/17. PubMed PMID: 29768200
- Fardo F, Beck B, Allen M, et al. Beyond labeled lines: a population coding account of the thermal grill illusion. Neurosci Biobehav Rev. 2020;108:472–479. Epub 2019/11/30. PubMed PMID: 31783059
- Palmer ST, Martin DJ. Thermal perception thresholds recorded using method of limits change over brief time intervals. Somatosens Mot Res. 2005;22(4):327–334. Epub 2006/03/01. PubMed PMID: 16503585
- Geber C, Klein T, Azad S, et al. Test-retest and interobserver reliability of quantitative sensory testing according to the protocol of the German research network on neuropathic pain (DFNS): a multi-centre study. Pain. 2011;152(3):548–556. Epub 2011/01/18. PubMed PMID: 21237569