
 ?Mathematical formulae have been encoded as MathML and are displayed in this HTML version using MathJax in order to improve their display. Uncheck the box to turn MathJax off. This feature requires Javascript. Click on a formula to zoom.
ABSTRACT
The fingers have a large surface area to volume ratio (SA:V), minimal muscle mass, and potent vasoconstrictor capacity. These qualities make the fingers prone to heat loss and freezing injuries during whole-body or local cold exposure. Anthropologists have proposed that the large inter-individual variability in human finger anthropometrics may be an ecogeographic evolutionary adaptation, where shorter and thicker digits (i.e. smaller SA:V ratio) provide a favorable adaptation for cold climate natives. We hypothesized that the SA:V ratio of a digit has an inverse relationship with finger blood flux and finger temperature (Tfinger) during cooling and rewarming from cold. Fifteen healthy adults with no or limited cold experiment experience performed 10 min of baseline immersion in warm water (35.0 ± 0.1°C), 30 min in cold water (8.4 ± 0.2°C), and a final 10 min of rewarming in ambient air (~22°C, ~40% relative humidity). Tfinger and finger blood flux were measured continuously across multiple digits per participant. Average Tfinger (p = 0.05; R2 = 0.06) and area under the curve for Tfinger (p = 0.05; R2 = 0.07) during hand cooling showed significant, negative correlations to digit SA:V ratio. There was no relationship between digit SA:V ratio and blood flux (i.e. average blood flux and AUC) during cooling as well as between SA:V ratio and digit temperature (i.e. average Tfinger and AUC) or blood flux (i.e. average blood flux and AUC) during rewarming. Overall, digit anthropometrics do not appear to play a dominant role in extremity cold response.
Introduction
The fingers are especially vulnerable to heat loss due to their very large surface area to volume (SA:V) ratio, minimal muscle mass for metabolic heat generation, and potent vasoconstrictor capacity [Citation1,Citation2]. This can lead to high risks for cold injuries, such as frostbite, during whole-body or local cold exposure [Citation3,Citation4]. Furthermore, there is a generally direct relationship between finger temperature (Tfinger) and manual dexterity [Citation5], and even brief hand immersion in 10°C water decreased gross manual dexterity after 2 minutes and fine finger dexterity after 5 minutes [Citation6]. Manual function is critical for cold weather operations and survival situations, and this has generated interest into whether the thermal responses of the extremities to cooling is a predictable phenomenon along with the role of individual characteristics [Citation2,Citation7,Citation8]. Daanen and van der Struijs [Citation9] reported that, among military personnel deployed to Arctic exercises, greater cold injury prevalence occurred in those with lower pre-deployment cold-induced vasodilatory responses. Other epidemiological studies suggest that cold injuries are more prevalent in tropical and Caribbean natives [Citation10] and less likely in temperate and northern climate natives [Citation11], suggesting a genetic contribution to thermal responses of the extremities [Citation12,Citation13].
Biophysical properties also play a major role in heat exchange and potential cold injury risk, with a larger SA:V ratio – from a combination of longer and/or narrower digits – enabling greater heat loss to the environment [Citation14]. Interestingly, anthropologists have proposed that the large inter-individual variability in human hand anthropometrics may be an ecogeographic evolutionary adaptation [Citation15,Citation16], where thicker and shorter digits provide a favorable thermal adaptation for cold climate or polar natives. A recent series of studies testing rewarming responses following a brief (3 minute) cold hand immersion (0°C water) proposed an evolutionary tradeoff between finger/hand size, heat loss, and manual dexterity. Specifically, across >100 Caucasians, longer fingers and narrower fingers, while beneficial for manual dexterity, were correlated with slower rewarming and potentially greater cold injury risk. In contrast, shorter and broader fingers correlated with faster rewarming and potentially lower cold injury risk, though at the expense of decreased manual dexterity [Citation8].
The purpose of this study was to further examine the role of finger anthropometrics on thermal responses during cold exposure and subsequent rewarming. We built on research from Payne et al. [Citation2,Citation7,Citation8] by using continuous measurements of both finger temperature and microvascular red blood cell flux during both local hand cold exposure and rewarming. We hypothesized that the SA:V ratio of a digit has an inverse relationship with blood flux and temperature during both cooling and rewarming from cold, with longer/narrower digits cooling to a greater extent and also rewarming less rapidly than shorter/wider digits.
Materials and methods
The experimental protocol conformed to the standards set by the Declaration of Helsinki and was approved by the Biosciences Research Ethics Board at Brock University (#18-143). The data were partially taken from a larger study on the effect of exogenous nitrate supplementation on finger blood flow in males [Citation17], with female participants subsequently recruited to increase the sample size of the present study. The research questions are independent, and no direct overlap exists in the data presented between the two studies.
Volunteers were 15 healthy adults (n = 5 females) (age: 24 ± 1 year; height: 175 ± 3 cm; body mass: 74 ± 3 kg) that had no prior or limited previous experience with cold exposure experiments (none within the previous 1 year). Participants were screened for any cardiovascular or other conditions that may affect extremity blood flow (e.g. Raynaud’s phenomenon, hypertension, diabetes, smoking). Female participants were not using oral contraceptives, self-reported a normal menstrual cycle, and completed the experimental trial in the early follicular phase of the menstrual cycle (within the first 5 days following menses) to minimize the impact of female sex hormones on the blood flow and subsequent temperature responses [Citation18]. The experimental procedures were explained verbally, and written informed consent was obtained from all participants. Participants were familiarized with all data collection procedures and instruments, then anthropometric measurements of the body (height, weight) as well as the digits on the left hand (digit length and circumference) were obtained. The surface area (SA) and volume of each digit was calculated based on the assumption that the digits are cylindrical:
On the experimental day, participants were asked to consume 600 mL of water in the hour prior to visiting the laboratory to ensure adequate hydration. Additionally, participants were asked to avoid caffeine and strenuous exercise for 24 h before participating in the experiment. Participants arrived at the laboratory (~22°C, ~40% relative humidity) between 0900 and 1300 h, dressed in shorts and a t-shirt. Upon arrival, hydration status was assessed using urine-specific gravity (USG), where a value ≤1.020 was deemed sufficiently hydrated. The left hand of the participant was then instrumented to monitor finger temperature and skin blood flow responses during baseline, cold exposure, and subsequent rewarming (). Laser-Doppler fluxmetry (LDF) was used as an index of finger cutaneous blood flux (PeriFlux 5010 laser-Doppler perfusion monitor, PeriMed, Sweden); LDF provides an accurate index of skin blood flow and is not influenced by underlying skeletal muscle blood flow [Citation19]. An integrated LDF probe (Probe 457, PeriMed, Sweden) was used to measure both LDF and finger temperature (Tfinger) (PeriFlux 5020 Temperature Unit, PeriMed, Sweden) on the distal phalanx (i.e. finger pad) of the middle and ring fingers (digits 3 and 4). Tfinger was also recorded using thermistors placed on the distal phalanx of digits 2 and 5 and were held in place using tape (Transpore™, 3 M, USA). Thus, we aimed to obtain 60 and 30 sites for Tfinger and blood flux analysis, respectively. Our initial power calculation was based on the assumption that the SA:V ratio would play a significant role in the temperature responses to digit cooling and subsequent rewarming. Based on α = 0.05, β = 0.20, and R2 = 0.35, we would require measurements from 62 digits.
Figure 1. Representative trace of finger temperature (Tfinger) data throughout the experimental protocol along with time windows for cooling and rewarming analysis.
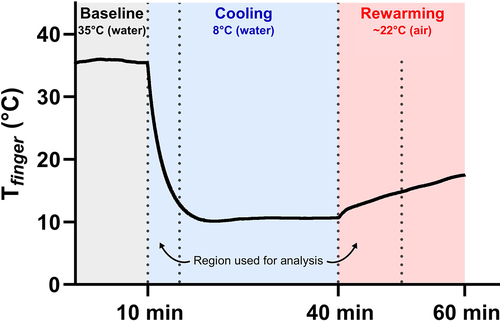
Participants rested in a semi-reclining chair for the duration of the experiment. The remainder of the experiment was conducted in a quiet and dimly lit room to avoid stimulating the autonomic nervous system, as these sensory inputs can influence the skin blood flow response [Citation20]. A custom-built water bath was used for the hand temperature manipulations. The water bath featured a 10 cm rubber gasket on one side to enable the participant to comfortably place their arm into the apparatus. The participant’s left hand was covered with a thin plastic bag attached to the outside of the gasket and water bath, creating an envelope for the hand to be submerged while remaining dry. Care was taken to remove all the air from the bag and to free the laser-Doppler probes and thermocouple sites from any plastic bag folds. As per our previous cold water immersion experiments, the hand was immersed in the water bath up to the ulnar and radial styloid processes (i.e. the wrist) and participants were instructed to keep the hand as still as possible for the duration of the experiment [Citation21]. A small circulating pump was placed in the water bath to ensure pockets of warm water did not form a microclimate around the hand. Importantly, as per our previous experiments, the current created by the pump was weak enough that it did not disturb the laser-Doppler fluxmetry (LDF) measurements. Additionally, a thermocouple was placed in the water bath to continuously record the temperature of the water (Twater). The experimental protocol consisted of 10 min of baseline in warm water (35.0 ± 0.1°C), followed by 30 min in cold water (8.4 ± 0.2°C), and a final 10 min of rewarming in ambient air (~22°C, ~40% relative humidity) (). Baseline water temperature was selected to match mean skin temperature to remove vasoconstrictor and vasodilator inputs [Citation22], and the water temperature during prolonged cold water immersion was selected to provide a strong thermal stimulus without eliciting a strong pain response [Citation23].
All thermal data was collected using LabChart 8.1.13 (ADInstruments, USA) and was stored for offline analysis; LDF data were collected at 40 Hz and thermocouple data at 1 Hz. LDF data were collected in perfusion units (PU) and temperature data in degrees Celsius (°C). As the focus for this study was purely on cooling and rewarming dynamics, Tfinger and LDF responses were analyzed only during the first 5 minutes of cooling to avoid the contribution of a cold-induced vasodilation event to the thermal response [Citation1]. All data files were visually inspected to ensure that no cold-induced vasodilation events were included in the analysis. though average values over cooling were also reported due to its relevance when discussing rewarming data. Moreover, Tfinger and LDF responses were analyzed during the first 10 minutes of rewarming, as this is where the plateau in the rewarming response was achieved [Citation24]. Average Tfinger (°C) and LDF (PU) were determined as the mean thermal response. The area under the curve (AUC) was calculated as the integral for Tfinger (°C·s) and LDF (PU·s) from the onset of the thermal stimulus to the end of the timepoint of interest. The data was manually scanned for any aberrant, non-physiological data points to ensure validity of the calculations. To provide practically meaningful results, data are pooled from all measured digits for each thermal variable (i.e. digits 2–5 for temperature and digits 3 and 4 for blood flux) and all anthropometric data are presented as a single integrated digit SA:V ratio, as this has been established as the most important parameter affecting an organism’s thermoregulation [Citation25]. While not presented, the findings notably did not differ if analyzed by surface area or volume alone.
Statistical analysis was performed using GraphPad Prism 8.3.0 (GraphPad Software Inc., USA). Normality of data was assessed using the Kolmogorov–Smirnov test. Tfinger (average temperature and AUC) and LDF (average temperature and AUC) during hand cooling and subsequent rewarming were quantified using custom macros created in LabChart 8.1.13 (ADInstruments, USA) and compared to digit anthropometric data using simple linear regressions and Pearson correlation coefficients. Statistical significance was set at p ≤ 0.05 using a two-tailed analysis. Figures were created using Python 3.9 (Seaborn 0.11.2, Python Software Foundation, USA). All figures display 95% confidence bands. Where applicable, data are reported as mean ± SEM.
Results
A summary of digit anthropometric characteristics is presented in . From an initial planned database of 60 and 30 sites for Tfinger and blood flux, respectively, 59 and 30 sites provided technically sound data for analysis. Male and female data are pooled as we did not have sufficient statistical power for sex-based comparisons. Over the entire baseline period, average Tfinger was 34.9 ± 0.1°C and average LDF was 156.2 ± 29.8 PU.
Table 1. Anthropometric characteristics of the digits of the fingers (n = 15).
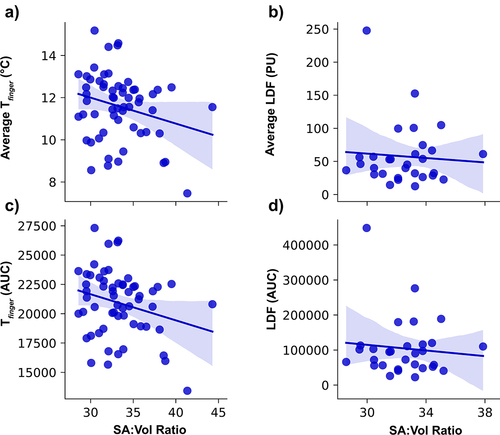
In response to cold water immersion, average Tfinger decreased to 18.2 ± 1.1°C during the first 5 min of cooling and 11.3 ± 0.5°C over the entire cooling period. Average LDF decreased to 57.2 ± 12.2 PU during the first 5 min of cooling and 40.4 ± 8.8 PU over the entire cooling period. The average Tfinger during the 5 min cooling phase showed a significant, negative correlation to digit SA:V ratio (p = 0.05; R2 = 0.06) (). Moreover, the area under the curve (AUC) for Tfinger during cooling demonstrated a significant, negative correlation with digit SA:V ratio (p = 0.05; R2 = 0.07) (). However, there were no significant relationships between digit SA:V ratio and average LDF (p = 0.704) or AUC (p = 0.607) of LDF during cooling ()).
Figure 2. Thermal responses of the pooled digits during the first 5 minutes of cold water immersion. A) average finger temperature (Tfinger) (p = 0.05; R2 = 0.06); B) average laser-Doppler fluxmetry (LDF); C) area under the curve (AUC) for Tfinger (n = 59 for Tfinger) (p = 0.05; R2 = 0.07); D) AUC for LDF (n = 30 for LDF).
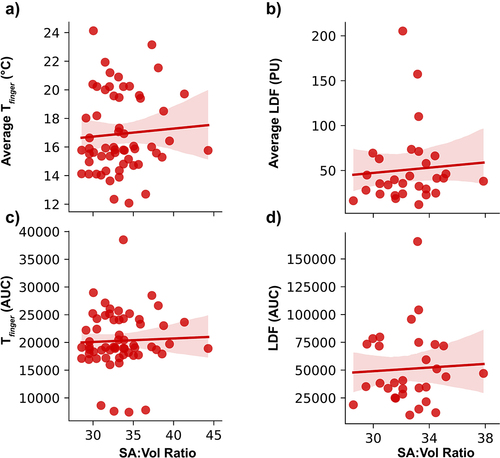
Average Tfinger increased to 15.3 ± 0.6°C during the first 10 min of rewarming and 16.9 ± 0.7°C over the entire rewarming period. Average LDF was 50.8 ± 12.7 PU over the first 10 min of rewarming and 50.8 ± 10.8 PU over the entire rewarming period. There were no significant relationships with any rewarming metric. Specifically, there were no significant relationships between digit SA:V ratio and average temperature (p = 0.626) or AUC (p = 0.767) of Tfinger during rewarming ()). Additionally, there was no significant relationships between digit SA:V ratio and average LDF (p = 0.724) or AUC of LDF (p = 0.811) during rewarming ()).
Figure 3. Thermal responses of the pooled digits during 10 minutes of rewarming. A) average finger temperature (Tfinger); B) average laser-Doppler fluxmetry (LDF); C) area under the curve (AUC) for Tfinger (n = 59 for Tfinger); D) AUC for LDF (n = 30 for LDF).
Discussion
Based on the current data, finger dimensions do not significantly influence the thermal responses of the digits during the initial cooling and rewarming phases of local cold exposure of the hand. Although finger temperature was significantly and negatively correlated with the SA:V ratio of the digits during cold exposure, the very low R2 values for both mean temperature and AUC suggests that finger dimensions explain very little of the variance across digits and individuals; furthermore, this relationship did not persist into the rewarming phase. Going beyond skin surface temperature, no significant relationships were observed between any measure of finger blood flow with finger dimension during either initial cooling or rewarming. Our findings thus suggest that other factors besides digit anthropometry likely predominate in predicting digit blood flow and temperature responses to cold exposure and ultimately in determining an individual’s risk for peripheral cold injuries.
Interestingly, our findings contrast the proposal of an evolutionary confluence between finger dimension, heat loss, and manual dexterity whereby longer and thinner digits enhance manual dexterity but are ultimately constrained by increased heat loss [Citation8]. There are significant differences in methodologies that may help explain the contrasting findings. Notably, Payne et al. [Citation2,Citation7,Citation8] utilized a brief 3 min hand immersion in ice (0°C) water, followed by 10 min of rewarming measured with an infrared camera as an index of digit temperature, and ultimately heat exchange [Citation26]. Arguably, cooling was incomplete in this brief immersion, with only a ~ 50% decline from baseline in Tfinger at the end of cold water immersion. In addition, rewarming may be only an indirect reflection of cooling dynamics, with the latter the more relevant consideration with freezing and non-freezing cold injuries [Citation27]. Alternatively, we directly measured thermal responses during the initial cooling phase of immersion, focusing on the 5 min initial period before significant vascular responses such as cold-induced vasodilation typically occurs. Our longer overall cooling phase of 30 min also achieved maximal digit cooling, with a plateau in Tfinger to a stable nadir. Therefore, it may be that the thermal inertia required for the digits to rewarm following our cold water immersion protocol was greater than that of Payne et al. [Citation2,Citation7,Citation8], which may have hindered our chance of observing significant relationships between digit anthropometrics and digit rewarming in our study.
Apart from anthropometry, a variety of anatomic characteristics may determine individual thermal responses to extremity cold exposure. In this study, we used LDF to measure red blood cell flux in the microvasculature of the fingertips, which are rich in arteriovenous anastomoses (AVAs). Importantly, AVAs close in response to elevated sympathetic activity during cold exposure [Citation28]. This is an effective strategy to minimize heat loss to the environment and is evidenced by the nearly threefold decrease in skin red blood cell flux from baseline during cold water immersion observed in this study (). However, the density of AVAs and the sensitivity of adrenergic axons are likely highly inter-individualized and potentially trainable. For example, the sympathetic response to cold exposure can be blunted with repeated cold exposure [Citation29]. Second, the thickness of the subcutaneous layer that resides below the dermis is highly variable among individuals [Citation30]. This insulating factor may significantly influence heat transfer to the surrounding environment. Lastly, while AVAs in the subcutaneous microvasculature may close with cold exposure, blood flow to the digits may remain via the deeper common and digital arteries to the thumb and fingers, maintaining heat input to the fingers that dampen biophysical differences in heat exchange from anthropometry.
Limitations
Although we recruited subjects with diverse hand anthropometrics, the small sample size utilized in this study may have limited our ability to observe a more robust impact of SA:V on the thermal responses of the digits to cooling and subsequent rewarming. Our data had insufficient statistical power to derive sex-based inferences. On average, females have smaller and thinner digits than males [Citation31], which contributes to a greater SA:V ratio compared to males with squarer hands featuring larger and thicker digits [Citation32]. Moreover, other sex-specific factors, such as thinner skin [Citation33] and lower delivery of blood flow to the fingers [Citation34,Citation35], could lead to more severe thermal responses during cold water immersion in females compared to males. Future work is required to determine the influence of sex on the thermal responses to hand cooling and subsequent rewarming, as this may have significant implications for cold weather operations and survival situations. Second, although we ensured that participants had limited experience with cold exposure experiments, this study was conducted during the winter months in Canada. Therefore, it is possible that the participants’ sensitivity and thermal responses to cold water immersion may have been influenced by seasonal exposure to cold weather.
Summary
Taken together, these findings suggest that digit anthropometrics may not contribute significantly to the thermal responses of the digits during cold water immersion and subsequent rewarming. Accordingly, other factors such as AVA control and sensitivity, skin thickness, and blood flow to larger vessels in the hand may play a larger role in dictating the thermal responses and should be targets of future investigations.
Research highlights
Digit temperature showed only very slightly significant, negative correlations to digit dimensions during hand cooling. This was not seen with digit blood flux.
Digit temperature and heat flux showed no relationship with digit dimensions during rewarming from hand cooling.
Digit dimensions do not appear to form a sole or dominant role in extremity cold response.
Abbreviations
| AUC | = | Area under the curve |
| LDF | = | Laser-Doppler fluxmetry |
| PU | = | Perfusion units |
| Tfinger | = | Finger temperature |
| Twater | = | Water temperature |
| SA | = | Surface area |
| SA:V | = | Surface area to volume |
Author contributions
KAW conceived the experiments. KAW and SSC designed the experiments. KAW collected the data. KAW reduced and analyzed the data. KAW and SSC interpreted the data. KAW and SSC drafted the manuscript and approved the final version.
Grants
This study was supported by the National Sciences and Engineering Research Council (NSERC) through CGS-D funding (K.A. Wickham) and a Discovery grant (2018-04077; S.S. Cheung).
Acknowledgments
We sincerely thank the participants for volunteering their time as well as Scott W. Steele and Jacob R. Morton for their assistance with data collection.
Disclosure statement
No potential conflict of interest was reported by the author(s).
Additional information
Funding
References
- Cheung SS. Responses of the hands and feet to cold exposure. Temperature. 2015;2(1):105–120. doi:10.1080/23328940.2015.1008890.
- Payne S, Macintosh A, Stock J. Body size and body composition effects on heat loss from the hands during severe cold exposure. Am J Phys Anthropol. 2018;166:313–322.
- Imray C, Richards P, Greeves J, et al. Nonfreezing Cold-Induced Injuries. J R Army Med Corps. 2011;157:79–84.
- Haman F, Souza SCS, and Castellani JW, et al. Human vulnerability and variability in the cold: Establishing individual risks for cold weather injuries. Temperature. 2022;1–38. doi:10.1080/23328940.2022.2044740.
- Heus R, Daanen HAM, Havenith G. Physiological criteria for functioning of hands in the cold: a review. Appl Ergon. 1995;26(1):5–13.
- Cheung SS, Montie DL, White MD, et al. Changes in manual dexterity following short-term hand and forearm immersion in 10 degrees C water. Aviat Space Environ Med. 2003;74(9):990–993.
- Payne S, Macintosh A, Stock J. The thermoregulatory function of the human hand: how do palm and digit proportions affect heat loss? Am J Phys Anthropol. 2018;166(4):803–811.
- Payne S, Macintosh A, Stock J. The influence of digit size and proportions on dexterity during cold exposure. Am J Phys Anthropol. 2018;166(4):875–883.
- Daanen HAM, van der Struijs NR. Resistance Index of Frostbite as a predictor of cold injury in Arctic operations. Aviat Space Environ Med. 2005;76(12):1119–1122.
- Kuht JA, Woods D, Hollis S. Case series of non-freezing cold injury: epidemiology and risk factors. J R Army Med Corps. 2019;165(6):400–404.
- Ikäheimo TM, Hassi J. Frostbites in circumpolar areas. Glob Health Action. 2011;4(10):8456.
- Lazenby R, Smashnuk A. Osteometric variation in the Inuit second metacarpal: a test of Allen’s rule. Int. J. Osteoarchaeol. 1999;9:182–188.
- Betti L, Lycett SJ, von Cramon-Taubadel N, et al. Are human hands and feet affected by climate? A test of Allen’s rule. Am J Phys Anthropol. 2015;158:132–140.
- Taylor NAS, Machado-Moreira CA, van den Heuvel AMJ, et al. Hands and feet: physiological insulators, radiators and evaporators. Eur J Appl Physiol. 2014;114:2037–2060.
- Wells JCK, Stock JT. The biology of the colonizing ape. Am J Phys Anthropol. 2007;134:191–222.
- Parsons KC. Human thermal environments: the effects of hot, moderate, and cold environments on human health, comfort, and performance. Third ed. Boca Raton: CRC Press, Taylor & Francis Group; 2014.
- Wickham KA, Steele SW, Cheung SS. Effects of acute dietary nitrate supplementation on cold-induced vasodilation in healthy males. Eur J Appl Physiol. 2021;121:1431–1439.
- Cicinelli E, Ignarro LJ, Lograno M, et al. Circulating levels of nitric oxide in fertile women in relation to the menstrual cycle. Fertil Steril. 1996;66:1036–1038.
- Saumet JL, Kellogg DL, Taylor WF, et al. Cutaneous laser-Doppler flowmetry: influence of underlying muscle blood flow. J Appl Physiol. 1988;65:478–481.
- Aminoff MJ. Aminoff’s electrodiagnosis in clinical neurology, 6th edition. United States: Saunders; 2012.
- Hodges GJ, Mallette MM, Cheung SS. Cutaneous neural activity and endothelial involvement in cold-induced vasodilatation. Eur J Appl Physiol. 2018;118:971–978.
- Hodges GJ, Kosiba WA, Zhao K, et al. The involvement of heating rate and vasoconstrictor nerves in the cutaneous vasodilator response to skin warming. Am J Physiol Heart Circ Physiol. 2009;296:H51–H56.
- Tyler CJ, Reeve T, Cheung SS. Cold-Induced vasodilation during single digit immersion in 0°C and 8°C water in men and women. PLOS ONE. 2015;10:e0122592.
- Ruijs ACJ, Niehof SP, Selles RW, et al. Digital rewarming patterns after median and ulnar nerve injury. J Hand Surg. 2009;34:54–64.
- Louw GN. Physiological animal ecology. United Kingdom: Longman Scientific and Technical: Burnt Mill; 1993.
- Priego Quesada JI, Martínez Guillamón N, Cibrián Ortiz de Anda RM, et al. Effect of perspiration on skin temperature measurements by infrared thermography and contact thermometry during aerobic cycling. Infrared Phys Technol. 2015;72:68–76.
- McIntosh SE, Freer L, Grissom CK, et al. Wilderness medical society clinical practice guidelines for the prevention and treatment of frostbite: 2019 update. Wilderness Environ Med. 2019;30:S19–S32.
- Walløe L. Arterio-Venous anastomoses in the human skin and their role in temperature control. Temperature. 2015;3:92–103. doi:10.1080/23328940.2015.1088502.
- Young AJ, Sawka MN, and Pandolf KB. Physiology of cold exposure. Nutritional needs in cold and in high-altitude environments: Applications for military personnel in field operations. United States: National Academies Press; 1996.
- Stolwijk JA, Hardy JD. Partitional calorimetric studies of responses of man to thermal transients. J Appl Physiol. 1966;21:967–977.
- Jay O, Havenith G. Finger skin cooling on contact with cold materials: an investigation of male and female responses during short-term exposures with a view on hand and finger size. Eur J Appl Physiol. 2004;93:1–8.
- Kulaksiz G, Gözil R. The effect of hand preference on hand anthropometric measurements in healthy individuals. Annals of Anat - Anatomischer Anzeiger. 2002;184:257–265.
- Fruhstorfer H, Abel U, Garthe C-D, et al. Thickness of the stratum corneum of the volar fingertips. Clin Anat. 2000;13:429–433.
- Bollinger A, Schlumpf M. Finger blood flow in healthy subjects of different age and sex and in patients with primary Raynaud’s disease. Acta Chir Scand Suppl. 1976;465:42–47.
- Cooke JP, Creager MA, Osmundson PJ, et al. Sex differences in control of cutaneous blood flow. Circulation. 1990;82(5):1607–1615.