
 ?Mathematical formulae have been encoded as MathML and are displayed in this HTML version using MathJax in order to improve their display. Uncheck the box to turn MathJax off. This feature requires Javascript. Click on a formula to zoom.
ABSTRACT
Fine-scale personal heat exposure (PHE) information can help prevent or minimize weather-related deaths, illnesses, and reduced work productivity. Common methods to estimate heat risk do not simultaneously account for the intensity, frequency, and duration of thermal exposures, nor do they include inter-individual factors that modify physiological response. This study demonstrates new whole-body net thermal load estimations to link PHE to heat stress and strain over time. We apply a human-environment heat exchange model to examine how time-varying net thermal loads differ across climate contexts, personal attributes, and spatiotemporal scales. First, we investigate summertime climatic PHE impacts for three US cities: Phoenix, Miami, and New York. Second, we model body morphology and acclimatization for three profiles (middle-aged male/female; female >65 years). Finally, we quantify model sensitivity using representative data at synoptic and micro-scales. For all cases, we compare required and potential evaporative heat losses that can lead to dangerous thermal exposures based on (un)compensable heat stress. Results reveal misclassifications in heat stress or strain due to incomplete environmental data and assumed equivalent physiology and activities between people. Heat strain is most poorly represented by PHE alone for the elderly, non-acclimatized, those engaged in strenuous activities, and when negating solar radiation. Moreover, humid versus dry heat across climates elicits distinct thermal responses from the body. We outline criteria for inclusive PHE evaluations connecting heat exposure, stress, and strain while using physiological-based methods to avoid misclassifications. This work underlines the value of moving from “one-size-fits-all” thermal indices to “fit-for-purpose” approaches using personalized information.
GRAPHICAL ABSTRACT
Introduction
Advancing personal heat research
Hot weather can lead to a loss of productivity and heat-related illnesses and deaths, yet these issues are preventable or can be minimized with more individual-level exposure data[Citation1]. Assessing personal heat exposure (PHE) implies evaluating heat exchanges between people and their micro-environments within the spaces they live, work, and play, indoors and outdoors [Citation2]. Numerous studies converge on the need to enhance existing heat risk management strategies, monitoring methods, and modeling at finer scales, emphasizing exposures to vulnerable groups [Citation1–4]. In particular, a link between heat load and social risk is required to assess PHE with physiological indicators [Citation5]. Finally, PHE research is fundamental to avoid misclassifications in heat-related health outcomes that are expected to increase with climate change and urban growth [Citation6–8].
Interdisciplinary work is needed to analyze the source-to-effect continuum from a hazardous exposure (e.g. high heat) to an ensuing health effect (e.g. death). Exposure sciences bridge environmental and health sciences by addressing whether humans come into contact with a toxicant or hazard [Citation9]. Extreme heat is a physical hazard that people experience in various “doses” (intensity, frequency, and duration). Heat stress is any thermal change (net heat load) that disturbs the balance between an organism and its thermal environment, and thermal strain is the overall physiological response to thermal stress [Citation10]. Building on these definitions, PHE quantifies significant doses of heat that lead to a particular heat strain (). This distinction is essential for distinguishing relevant PHE for short-term or long-term heat-related health outcomes [Citation6]. As the same environment can add different doses of heat to the body based on activity and physiological constraints, the use of PHE in research must fully address heat stress over time and include the human body as a heat source (i.e. metabolic heat production ()) as well as clothing parameters.
Table 1. Connecting personal heat exposure (PHE), which focuses on quantifying environmental heat load, with heat stress and strain to demonstrate the modeling goals within the current study. By leveraging the scope and definition of PHE to assess compensability under heat stress, we show how heightened PHE can lead to a rise in core temperature, dehydration, and cardiovascular strain over time.
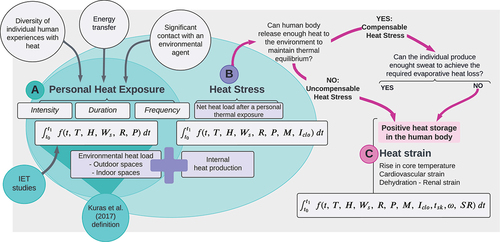
Therefore, we extend PHE, which focuses on environmental heat loads, to allow for the estimation of heat stress and strain over time that can cause a rise in core temperature, dehydration, and cardiovascular strain. This extension is documented in , which outlines the new modeling capabilities demonstrated in the current paper, wherein area “A” defines PHE (i.e. temperature, humidity, wind speed, and radiation over time), “B” adds clothing and internal heat production to estimate heat stress, and “C” determines whether said heat stress is compensable or not based on physiologic factors, and thus whether or not heat strain will occur. The relevant definitions are listed in .
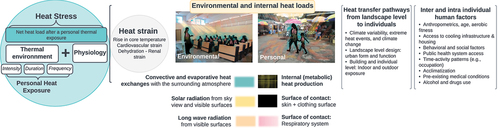
Figure 1. Environmental and inter-individual factors influencing a) personal heat exposure (PHE), b) heat stress, and c) heat strain. See for definitions. To determine heat strain in individuals over time (t, dt) we must know the spatio-temporal evolution of temperature (Tair), humidity (H), wind speed (), radiation (r), atmospheric pressure (p) of the surrounding environment, their metabolic rate (M), clothing insolation (
), skin temperature
, skin wettedness (
), and sweat rate (SR). Relevant definitions are listed in .
Intra and inter-individual assessments of heat stress and strain based on PHE
Physiologically, the thermoregulatory system balances the internal heat production and external environmental heat fluxes to maintain a stable internal temperature [Citation1,Citation11,Citation12]. However, the body may or may not compensate during heat stress to return to thermal equilibrium (). Compensable heat stress (CHS) occurs when heat loss to the environment is balanced with heat gain; hence, a steady-state core temperature can be sustained [Citation13]. Conversely, uncompensable heat stress (UHS) occurs when evaporative cooling requirements are not supported due to environmental or other conditions (including low sweat production) that impede the body’s ability to cool [Citation13]. In UHS, the internal body temperature rises, which can result in hyperthermia. Generally, hyperthermia is divided by degree of severity into heat cramps, heat exhaustion, and potentially fatal heatstroke, either classic or exertional [Citation1].
Under varying environmental heat loads, both inter- and intra-individual (i.e. features that a person can change over time) human factors may predispose a person to various levels of heat stress and related health outcomes [Citation14–16] (). In cities, for instance, higher thermal exposures arise at the landscape level, transferred to buildings, and finally to individuals [Citation7]. Personal factors such as physical characteristics (i.e. mass and surface corporal area) and activities [Citation17,Citation18] determine the metabolic rate and, thus, internal heat production, while clothing affects heat loss. Moreover, age, sex, aerobic fitness, acclimatization, medical and neurological disorders (i.e. diabetes, Alzheimer’s), physical disabilities, alcohol use, certain medications, and drugs also modify susceptibility to heat [Citation15,Citation19–24]. Other considerations affecting heat risk may include socio-demographic and behavioral factors, such as infrastructure access and housing insecurity [Citation25–27], cultural practices [Citation15,Citation16], digital visibility [Citation28], or occupation (e.g. outdoor workers [Citation16,Citation29–36]).
Figure 2. Relationships between the need for heat loss (positive values) or heat gain (negative values) to reach thermal equilibrium (, x-axis) against the potential evaporative heat losses given a set of environmental conditions and clothing insulation (
, y-axis). The ratio of
-to-
relates the degree of thermal stress to heat exerted on the body (required skin wettedness,
). Critical values of
are represented with black lines: 0.5 for low-efficient heat loss (thick line) and 1 to limit compensable/uncompensable heat stress (thin line). The purple lines represent values of
for the young/acclimatized and elderly/non-acclimatized when the liquid sweat loss is non-replenished. The vertical gray line at
= 0 indicates thermal equilibrium. Therefore, the numbered zones correspond to 1) cold stress, 2) compensable heat stress (CHS), 3) CHS with low sweating efficiency (CHS + Low
, 4) uncompensable heat stress (UHS), 5) CHS with limited sweat rate (CSH + LS), and 6) CHS + Low
+ LS.
Because of these differences, a critical perspective in PHE research involves explaining who is affected by heat exposure and how overexposure that leads to UHS occurs by connecting environmental data with an individual’s physiological, behavioral, or subjective responses [Citation4]. However, PHE research is highly heterogeneous, and current methods are not consistent in quantifying PHE to account for the three dimensions of exposure (intensity, duration, and frequency); most PHE research has focused on the intensity dimension [Citation5]. Hence, there is a need to create standardized practices to obtain accurate exposures while recognizing the higher multidimen-sionality and context-specific nature of PHE. It is also evident that geographic gaps in PHE research exist (mainly in Latin-American and African countries), as well as socioeconomic knowledge gaps [Citation2,Citation4,Citation37,Citation38].
Misrepresentations in PHE research
Misrepresentations across diverse individuals (personal profiles and behaviors) and scales in PHE research may be caused by neglecting the heterogeneous nature of personal experiences and using observations that are not representative of an individual’s situation [Citation5,Citation6,Citation39–42]. 340 thermal stress indicators exist, of which 187 can be mathematically calculated using only meteorological data [Citation43]. However, meteorology-based indicators only partially explain the variance in physiological heat strain [Citation44]. For example, many thermal indices describe heat/cold exposure from a generalized thermal experience, i.e. “average humans” wearing the same clothing under specific activities (often low metabolic rate) and climates [Citation3]. The use of thermal indices to address PHE in which certain individuals are underrepresented (e.g. women, children, pregnant women) neglects the inherent physiological vulnerability in some groups of concern – the most critical being older adults who face a reduced capacity to sweat and thus limited evaporative heat loss [Citation45,Citation46]. Finally, misrepresentation due to the use of sparse stationary measurements can cause incongruence in heat data for decision-making at specific scales [Citation47]. For example, Hass et al [Citation48], found a wider range of temperature variations in individual experienced temperature (IET) collected with wearable sensors compared to data from fixed synoptic weather stations.
To overcome these misrepresentations, cutting-edge research is conducted in different scientific fields with diverse measures and settings. For instance, thermal physiology often assesses heat strain experienced by healthy people in response to the intensity, duration, and frequency of heat exposure under controlled-laboratory settings while using medical-grade equipment for physiological measurements (e.g. to assess cardiovascular and renal strain [Citation12,Citation20,Citation49–51]). Lately, a “receptor-oriented” approach has been adopted using noninvasive wearable sensors to capture the three exposure dimensions in free-living conditions within IET studies [Citation5,Citation42,Citation48,Citation52–54] and occupational health studies [Citation34,Citation39,Citation52,Citation55–57]. This paradigm shift is aligned with the call from the health geography field to investigate dynamic environmental exposures rather than static approaches [Citation58]. However, more methodological and applied work is needed to address the context-specific heat experiences, especially for the most vulnerable, harmonizing and improving methods and techniques among scientific disciplines.
Study purpose and objectives
We advance PHE research beyond heterogeneous environmental heat loads toward quantifying compensability in heat stress (and thus the potential for heat strain) across diverse individuals, climates, and scales. We apply a human-environment heat exchange model to improve PHE assessments based on thermal load calculations. Our modeling framework leverages 1) long-term, large-scale climate data from three cities and short-term microclimate data for one city ; and 2) personal attributes for three profiles (a middle-aged male, a middle-aged female, and a female >65 years) to estimate instantaneous thermal loads. Emphasis is placed on thermally compensable versus uncompensable heat stress conditions based on evaporative heat losses. We hypothesize that 1) equivalent thermal loads will lead to different instances of compensability depending on personal profile, 2) the climate context will alter the frequency of CHS and UHS, with hot and humid creating the most dangerous conditions; and 3) fine-scale microclimate data will facilitate a better understanding of an individual’s net heat load over time.
Materials and methods:
Human-environment heat exchange models to address personal heat exposure
Here, we use the Partitional Calorimetry approach outlined by Cramer and Jay [Citation18], which allows separate calculation of each heat transfer component based on the fundamental laws governing dry and latent heat transfer. Unlike other methods, Partitional Calorimetry is physiologically based but not numerically demanding, facilitating easy modeling of numerous environmental and behavioral hypotheses. Human heat exchange models are based on the fundamental human heat balance equation:
where represents the rate of internal heat accumulation (or storage);
is the production of heat by metabolism;
is external work rate (or the heat produced by the human body) while performing activities; R, C, and K represent dry heat transfer by radiation, convection, and conduction, respectively; and E is the heat exchange by evaporative heat dissipation. However, the internal heat production (
corresponds to the difference between
and
. Further, as the surface area of skin in direct contact with solid surfaces tends to be minor, conduction (
) can be neglected. As a result, Equationequation 1
(1)
(1) takes the following form (Equationequation 2)
(2)
(2) :
The body heat accumulation () (cumulative whole-body thermal load change) is estimated by integrating EquationEquation 1
(1)
(1) over an interval of time (
) as follows:
As environmental heat exchanges occur on the skin surface and through respiration, Equationequation 3(3)
(3) is divided into the convective exchange and evaporative heat loss associated with skin and respiration. Thus, convective fluxes include
and
, while evaporative losses include
and
.
To evaluate thermal compensability, we investigate the relation of the heat loss required to achieve the heat balance () and the maximum evaporative capacity (
) based on the ambient environment and clothing (i.e. equation 16 in Cramer and Jay [Citation18]). In Equationequation 1
(1)
(1) , if we assume that heat stress is compensable via heat loss by sweat evaporation and a rate of body storage (
) equal to zero,
can be expressed as:
For the current study, we quantify PHE as the instantaneous thermal load (Equationequation 4)(4)
(4) to account for the potential net heat exchange in an instant of time and determine CHS versus UHS. If uncompensable (i.e. UHS:
) at one instant, the thermal load will be positive over a longer time and the body will likely gain heat, and vice-versa (, equation 5). CHS occurs when enough heat can be lost to the environment so that the body is not in a continuous state of heat gain or (
) assuming a steady-state core temperature, then:
In equation 5, the skin wettedness “required” for heat balance () is thus based on the ratio of
to
[Citation18]. Skin wettednes is also a measure of the proportion of wet skin at any given time [Citation59]. When
is close to 0.5, the efficiency of sweat declines indicating high heat stress (thick black line in ) and also indicates the effectiveness of evaporative heat loss from the skin surface (
). Throughout this paper, we use
to help assess compensability and degree of thermal stress in combination with sweat limits and efficiency, resulting in five zones of heat stress ().
In addition to environmental and clothing factors, evaporative heat loss also depends on physiological factors, such as maximum wettedness (), which is affected by acclimatization, and the maximum sweat rate. Here, to include acclimatization, we multiply
by
(fraction between 0 and 1) based on the given profile (). Second, we calculate the maximum evaporative heat loss linked with the maximum sweat rate (
) for each profile (purple lines and Zones 5 and 6 in ). Hence, we assume a constant
(equation 9 in Morris et al. [Citation60] Suppl. Material) based on the assumption that all sweat evaporates, therefore neglecting sweat efficiency. Finally, as assumed in partitional calorimetry, we fix mean skin temperature at 35°C [Citation61].
Table 2. Personal profiles used as examples in the current study. Specific parameters are provided for middle-aged male/female and elderly female. Personal variables needed within the model include body mass, effective body radiative area, the area-weighted emissivity of the clothed body surface, clothing insulation value, maximum skin wettedness, and maximum sweat rate.
Environmental input data
Environmental data needed for the model includes air temperature (Tair), mean radiant temperature (MRT), relative humidity, wind speed, and atmospheric pressure. In the given paper, city comparisons are representative of the typical climate at the synoptic scale, and microclimate data represent a localized scale.
For climate data, weather observations for a “Typical Meteorological Year” (TMY) are used based on the warm season (June to September) in Phoenix, Miami, and New York: Phoenix-Sky Harbor International airport (33.45°N, −111.983°W, 337 m.a.s.l), Miami International airport (25.8°N, −80.3°W, 11 m.a.s.l), and New York Central Park Observatory (40.7793°N, −73.9691°W,40 m.a.s.l). These cities allow for the inclusion of different types of heat: hot-dry, hot-humid, and a mix, respectively. Climate data correspond to TMY version 3 (TMY3) [Citation62] data, often used for building energy design and performance modeling.
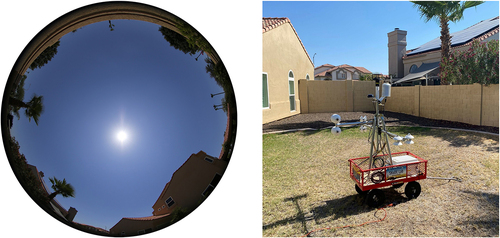
We also collected microclimate data with a high-end human-biometeorological station that measures Tair, humidity, wind speed, and six-directional short-wave and long-wave radiation (to estimate MRT) – also known as MaRTy [Citation63]. Diurnal data were collected during the first summer heatwave of 2022 in the southwest US, resulting in a heat warning [Citation64] for Phoenix from June 8–12th. The measurements were taken from June 9–11th, 2022, in a single-family home backyard located in an open low-rise (Local Climate Zone 6) neighborhood in Phoenix, Arizona. We chose to observe the microclimate in an open space (the sky view factor at that location is 0.909) to be consistent with the measurements from weather stations.
Personal profiles: Physiological inputs
We set up three personal profiles: middle-aged females, middle-aged males, and females above 65 years () to incorporate inter-individual factors such as anthropometrics (consequently, metabolic demand and sex), acclimatization, and sweat rate (to add aging differences). We did not consider intra-individual factors and do not address changes over time in the given paper. The middle-aged male profile corresponds to the average personal profile in the UTCI-Fiala model [Citation65], with a mass of 73.4 kg and a surface area (Ad) of 1.85 m2. All profiles have equivalent effective radiative body area, emissivity, and clothing insulation values (). We assume standing individuals with a clothing level of 0.57 Iclo (trousers, short-sleeved shirt). The effect of aging on thermoregulation in the model is accounted for with a reduction in the maximum sweat rate [Citation45] and the of an unacclimatized person [Citation66]. As the variability in the heat experienced between sex in this study is expressed with changes in anthropometrics, we choose to address the aging effects with just one of the two sex profiles to reduce redundancy in the results.
We ran the human-environment heat exchange model for the three personal profiles and cities to compare the following situations:
TMY summertime climate:
Case 1: Walking (3.5 metabolic equivalents (METs)), emulating indoor conditions (MRT = Tair), and facing calm winds (0.5 m/s).
Case 2: Climate data same as Case 1, still assuming MRT = Tair and calm winds, but varying METs to estimate
: resting 1.8 METs (standing, fidgeting), walking 3.5 METs (walking, 3.0 mph, moderate speed, not carrying anything), jogging 7 METs (jogging, general) [Citation67].
Case 3: Walking (3.5 METs), MRT = Tair, but varying wind speed. Sensitivity test, with wind speed according to the Beaufort wind scale of calm (0.5 m/s), light breeze (3 m/s), and moderate breeze (7 m/s).
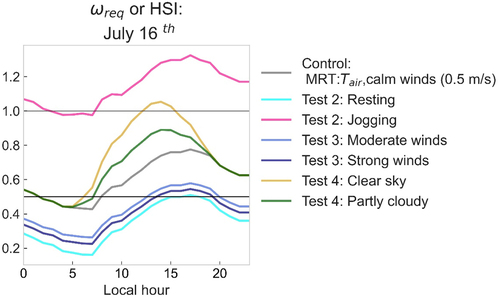
Case 4: Walking (3.5 METs), facing calm winds (0.5 m/s), with variable radiation levels: Indoor (MRT = Tair) versus partly and fully outdoor sun-exposed conditions using synthetic MRT values. Only daytime data (6:00 to 18:59 local time) were assessed.
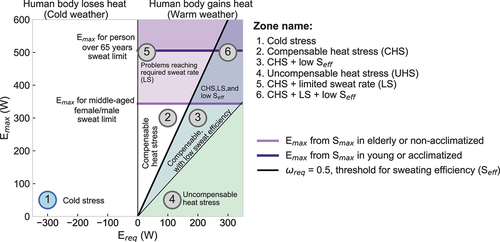
For Case 4, we estimated synthetic MRT values from TMY3 data using an offset value to increase the hourly Tair based on normalized solar radiation values (Sin). This criterion was chosen to simulate realistic MRT daytime variability. Hence, we include only the short-wave radiation portion of MRT. To obtain the normalized values, we take global radiation from TMY data and scale them to maximum solar radiation of 1366 W/m [Citation2] (the solar constant, Scon). We offset Tair values for partly cloudy conditions in a range from 0 and +15°C and clear sky from 0 to +30°C. The 15°C and 30°C thresholds were chosen based on Tair and MRT differences in microclimate measurements ( c) during a partly cloudy day (2022–06-09) and a clear sky day (2022–06-11) in Phoenix. displays the MRT values for the hottest day in the TMY from Phoenix used to test Case 4.
Figure 4. Simulated MRT hourly data for the hottest day in the TMY file from Phoenix (July 16th, 2022). Control corresponds to indoor conditions e.g. MRT equal to air temperature.
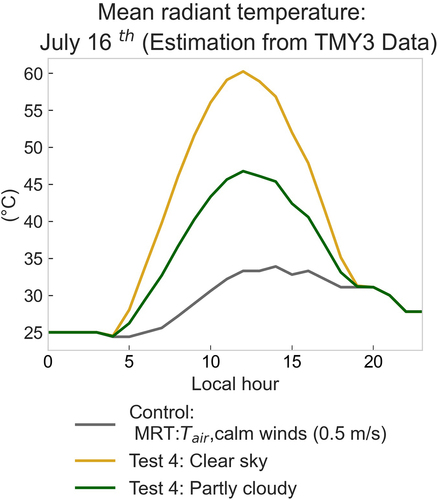
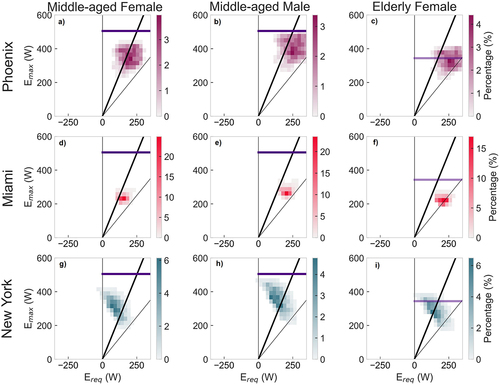
Figure 5. Case 1 scenarios – Two-dimensional histograms of the rate of required whole-body heat loss, (x-axis), and the maximum potential evaporative rate,
(y-axis,) for three personal profiles (columns) – Middle-aged female; Middle-aged male; Elderly female––while walking in the summertime in Phoenix, Miami, and New York (rows). Black diagonal lines:
= 0.5 (thick) and 1 (thin). Purple lines: values of
for the young/acclimatized and elderly/non-acclimatized (lighter shade) when liquid sweat loss is not replenished. Vertical gray line at
= 0 indicates thermal equilibrium.
Case 5) Microclimate Data – Summer Heatwave in Phoenix: Heat load estimates are calculated on extreme heat days using varying degrees of personal acclimatization (). Individuals are assumed to be walking (3.5 METs); variable outdoor wind speeds and MRT stem from collected microclimate data and are compared to climate data for the hottest day in the Phoenix TMY file.
Case 1 is the control case for climate summertime analyses (Cases 2, 3, and 4) with MRT = Tair, and a fixed wind speed of 0.5 m/s, while reference climate results for Case 5 correspond to the model results from TMY data with variable wind speed and estimated MRT clear sky. Therefore, has a reference to control (yellow line in ) as acontrol case because
is estimated using Case 1 data.
Analysis
All results are displayed within diagrams akin to using bivariate histograms that illustrate data counts over the ratio of (x-axis) and
(y-axis). This visualization shows the required skin wettedness (
), also known as Heat Stress Index, HSI [Citation68]. The color intensity in the bivariate histograms represents the percent of hours during summertime for
combinations. Thus, each pixel is interpreted as the percentage of time in a city during which its summer climate requires people to lose/gain a specific heat flux (
) to achieve thermal equilibrium, and the potential for heat loss
and
), with results falling into one of six zones (). The histograms display the number of observations in discrete bins, equally separated based on a 25 W range.
Results
Overview
Results reveal three critical advancements in modeling capabilities that are missing in PHE assessments from common approaches. First, we demonstrate the ability to model diverse populations using PHE information. Second, we underline the differential impacts on PHE among different “types” of heat (e.g. humid hot, dry hot); these thermal load signatures are missed when merely assessing Tair or using temperature-humidity indices. Third, we quantify how PHE can be misrepresented if using sparse weather station data that does not correspond to actual microclimate data where people are exposed.
Typical summertime climates in three cities
Case 1: displays differences in ,
, and
between permutations of three personal profiles and climates. The elderly female (, right column) is the most likely to be under high thermal stress. This profile shows a high percentage of time within Zone 3 (CHS + Low
), Zone 4 (UHS), and Zone 6 (CHS+ Low
+ LS) within the Phoenix and Miami summertime: 43.8%, 14.0%, and 36.4%, respectively, in Phoenix, summing to 94%, and 63%, 37%, and 0%, respectively, in Miami, summing to 100%. New York results were lower at 48%, 4.6%, and 0.4%, respectively. These zones depict low efficiency in evaporative heat loss and thus a danger in rising core temperatures for the older female profile if behavioral actions to lower their thermal load are not taken.
shows the different nature of the physiological constraints caused by thermal stress between climate types, as evidenced by the summertime predominance in each of the zones for /
combinations. For instance, on average for Miami and all personal profiles (), more than 86% percent of the summertime weather conditions lead to low efficiency in sweat evaporation but are still compensable via evaporative heat loss (Zone 3). However, if an elderly person is walking during summertime, they would remain in Zone 3 for 62% of the time, and under UHS (Zone 4) 37% of the time (compared to 0.01% for a middle-aged female).
In contrast, the heat stress exerted on people in New York and Phoenix summer (higher temperatures than Miami, yet drier) is more variable and, most of the time, compensable. In those cities, heat stress can either be linked to low efficiency in evaporative heat loss ( >0.5, or low
zones) or demand for sweating that exceeds the sweat rate of a person, which is more likely to occur in elderly people. Phoenix () is characterized by very low humidity and very high temperatures during the summer, except during the monsoon season with higher humidity and some precipitation. In response, a pedestrian would experience CHS with low
(Zone 3) during 66% of the summer.
Figure 3. The MaRTy human-biometeorological station located in a single-family home backyard in an open low-rise Local Climate Zone (LCZ 6, SVF: 0.909) neighborhood in Phoenix, Arizona. The portable station monitors net radiation in three directions to provide highly accurate MRT values, air temperature, relative humidity, and wind velocity.
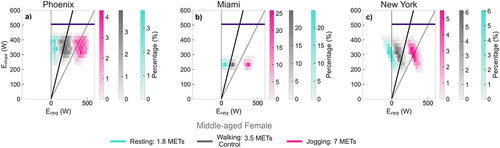
Case 2: displays the variability of /
combinations when the activity level varies for the middle-aged female profile for three climate types. Results for the remaining profiles are in Suppl. material SS1.
This sensitivity test indicates how people can fall into UHS while performing vigorous activities during summertime in dry or humid heat. The rate of whole-body heat loss required () to achieve thermal equilibrium increases with exercise intensity, thus shifting histograms to the right with intensity moving from fully CHS for resting to high UHS frequencies when running (i.e. 100% of the time for Miami, 79% for Phoenix, and 48% for New York).
Figure 6. Case 2 scenarios – Two-dimensional histogram for the rate of required whole-body heat loss, (x-axis), and the maximum potential evaporative rate,
(y-axis), for the middle-aged female profile performing different activities (blue =resting, grey =walking, pink =jogging). The model was run using hourly TMY summertime data for Phoenix, Miami, and New York. Black diagonal lines:
= 0.5 (thick) and 1 (thin). Purple lines: values of
for the young/acclimatized when the liquid sweat loss is non-replenished. Vertical gray line at
= 0 indicates thermal equilibrium.
Case 3: The effect of wind speed changes on whole-body heat exchanges for the middle-aged woman is displayed in . Results for the remaining profiles are in Suppl. Material SS2.
Figure 7. Case 3 scenarios – Two-dimensional histogram for the rate of required whole-body heat loss, (x-axis), and the maximum potential evaporative rate,
(y-axis), for the middle-aged female personal profile walking while facing different constant wind speeds at human height (gray = calm winds (0.5 ms−[Citation1]), light blue = light breeze (3 ms−[Citation1]), dark blue = moderate breeze (7 ms−[Citation1]). The model was run using hourly TMY summertime data from Phoenix, Miami, and New York. Black diagonal lines:
= 0.5 (thick) and 1 (thin). Purple lines: values of
for the young/acclimatized when the liquid sweat loss is non-replenished. Vertical gray line at
= 0 indicates thermal equilibrium.
![Figure 7. Case 3 scenarios – Two-dimensional histogram for the rate of required whole-body heat loss, Ereq (x-axis), and the maximum potential evaporative rate, Emax (y-axis), for the middle-aged female personal profile walking while facing different constant wind speeds at human height (gray = calm winds (0.5 ms−[Citation1]), light blue = light breeze (3 ms−[Citation1]), dark blue = moderate breeze (7 ms−[Citation1]). The model was run using hourly TMY summertime data from Phoenix, Miami, and New York. Black diagonal lines: ωreq = 0.5 (thick) and 1 (thin). Purple lines: values of Emax_sweat for the young/acclimatized when the liquid sweat loss is non-replenished. Vertical gray line at Ereq = 0 indicates thermal equilibrium.](/cms/asset/e716fbcc-ecd0-4322-8a6f-a48162ef1fa1/ktmp_a_2149024_f0007_oc.jpg)
As wind speed increases, also increases, which is depicted by the vertical displacement in the histograms. However, if the maximum sweat rate is exceeded (points above purple lines or Zones 5 (CSH + LS) and 6 (CSH + LS + Low
)), the maximum amount of sweat,
, will not be enough to maintain thermal equilibrium. This type of thermal stress also exacerbates the risk of dehydration. The convective loss/gain of heat (
) also increases, yet the direction (gain or loss) depends on the air-to-skin temperature gradient. For example, convection is often a heat gain in the Phoenix summer due to the prevalence of temperatures above the skin temperature assumed in the model (>35°C), which is reflected by the upward histogram shifts in Phoenix (). However, in New York and Miami, histograms shift left with higher winds due to convective cooling (). At higher wind speeds, the thermal environment in Miami and New York results in lower
values, and during cooler New York nights in a TMY summer, the moderate winds can feel cold. In contrast, during the dry Phoenix summer, a middle-aged female experiences CHS at a
< 0.5 (Zone 2 and 5) 33% of the time under calm winds and 89% under a moderate breeze. However, with higher wind speeds, the potential heat losses in Phoenix are compromised by 14% (Zone 5) due to sweat rate limitations.
Case 4: The results of changing daytime radiation levels (comparing indoor, partly cloudy, and clear sky conditions) for a middle-aged female walking are shown in . Results for middle-aged males and elderly females are in Suppl. Material SS3.
The net effect of heat stress under increased radiative fluxes is akin to adding heat via metabolic energy (). With higher radiation increasing the thermal load, more whole-body heat loss is required to achieve heat balance (), which is demonstrated by the rightward displacement of the histograms moving from CHS (Zone 2) to CHS + Low
(Zone 3) and even into UHS (Zone 4) under clear-sky conditions. In Miami, under conditions where MRT = Tair, the heat loss through evaporation of sweat, although compensable, is inefficient for most of the summer (CHS: 14%, CHS + Low
: 86%, UHS: 0%). These results show that CHS can quickly turn uncompensable with increased solar radiation. For clear sky conditions in Miami, CHS conditions are infrequent (10%), while conditions become compensable (yet with Low
(Zone 3)), 60% of the time, and are within UHS 30% of the time if no adaptative measures are taken.
displays the hourly variation during the hottest day in the TMY of Phoenix to group model results for all scenarios with climate representative data. The model representation of each term in Equationequations 2
(2)
(2) and Equation4
(4)
(4) (
,
and
) for the same day is provided in Supplementary material SS4 and SS5.
Figure 8. Case 4 scenarios – Two-dimensional histogram for the rate of required whole-body heat loss, (x-axis), and the maximum potential evaporative rate,
(y-axis), for the middle-aged female personal profile walking in indoor, partly cloudy, and clear sky conditions (histogram colors). The model was forced with hourly TMY summertime data from Phoenix, Miami, and New York. Black, gray, and purple lines as in .
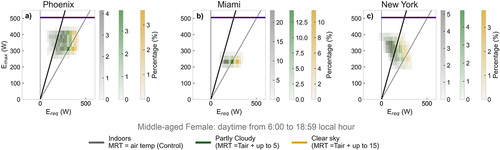
Figure 9. Case 4 – Hourly estimates for the hottest day in the TMY file from Phoenix (July 16th). Results for the middle-aged female profile. Each color corresponds to
for model 1 (Control), 2, 3, and 4. The horizontal lines delimite
: 0.5 and 1.
For a middle-aged female in Phoenix, the highest heat stress is experienced during a hot summer day when performing a vigorous activity (Case 2) and under high solar radiation levels (Case 4) (). In both cases, the instantaneous heat load reaches conditions of UHS. In contrast, lower PHEs occur while resting or walking at higher wind speeds.
Microclimate data vs. weather station data
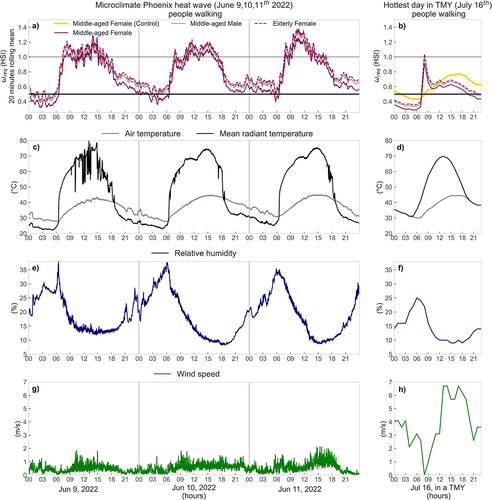
Case 5 demonstrates the difference between using fine-scale microclimate data versus large-scale climate data for each personal profile () and the same comparison for individuals performing different activities (). Although stationary microclimate data do not precisely fit the experienced heat of a person in their daily routine, this example demonstrates how the localized, high-end data (i.e. high-accuracy MRT) capture better the heat flux source areas and their time variability than standard weather observations. The 20-minute rolling mean of (), shows people experiencing UHS during the daytime while merely walking across three extreme heat days in Phoenix. Tair, MRT, H, and wind speed that lead to these
values are also shown in . In contrast, for a similar summer day, a regional weather station estimates UHS at 8:00 am only (). The datasets are not directly comparable because the TMY dataset has windier and drier weather conditions ( f and h) than the microclimate data ( e and g), as already discussed for Cases 1 ( and 3, 7), yet provide a helpful case study for advancing PHE research.
Figure 10. Case 5 – From top to bottom: (a,b) modeled (or HSI) for the three personal profiles (Middle-aged Female/Male andElderly female, all assumed to be walking); (c, d) air temperature and mean radiant temperature; (e, f) relative humidity; and (g, h) wind speed. The left panel corresponds to 1-minute microclimate data during a June 9–11th, 2022 heatwave in Phoenix, AZ, and the right panel to the hourly data for the hottest day in the TMY in Phoenix, AZ (July 16th). Graph a represent
as 20-minute rolling means. In (a, b), the horizontal lines delimit
: 0.5 and 1, and the yellow line in b) corresponds to the control run (gray line) in .
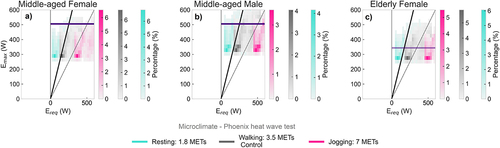
displays the thermal load differences and potential heat loss for all profiles performing different activities using microclimate data. Similar to Cases 1 and 2 (Figure SS1), the elderly female (or a non-acclimatized person) shows a higher probability of being under high thermal stress () because of low sweat loss (CHS + Low Zone 3), UHS (Zone 4), limited sweat rate (Zones 5 and 6), and a combination of the three factors. For instance, performing a vigorous activity, such as jogging, during a heat wave would result in UHS not only for the elderly, but would yield UHS 90% of the time in a middle-aged female, 98% of the time in a middle-aged male, and 100% of the time in an elderly female. Additionally, comparing Phoenix results using the two meteorological forcing methods, the microclimate exposure results in problems arising in heat dissipation if water is not well replenished even when resting (seen by comparing Zone 5 (CHS+LS) and Zone 6 (CHS + Low
+LS) in ).
Figure 11. Case 5 – Two-dimensional histogram for the rate of required whole-body heat loss, (x-axis), and the maximum potential evaporative rate,
(y-axis), for the three personal profiles performing different activities (histogram colors) during a heat wave (June 9–11th of 2022) in Phoenix, Arizona. The model was run using the 1-minute average of data collected with MaRTy in the backyard of a single-family home. Black diagonal lines:
= 0.5 (thick) and 1 (thin). Purple line: values of
for the young/acclimatized when the liquid sweat loss is not replenished. Vertical gray line at
= 0 indicates thermal equilibrium.
Discussion
Contextual findings and relationships
This work extends PHE research by linking heat exposure with the ability to estimate heat stress and strain over time. We also highlight pitfalls that can be incurred when considering homogeneous heat experiences for people with different biophysical characteristics. For instance, related work by Ioannou et al [Citation44]. underlines the need for future research that describes heat stress and strain in non-occupational populations performing various activities in a wide range of environmental settings considering inter- and intra-individual factors. Grundstein and Vanos [Citation3] caution the misuse of thermal indices and provide applicability notes and scenarios for numerous thermal indices, including UTCI, PET, mPET, and the WBGT index. By utilizing CHS and UHS zones () through modeling, we illustrate the extent and type of thermal stress estimated given personal characteristics/population diversity, activity, climate type, solar exposure, and scale of data. Sensitivity tests exhibit how these factors impact heat stress or strain and the consequences of misrepresenting an environment or the person’s physiology in PHE research. The ability to model these factors to assess CHS and UHS is largely based upon the dynamic relationship between convective heat and vapor transfers linked to personal and environmental inputs [Citation69].
For example, the distinction between males and females is expressed by a higher mass and surface corporal area in the male’s profile. The dimension of the body surface area (Ad) is the interface that mediates heat exchanges with the external environment: both and
are proportional to Ad. Simultaneously, body mass has two roles from a thermodynamic perspective: working as an internal heat sink, thus contributing to thermal inertia, and regulating the energy expenditure cost of weight-bearing exercise [Citation69]. Therefore, a higher mass assumes higher internal metabolic heat and more intense external heat exchanges, thus demanding more heat loss (
). As a result, the middle-aged male profile remains within the CHS area more frequently, even with limited sweat (i.e. Zone 5) than the middle-aged female profile (). However, a higher
implies that, due to the higher surface area, the male group would have to sweat more to compensate for the heat and would dehydrate faster than other groups.
This work also exemplifies the compounding effects of sweat impairments through modeling profiles with low efficiency in evaporative sweat loss (see CHS + Low + LS zone in ). Low sweat efficiency affects the elderly and people who take medications such as anticholinergics, antidepressants, and opioids (for further information see Ebi et al [Citation1].). Additionally, the inter-individual variability (by age and body surface area) in heat stress obtained with this modeling approach is in accordance with the most susceptible groups to heat stress described in direct calorimetry studies [Citation23].
We also demonstrate the importance of including people’s activity in PHE assessments. Changes in metabolic heat production ( lead to different
to achieve heat balance, even among people with similar physiological features in the same environment (see
variations in ).
rises with exercise intensity and depends on mechanical efficiency or movement economy [Citation20,Citation70]. Hence,
is a critical factor for understanding potential exertional heatstroke [Citation13] and heat-related illnesses among highly vulnerable groups such as outdoor workers and athletes [Citation1,Citation71,Citation72].
increases with activity level, increasing the required skin wettedness (HSI or
) and is thus linked to UHS and maintaining a stable internal temperature, which is a livability factor (ability to work, exercise, etc.) that PHE assessments can also undertake [Citation6].
An additional bias unveiled in this research is the incomplete representation of various types of environmental heat in PHE assessments. The contrasting thermal exposures between the summertime PHE of Phoenix (dry-heat prevalence), Miami (humid-heat prevalence), and New York (mix-type) demonstrate stark differences in CHS and UHS zones by profile. If a PHE assessment relies solely on Tair (i.e. IET studies), then convective, radiative, or evaporative heat fluxes (and thus heat stress) cannot be determined. Notably, Tair, although most easily measured, cannot be taken as a complete indicator of heat stress, as indicated by McGregor and Vanos [Citation73] and Kuras et al [Citation2]. Results here show the significance of including solar radiation in PHE work to assess outdoor heat stress and strain, which, if ignored, can cause gross misrepresentation of actual thermal loads, even under equivalent Tair, humidity, and wind speed (). Numerous studies show that MRT is a more appropriate indicator than Tair for thermal comfort in summertime conditions [Citation63,Citation74,Citation75]. The high thermal loads under clear-sky conditions also show the importance of strategic urban design and green infrastructure to mitigate heat, where radiation (e.g. MRT) is easily modified through design [Citation76–78].
The reduction within Miami in evaporative efficiency , which is the body’s most efficient way to dissipate heat [Citation79], was represented by the high proportion of results within UHS or CHS + Low . Physiological research also points to the importance of humidity and skin wettedness as critical factors for comfort, heat stress, and heat strain [Citation80]. Understanding the impact of humidity at high temperatures is paramount when choosing methods to address PHE in the tropics, where the gap in PHE research and heat mortality studies is large[Citation81].
Lastly, the modeling scenarios highlight the twofold role of wind speed in improving or worsening PHE (Case 3). Wind speed increases the convective and evaporative heat exchanges through the skin clothing surface [Citation20], yet the convective impact of wind (gain or loss) also depends on the body-to-air temperature gradient [Citation82]. For instance, Phoenix was the only city with a large increase in via incoming convective heat, while higher wind speeds in Miami and New York alleviate PHE ().
Finally, many studies have shown that sparse weather station data can misrepresent people’s IET [Citation5,Citation39,Citation48,Citation52]. The microclimate data allow for the analysis of thermal compensability during a heatwave at a finer scale. As in Hass et al [Citation48], we found that PHE is more variable using microclimatic data and that UHS prevalence is higher with increasing activity level. In general, PHE could be misrepresented by weather station data when people modify their behavior during peak heat, thus underestimating their heat stress or strain. For instance, Sugg et al [Citation52] indicated that under high air temperatures there is a decrease in the agreement between the heat index estimated with data from wearables and weather stations, concluding that in situ weather stations provide an approximate yet imprecise measurement of heat exposure for outdoor workers.
Advancing future PHE research
PHE analyses based on “source-oriented” assessments and population-level thermal indices are “one-size-fits-all approaches” [Citation83]. In this work, we promote a “fit-for-purpose” approach by applying fine-scale observations and individualized human-environment heat exchange modeling to estimate CHS and UHS. Analyzing people’s varying space-time heat transfer informed by their physiology and particular environmental context provides a more dynamic understanding of thermal load.
Individualized assessments of PHE provide a more thorough understanding of how people experience thermal limitations on a daily basis. Holistic PHE assessments will increase personal adaptative capacity and improve monitoring methods at the population level. The main challenges for obtaining reliable assessments are the availability of accurate input data––including adequate physiological inputs and microclimate physics––and applying an assertive and empathetic communication method. According to Krayenhoff et al [Citation84], an assessment based on modeled results is trustworthy when representative input is validated. Here, geographical feminist theories can be adopted [Citation85,Citation86] to incorporate multiple viewpoints to improve objectivity and recognize knowledge as context-specific. Finally, an empathetic communication model is relevant because PHE research involves working with the community, which is an opportunity to empower people with knowledge of their own thermoregulatory system and provide them with tools to prevent or cope with dangerous heat exposures.
Study limitations
The main limitations of this study are linked to the use of stationary measurements in a Lagrangian problem (because PHE requires individual travel patterns [Citation2]) and the lack of measured or estimated thermal strain. We indirectly address the misclassification through instantaneous thermal load and the compensability of heat stress instead of estimating heat storage over time (i.e. heat load for different time intervals and frequencies). As we focused on the instantaneous thermal load, we considered fixed values of time for clothing insulation, skin temperature, and metabolic rate, which implies we are also neglecting the behavioral mechanisms of thermoregulation to alleviate physiological heat strain. Future work should include observational studies to validate the heat load variability of free-living people moving through environments. Estimations of net heat load and heat storage instead of IET will also advance this area of research (e.g. applying thermal exposure metrics introduced in Hondula et al [Citation5], with heat load, along with heat strain measurements, as in Sugg et al [Citation52]).
Future research can go beyond exposure intensity or only using past data or short time periods to consider variable exposure doses and expected behavioral adaptations. For example, the proposed method allows one to estimate minimum thresholds of thermal load to develop specific thermal illnesses (see Cramer and Jay [Citation18]). Since the temporal resolution of the input data is important for the whole-body heat accumulation over time, sub-hourly observations are required to analyze exertional heat stroke, yet epidemiological models of heat deaths apply 24-h data [Citation6]. In general, future PHE research should strengthen the representation of groups of concern for adaptation and resilience plans, also helping with input information to understand cognitive impacts [Citation87], productivity [Citation30], and sleep [Citation88], and to further implement evidence-based cooling strategies at personal (e.g. clothing), population (e.g. occupational health policies), and the built environment level (e.g. shade infrastructure) [Citation7].
Conclusions
This study extends heat exposure research by linking PHE to thermal stress and strain over time, incorporating personal attributes rather than focusing solely on environmental heat loads. The scope and definition of PHE were applied to assess compensability under heat stress using a human-environment heat exchange model. We demonstrate how to consider the time-space variability of whole-body net heat loads, including inter-individual physiologic features and metabolic heat production, to advance PHE models. The novel methodology and visualizations illustrate the extent and type of heat stress utilizing CHS and UHS zones.
Our results reveal misclassifications of heat stress and strain due to an inaccurate differentiation of dry or humid heat in PHE research. We also demonstrate the importance of including people’s activity in PHE assessments and microclimate data that are representative of people’s daily routines. Criteria are outlined to provide reliable, accurate, and inclusive PHE evaluations connecting exposure, heat stress, and strain, while using physiological-based methods to avoid misclassifications of health impacts within groups of concern.
Our work initializes a paradigm shift in PHE research from traditional, instantaneous heat load assessments toward dynamic exposure modeling by employing human-environment heat exchange observations and simulations. The dynamic approach does not separate exposure from health outcomes when studying heat contact and recognizes the potential for future work to increase individual adaptative capacity with a focus on vulnerable and underrepresented groups in heat risk research.
Abbreviations
Table
Supplemental Material
Download MS Word (1.4 MB)Acknowledgments
The authors would like to thank Dr. Ollie Jay for insightful discussions on the application of the partitional calorimetry method for the city and person-specific estimates in the current paper. We would also like to thank Dr. David Hondula for providing important insight into the theoretical framing for this work and Dr. David Sailor for the generous feedback on the earlier stages of this research.
Disclosure statement
No potential conflict of interest was reported by the author(s).
Supplementary material
Supplemental data for this article can be accessed online at https://doi.org/10.1080/23328940.2022.2149024
Correction Statement
This article has been corrected with minor changes. These changes do not impact the academic content of the article.
Additional information
Funding
References
- Ebi KL, Capon A, Berry P, et al. Hot weather and heat extremes: health risks. Lancet. 2021;398(10301):698–708. doi:10.1016/S0140-6736(21)01208-3.
- Kuras E, Richardson MB, Calkins MM, et al. Opportunities and challenges for personal heat exposure research. Environ Health Perspect. 2017;125(8):085001. doi:10.1289/EHP556..
- Grundstein A, Vanos J. There is no ’swiss army knife’of thermal indices: the importance of considering ’why?’and ’for whom?’when modelling heat stress in sport. Br J Sports Med. 2021;55(15):822–824. doi:10.1136/bjsports-2020-102920.
- Nazarian N, Lee JKW. Personal assessment of urban heat exposure: a systematic review. Environ Res Lett. 2021;16(3):033005. doi:10.1088/1748-9326/abd350.
- Hondula DM, Kuras ER, Betzel S, et al. Novel metrics for relating personal heat exposure to social risk factors and outdoor ambient temperature. Environ Int. 2021;146:106271. doi:10.1016/j.envint.2020.106271.
- Vanos JK, Baldwin JW, Jay O, et al. Simplicity lacks robustness when projecting heat-health outcomes in a changing climate. Nat Commun. 2020;11(1):10–14. doi:10.1038/s41467-020-19994-1.
- Jay O, Capon A, Berry P, et al. Reducing the health effects of hot weather and heat extremes: from personal cooling strategies to green cities. Lancet. 2021;398(10301):709–724. doi:10.1016/S0140-6736(21)01209-5.
- Tuholske C, Caylor K, Funk C, et al. Global urban population exposure to extreme heat. Proc Natl Acad Sci U S A. 2021;118(41):e2024792118. doi:10.1073/pnas.2024792118.
- Lioy PJ. Exposure science: a view of the past and milestones for the future. Environ Health Perspect. 2010;118(8):1081–1090. doi:10.1289/ehp.0901634.
- Bligh J, Johnson KG. Glossary of terms for thermal physiology. J Appl Physiol. 1973;35(6):941–961. doi:10.1152/jappl.1973.35.6.941.
- Oke TR, Mills G, Christen A, et al. Urban climates. 1st ed. Cambridge: Cambridge University Press; 2017. doi:10.1017/9781139016476.
- Kenny GP, Poirier MP, Metsios GS, et al. Hyperthermia and cardiovascular strain during an extreme heat exposure in young versus older adults. Temperature. 2017;4(1):79–88. doi:10.1080/23328940.2016.1230171.
- Leon LR, Bouchama A. Heat stroke. Compr Physiol. 2015;5(2):611–647. doi:10.1002/cphy.c140017.
- Gagge AP, Gonzalez RR. Mechanisms of Heat Exchange: Biophysics and Physiology. Handbook of Physiology, Environmental Physiology. American Physiological Society. 1996: 45–84. doi:10.1002/cphy.cp040104
- Ioannou LG, Gkikas G, Mantzios K Risk assessment for heat stress during work and leisure Tsatsakis, Aristides M, et al. Chapter 32: Toxicological Risk Assessment and Multi-System Health Impacts from Exposure 1st. Academic Press. 2021;373–385. doi:10.1016/B978-0-323-85215-9.00004-0.
- Ioannou LG, Foster J, Morris NB, et al. Occupational heat strain in outdoor workers: A comprehensive review and meta-analysis. Temperature. 2022;9(1):67–102. doi:10.1080/23328940.2022.2030634.
- Jetté M, Sidney K, Blümchen G. Metabolic equivalents (METS) in exercise testing, exercise prescription, and evaluation of functional capacity. Clin Cardiol. 1990;13(8):555–565. doi:10.1002/clc.4960130809.
- Cramer MN, Jay O. Cores of reproducibility in physiology partitional calorimetry. J Appl Physiol. 2019;126(2):267–277. doi:10.1152/japplphysiol.00191.2018.
- Cheshire WP. Thermoregulatory disorders and illness related to heat and cold stress. Auton Neurosci Basic Clin. 2016;196:91–104. doi:10.1016/j.autneu.2016.01.001.
- Kenny GP, Jay O. Thermometry, calorimetry, and mean body temperature during heat stress. Compr Physiol. 2013;3(4):1689–1719. doi:10.1002/cphy.c130011.
- Kovats RS, Hajat S. Heat stress and public health: a critical review. Annu Rev Public Health. 2008;29(1):41–55. doi:10.1146/annurev.publhealth.29.020907.090843.
- Foster J, Hodder SG, Lloyd AB, et al. Individual responses to heat stress: implications for hyperthermia and physical work capacity. Front Physiol. 2020;11(541483). doi:10.3389/fphys.2020.541483.
- Flouris AD, McGinn R, Poirier MP, et al. Screening criteria for increased susceptibility to heat stress during work or leisure in hot environments in healthy individuals aged 31–70 years. Temperature. 2018;5(1):86–99. doi:10.1016/j.autneu.2016.01.001.
- Vanos JK. Children’s health and vulnerability in outdoor microclimates: a comprehensive review. Environ Int. 2015;76:1–15. doi:10.1016/j.envint.2014.11.016.
- Ramsay EE, Fleming GM, Faber PA, et al. Chronic heat stress in tropical urban informal settlements. iScience. 2021;24(11):103248. doi:10.1016/j.isci.2021.103248.
- Samuelson H, Baniassadi A, Lin A, et al. Housing as a critical determinant of heat vulnerability and health. Sci Total Environ. 2020;720. doi:10.1016/j.scitotenv.2020.137296.
- Escandón R, Suárez R, Alonso A, et al. Is indoor overheating an upcoming risk in southern Spain social housing stocks? Predictive assessment under a climate change scenario. Build Environ. 2022;207. doi:10.1016/j.buildenv.2021.108482.
- Longo J, Kuras E, Smith H, et al. Technology use, exposure to natural hazards, and being digitally invisible : implications for policy analytics. Policy & Internet. 2017;9(1):76–108. doi:10.1002/poi3.144.
- Nerbass FB, Pecoits-Filho R, Clark WF, et al. Occupational heat stress and kidney health: from farms to factories. Kidney Int Reports. 2017;2(6):998–1008. doi:10.1016/j.ekir.2017.08.012.
- Flouris AD, Dinas PC, Ioannou LG, et al. Workers’ health and productivity under occupational heat strain: a systematic review and meta-analysis. Lancet Planet Heal. 2018;2(12):e521–e531. doi:10.1016/S2542-5196(18)30237-7.
- Kjellstrom T, Briggs D, Freyberg C, et al. Human performance, and occupational health: a key issue for the assessment of global climate change impacts. Annu Rev Public Health. 2016;37(1):97–112. doi:10.1146/annurev-publhealth-032315-021740.
- Castillo F, Mora AM, Kayser GL, et al. Environmental health threats to latino migrant farmworkers. Annu Rev Public Health. 2020;42(1):257–276. doi:10.1146/annurev-publhealth-012420-105014.
- Moohialdin A, Trigunarsyah B, Islam MS, et al. Physiological impacts on construction workers under extremely hot and humid weather. Int Arch Occup Environ Health. 2022;95(2):315–329. doi:10.1007/s00420-021-01785-w.
- Runkle JD, Cui C, Fuhrmann C, et al. Evaluation of wearable sensors for physiologic monitoring of individually experienced temperatures in outdoor workers in southeastern U.S. Environ Int. 2019;129(August 2019):229–238. doi:10.1016/j.envint.2019.05.026citat.
- Ioannou LG, Mantzios K, Tsoutsoubi L, et al. Occupational heat stress: multi-country observations and interventions. Int J Environ Res Public Health. 2021;18(12):6303. doi:10.3390/ijerph18126303.
- Jay O, Brotherhood JR. Occupational heat stress in Australian workplaces. Temperature. 2016;3(3):394–411. doi:10.1080/23328940.2016.1216256.
- Cheng W, Li D, Liu Z, et al. Approaches for identifying heat-vulnerable populations and locations: a systematic review. Sci Total Environ. 2021;799:149417. doi:10.1016/j.scitotenv.2021.149417.
- Brimicombe C, Di Napoli C, Cornforth R, et al. Borderless heat hazards with bordered impacts. Earth’s Futur. 2021;9(9). doi: 10.1029/2021EF002064.
- Bernhard MC, Kent ST, Sloan ME, et al. Measuring personal heat exposure in an urban and rural environment. Environ Res. 2015;137:410–418. doi:10.1016/j.envres.2014.11.002.
- Harlan SL, Brazel AJ, Prashad L, et al. Neighborhood microclimates and vulnerability to heat stress. Soc Sci Med. 2006;63(11):2847–2863 doi:10.1016/j.socscimed.2006.07.030.
- Karner A, Hondula DM, Vanos JK. Heat exposure during non-motorized travel: implications for transportation policy under climate change. J Transp Heal. 2015;2(4):451–459. doi:10.1016/j.jth.2015.10.001.
- Kuras ER, Hondula DM. Heterogeneity in individually experienced temperatures (IETs) within an urban neighborhood : insights from a new approach to measuring heat exposure. Int J Biometeorol. 2015;59(10):1363–1372. doi:10.1007/s00484-014-0946-x.
- Ioannou LG, Mantzios K, Tsoutsoubi L, et al. Indicators to assess physiological heat strain–Part 1: Systematic review. Temperature. 2022; 9(3) :227–262. doi:10.1080/23328940.2022.2037376.
- Ioannou LG, Tsoutsoubi L, Mantzios K, et al. Indicators to assess physiological heat strain–Part 3: Multi-country field evaluation and consensus recommendations. Temperature. 2022;9(3) :274–291. doi:10.1080/23328940.2022.2044739.
- Dufour A, Candas V. Ageing and thermal responses during passive heat exposure: sweating and sensory aspects. Eur J Appl Physiol. 2007;100(1):19–26. doi:10.1007/s00421-007-0396-9.
- Inoue Y, Nakao M, Araki T, et al. Regional differences in the sweating responses of older and younger men. J Appl Physiol. 1991;71(6):2453–2459. doi:10.1152/jappl.1991.71.6.2453.
- Solís P, Vanos JK, Forbis RE. The decision-making/accountability spatial incongruence problem for research linking environmental science and policy. Geogr Rev. 2017;107(4):680–704. doi:10.1111/gere.12240.
- Hass AL, McCanless K, Cooper W, et al. Heat exposure misclassification : do current methods of classifying diurnal range in individually experienced temperatures and heat indices accurately reflect personal exposure ? Int J Biometeorol. 2022;66(7):1339–1348. doi:10.1007/s00484-022-02280-8.
- Ioannou LG, Mantzios K, Tsoutsoubi L, et al. Effect of a simulated heat wave on physiological strain and labour productivity. Int J Environ Res Public Health. 2021;18(6):3011. doi:10.3390/ijerph18063011.
- González-alonso J, Crandall CG, Johnson JM. The cardiovascular challenge of exercising in the heat. J Physiol. 2008;586(1):45–53. doi:10.1113/jphysiol.2007.142158.
- Périard JD, Racinais S, Sawka MN. Adaptations and mechanisms of human heat acclimation: applications for competitive athletes and sports. Scand J Med Sci Sports. 2015;25(S1):20–38. doi:10.1111/sms.12408.
- Sugg MM, Runkle JD, Dow K , et al. Individually experienced heat index in a coastal Southeastern US city among an occupationally exposed population. Int J Biometeorol. 2022;66(8):1665–1681. doi:10.1007/s00484-022-02309-y.
- Hass AL, Ellis KN. Using wearable sensors to assess how a heatwave affects individual heat exposure, perceptions, and adaption methods. Int J Biometeorol. 2019;63(12):1585–1595. doi:10.1007/s00484-019-01770-6.
- Sugg MM, Fuhrmann CM, Runkle JD. Temporal and spatial variation in personal ambient temperatures for outdoor working populations in the southeastern USA. Int J Biometeorol. 2018;62(8):1521–1534. doi:10.1007/s00484-018-1553-z.
- Ioannou LG, Tsoutsoubi L, Mantzios K, et al. The impacts of sun exposure on worker physiology and cognition: multi-country evidence and interventions. Int J Environ Res Public Health. 2021;18(14):7698. doi:10.3390/ijerph18147698.
- Sulzer M, Christen A, Matzarakis A. A low-cost sensor network for real-time thermal stress monitoring and communication in occupational contexts. Sensors. 2022;22(5):1828. Published online 2022. doi:10.3390/s22051828.
- Hwang S, Lee SH. Wristband-type wearable health devices to measure construction workers’ physical demands. Autom Constr. 2017;83(June):330–340. doi:10.1016/j.autcon.2017.06.003.
- Campbell M, Marek L, Hobbs M. Reconsidering movement and exposure: towards a more dynamic health geography. Geogr Compass. 2021;15(6):e12566. doi:10.1111/gec3.12566.
- Winslow C-EA, Herrington LP, Gagge AP. Physiological reactions of the human body to varying environmental temperatures. Am J Physiol Content. 1937;120(1):1–22. doi:10.1152/ajplegacy.1937.120.1.1.
- Morris NB, Chaseling GK, English T, et al. Electric fan use for cooling during hot weather: a biophysical modelling study. Lancet Planet Heal. 2021;5(6):e368–e377. doi:10.1016/S2542-5196(21)00136-4.
- Drinkwater BL, Bedi JF, Loucks AB, et al. Sweating sensitivity and capacity of women in relation to age. J Appl Physiol. 1982;53(3):671–676. doi:10.1152/jappl.1982.53.3.671.
- Wilcox S, Marion W. Users Manual for TMY3 Data Sets. NREL/TP-581-43156. NREL. 2008.
- Middel A, Krayenhoff ES. Micrometeorological determinants of pedestrian thermal exposure during record-breaking heat in Tempe, Arizona: introducing the MaRTy observational platform. Sci Total Environ. 2019;687:137–151. doi:10.1016/j.scitotenv.2019.06.085.
- NWS. NWS Phoenix Heat Page. Historical heat warning dates. Published 2022. Cited 2022 Oct 5. https://www.weather.gov/psr/heat
- Fiala D, Havenith G, Bröde P, et al. UTCI-Fiala multi-node model of human heat transfer and temperature regulation. Int J Biometeorol. 2012;56(3):429–441. doi:10.1007/s00484-011-0424-7.
- ISO. ISO 7933:2004 ergonomics of the thermal environment - analytical determination and interpretation of heat stress using calculation of the predicted heat strain.2nd. Geneva: International Organization for Standardization.2004. pp. 34.
- Ainsworth BE, Haskell WL, Herrmann SD, et al. 2011 compendium of physical activities: a second update of codes and MET values. Med Sci Sports Exerc. 2011;43(8):1575–1581 doi:10.1249/MSS.0b013e31821ece12.
- Brotherhood JR. Heat stress and strain in exercise and sport. J Sci Med Sport. 2008;11(1):6–19. doi:10.1016/j.jsams.2007.08.017.
- Cramer MN, Jay O. Biophysical aspects of human thermoregulation during heat stress. Auton Neurosci Basic Clin. 2016;196:3–13. doi:10.1249/MSS.0b013e31821ece12.
- Havenith G, Fiala D. Thermal indices and thermophysiological modeling for heat stress. Compr Physiol. 2016;6(1):255–302. doi:10.1002/cphy.c140051.
- Flouris AD, Schlader ZJ. Human behavioral thermoregulation during exercise in the heat. Scand J Med Sci Sports. 2015;25(S1):52–64. doi:10.1111/sms.12349.
- Hosokawa Y, Adams WM, Casa DJ, et al. Roundtable on preseason heat safety in secondary school athletics: environmental monitoring during activities in the heat. J Athl Train. 2021;56(4):362–371. doi:10.4085/1062-6050-0067.20.
- McGregor GR, Vanos JK. Heat: a primer for public health researchers. Public Health. 2018;161:138–146. doi:10.1016/j.puhe.2017.11.005.
- Middel A, AlkhaLed S, Schneider FA, et al. 50 Grades of Shade. Bull Am Meteorol Soc. 2021;102(9) :E1805–E1820. doi:10.1175/BAMS-D-20-0193.1.
- Middel A, Selover N, Hagen B, et al. Impact of shade on outdoor thermal comfort—a seasonal field study in Tempe, Arizona. Int J Biometeorol. 2016;60(12):1849–1861. doi:10.1007/s00484-016-1172-5.
- Tsunematsu N, Yokoyama H, Honjo T, et al. Relationship between land use variations and spatiotemporal changes in amounts of thermal infrared energy emitted from urban surfaces in downtown Tokyo on hot summer days. Urban Clim. 2016;17 September 2016 :67–79. doi:10.1016/j.uclim.2016.03.002.
- Brown RD, Gillespie TJ. Microclimate landscape design: creating thermal comfort and energy efficiency. New York: John Wiley & Sons; 1995.
- Lachapelle JA, Krayenhoff ES, Middel A, et al. Landscape and Urban Planning Maximizing the pedestrian radiative cooling benefit per street tree. Landsc Urban Plan. 2023;230(June 2022):104608. doi:10.1016/j.landurbplan.2022.104608.
- Vecellio DJ, Wolf ST, Cottle RM, et al. Evaluating the 35°C wet-bulb temperature adaptability threshold for young, healthy subjects (PSU HEAT Project). J Appl Physiol. 2022;132(2):340–345. doi:10.1152/japplphysiol.00738.2021.
- Vargas NT, Chapman CL, Ji W, et al. Increased skin wetness independently augments cool-seeking behaviour during passive heat stress. J Physiol. 2020;598(13):2775–2790. doi:10.1113/JP279537.
- Green H, Bailey J, Schwarz L, et al. Impact of heat on mortality and morbidity in low and middle income countries: a review of the epidemiological evidence and considerations for future research. Environ Res. 2019;171(September 2018):80–91. doi:10.1016/j.envres.2019.01.010.
- Morris NB, English T, Hospers L, et al. The effects of electric fan use under differing resting heat index conditions: a clinical trial. Ann Intern Med. 2019;171(9):675–677. doi:10.7326/M19-0512.
- Nazarian N, Krayenhoff ES, Bechtel B, et al. Integrated assessment of urban overheating impacts on human life. Earth’s Future. 2022(10):8. ISSN:. doi:10.1029/2022EF002682. https://agupubs.onlinelibrary.wiley.com/doi/abs/10.1029/2022EF002682
- Krayenhoff ES, Broadbent AM, Zhao L, et al. Cooling hot cities: a systematic and critical review of the numerical modelling literature. Environ Res Lett. 2021;16(5):053007. doi:10.1088/1748-9326/abdcf1.
- Haraway D. Situated knowledges: the science question in feminism and the privilege of partial perspective. Feminist Studies. 1988;14(3):575–599. doi:10.2307/3178066.
- Harding SG. The feminist standpoint theory reader: intellectual and political controversies. New York: Routledge; 2004.
- Piil JF, Christiansen L, Morris NB, et al. Direct exposure of the head to solar heat radiation impairs motor-cognitive performance. Sci Rep. 2020;10(1):7812. doi:10.1038/s41598-020-64768-w.
- Minor K, Bjerre-Nielsen A, Jonasdottir SS, et al. Rising temperatures erode human sleep globally. One Earth. 2022;5(5):534–549. doi:10.1016/j.oneear.2022.04.008.