
 ?Mathematical formulae have been encoded as MathML and are displayed in this HTML version using MathJax in order to improve their display. Uncheck the box to turn MathJax off. This feature requires Javascript. Click on a formula to zoom.
ABSTRACT
This article shows a system performing re-identification and description of people entering different stores of the same franchise by means of Face Recognition, Gait Analysis, and Soft Biometrics techniques. Additionally, an anomaly detection analysis is conducted to identify suspicious behavioral patterns.It has been tested on an ad-hoc dataset of a set of pawn shops of a local franchise.The registered users paths have been human labelled as ‘normal’ or ‘abnormal’ achieving a precision of 100%, recall of 72.72%, and an average accuracy of 96.39%.The system is able to report anomalies to support decisions in a context of a security monitoring system..
1. Introduction
Crimes committed in pawn shops have become common practice. The most well-known crimes can be acts of vandalism, theft, money laundering or of a mafia nature. For instance, in 2013 the Italian authorities blocked about 4100 kg of gold and 11,000 kg of silver directed to Switzerland to be melted [Citation1].
Most of these crimes are perpetrated through acts of violence, threats, and swagger. With a computer vision system, it is possible to detect these actions by analysing the facial features, gait, and soft biometric features and identify abnormal behaviours.
The implemented system works through an unsupervised approach. For this reason, the system will also return a series of anomalies that are not necessarily attributable to criminal actions such as runs or falls.
For this purpose, a system has been developed that carries out a preliminary re-identification of people before anomaly detection. The reason for this re-identification is because criminals are often re-identified in the place before they commit their criminal deeds.
The solution described in this work proposes a video surveillance system whose visual data are analysed by means of computer vision techniques aimed to spot anomalous activities. The system is designed to process the images of video surveillance cameras registered at different stores. People re-identification is performed to recognise the same individual within the same shop, as well as in the different shops, moreover, anomalies are detected. In most cases anomalies are based on unusual movements based on gait trajectories and facial expression, examples are accidents, thefts, falls, races, violence, panic or people who are standing still for a long time.
Biometric features are extracted from Multi-Task Cascaded Convolutional Network (MTCNN) in order to perform face detection, VGG Face is used to extract face features and ResNet-34 to extract soft biometrics features such as age, sex, and ethnicity. For gait recognition and analysis, OpenPose [Citation2] is used to extract joint coordinates of human body parts, thus allowing to measure several additional spatio-temporal features.
For the re-identification task, two different clustering algorithms are tested on the previously extracted features, namely DBSCAN and K-Means. Once the clustering is completed, those features belonging to the people that were reidentified multiple times were analysed in order to detect anomalous behavioural patterns. The anomaly detection algorithm used for the purpose is the Ensemble Consensus [Citation3]. This algorithm binds the power of three different categories of unsupervised anomaly detection methodologies, such as density-based, distance based and soft computing, using, respectively, Elliptic Envelope, Local Outlier Factor and Isolation Forest and then performing weighted consensus voting. Therefore, the contributions of this work are:
The combined use of different biometric features (Face, Gait, Soft Biometrics) for anomaly detection of unusual movements based on trajectory and altered moods
Use of a Re-Identification phase to filter the people on which to perform the anomaly detection.
Proposition and application of the Ensemble Consensus algorithm to combine three different anomaly detection approaches in a real scenario
Test and validation of the developed system on an ad hoc dataset
The work is organised as follows. Section 2 reports related works and state-of-the-art analysis, section 3 sketches methodologies and developed techniques, section 4 presents the experimental design. Section 5 presents a discussion of the obtained results, while conclusions and future remarks are provided in section 6.
2. Related Works
The use of multiple biometric features is used to address the problem of person reidentification in order to compensate failures during the re-identification based on a single biometric trait.
In this section, the literature review is presented on feature extraction techniques of both biometric features and anomaly detection.
2.1. Face
Face detection is a special case of object class detection. It is possible to classify the Face Detection methods in different categories, depending on the used approach such as the Knowledge-based methods, Feature invariant techniques, Template matching methods, Appearance-based methods, Colour-based methods, the AdaBoost face detector (Viola & Jones [Citation4]), or Video-based approaches. Particularly, among the most used techniques, the following can be considered: DCNN (Deep Convolutional Neural Network) [Citation5], MTCNN (Multi-Task Cascaded Convolutional Network), AdaBoost, which is used with the Haar features [Citation6] and Local Binary Pattern (LBP) or HOG (Histogram of Oriented Gradients).
The Face Recognition or Face Extraction phase is aimed to extract face features and identify or verify the identity of a subject. There are approaches based on the representation of the face, holistic, statistical, model-based, Feature-based, hybrid or Gabor wavelets approaches, face descriptor-based, 3D-based facial recognition, and video-based facial recognition methods. In particular, among the most used, the following can be considered: CNN (Convolutional Neural Network) like vggface, and Deep Learning techniques like FaceNet or DeepFace [Citation7,Citation8].
2.2. Gait
The acquisition of the human gait is done by employing a series of sensors. it is possible to classify these sensors into the 4 main categories:
Wearable sensors: it is possible to use the accelerometer to measure the acceleration of the body, the gyroscope to measure the angular velocity and therefore the position of the body, magneto resistive sensors to identify the orientation of the body in space, or inertial sensors capable of measuring velocity, acceleration, orientation and gravity forces;
Floor sensors: sensors installed on the floor creating a matrix of pressure sensors. The matrix is able to measure the pressure of each part of the foot separately.
Optical Motion Capture: system of six (usually) infrared cameras that trace markers applied to the person’s body. The markers are used to extrapolate the kinematic features from the joints of the body.
Cameras for video capture: one or multiple cameras to capture images of the person’s body. Computer vision techniques are then applied to the images to extract the body silhouette [Citation9].
In [Citation10] a gait-based approach to human identification is proposed through similarity learning using deep convolutional neural networks (CNNs). With a rather small group of labelled multi-view human walking videos, it is possible to train the deep net to recognise the most discriminating changes in gait patterns that suggest human identity change. A broad empirical assessment is provided in terms of various scenarios, namely the cross-view and cross-walking condition, with different preprocessing approaches and network architectures. The method was tested on the CASIA-B, OU-ISIR and USF datasets. The results obtained indicate a great generalisation potential for this method in practical applications.
In [Citation11] a Siamese neural network-based gait recognition framework is presented to automatically extract robust and discriminating gait characteristics for human identification. Unlike the conventional deep neural networks, the Siamese network can use distance metric learning to drive the similarity metric so that it is small for pairs of paces of the same person and large for pairs of paces from different people. In particular, to further learn an effective model with limited training data, gait energy images were computed in place of the raw gait sequences.
The authors in [Citation12] propose an innovative approach to recognise the person using the openpose’s pose estimation key points and then evaluate the accuracy of recognition based on the number of visible joints indoors. The main advantage and reason for the proposed approach is that this method is a contactless method and does not require any interaction with the subject.
2.3. Soft Biometrics
The term Soft Biometric refers to a set of human characteristics. A common taxonomy considers four groups of attributes [Citation13]:
demographic attributes like age, gender, ethnicity, eye/hair colour, or skin colour
anthropometric attributes like body or facial geometry
medical attributes like medical conditions, BMI, wrinkles
behavioural or material attributes like hat, scarf bag, backpack, clothes, glasses, tattoos.
The authors in [Citation14] present a new soft biometrics-based individual profiling approach for typing dynamics. Typing dynamics is a behavioural biometric approach for recognising how a person types on a keyboard. The following soft traits are considered in their approach: the hand category (i.e. whether the user types with one or two hands), the gender category, the age category and the manual skill category. To this end, they built a new database on which to perform experiments. The results indicate that the proposed approach can be used to improve user authentication based on keystroke dynamics.
In [Citation15] the problem of re-identifying people using soft biometrics is addressed. The method works on RGB-D data (colour point clouds) to determine the best match between a database of possible users. For each test subject, skeletal information in three dimensions is used to regularise the pose and create a standard skeletal posture (SSP). A partition grid, whose size depends on the SSP, clusters the point cloud samples according to their position. Each group is then studied to build the person’s signature. The same grid is then used for the other subjects in the database to keep information on any differences in shape between users. The effectiveness of this new method was tested on three public data sets demonstrating an improvement in people re-identification compared to the current state of the art.
2.4. Anomaly Detection
Anomaly Detection is an analysis aimed at identifying certain anomalies within a dataset. These anomalies are also/usually called outliers, noise, anomalies, exceptions, errors, defects, hazards, surprises, novelties, or peculiarities depending on their application domain [Citation16]. The labelled training dataset is one such piece of information that can be used with machine learning techniques and statistical learning theory.
Depending on the approaches used in outlier detection, the methodologies can be broadly classified as:
Distance-based,
Density-based,
Machine learning or soft-computing based.
Distance-based methods calculate distances between objects in the data with a clear geometric interpretation. Distance-based outliers are data points that are located away from most of the points using a geometric distance measure following a fixed or modifiable threshold relative to the domain of interest.
High-dimensional data is always sparse relative to some dimension or attribute. Because of data sparsity, distance-based approaches usually do not work well in situations where the actual distance values are similar for many pairs of points.
Density-based methods estimate the density distribution of the input space and then identify outliers such as those found in regions of low density [Citation17]. Density-based anomaly detection techniques estimate the density of the neighbourhood of each data instance. An instance that is in a low-density neighbourhood is declared anomalous, while an instance that is in a dense neighbourhood is declared normal. In addition, density-based techniques belong to the parameter-based approaches, so performance depends largely on parameter selection.
Soft-computing based methods are used in classification systems where the knowledge of the system is limited. In any classification task, the goal is to minimise the cross entropy loss for instances belonging to the same class. These indistinguishable objects can be viewed as basic building blocks (concepts) used to construct a knowledge base about the real world. This type of uncertainty is referred to as approximate uncertainty. Approximate uncertainty is formulated in terms of approximate sets.
Considering supervised approaches, there are several approaches, such as statistical methods, those based on decision trees such as C4.5 [Citation18], proximity-based, kernel-based such as the well-known KPCA(Kernel Principal Component Analysis) and LS-SVM [Citation19], distance-based algorithm such as RELOADED [Citation20] and VAHD (Variable-length Average Hamming Distance) [Citation21] and density-based as LOF (Local Outlier Factor) [Citation22].
Also for unsupervised approaches there are several methods, such as statistical methods like the SmartSifter method (SS), methods based on graph theory that use a tree classification algorithm such as the Random Forest algorithm, among the most widely used in the literature [Citation23], or Isolation Forest, and finally clustering methods such as LDBSCAN (Local-Density-Based Spatial Clustering Algorithm with Noise).
3. Materials and Methods
depicts the overall model of the proposed system. Feature extraction is a crucial step to obtain three different descriptors: face features, gait features and soft biometrics. Clustering techniques were used to group features of the same person within the same video and over the set of available videos. Anomaly Detection is used to identify anomalies among the occurrences of re-identified people.
Figure 1. Overall model of the system.
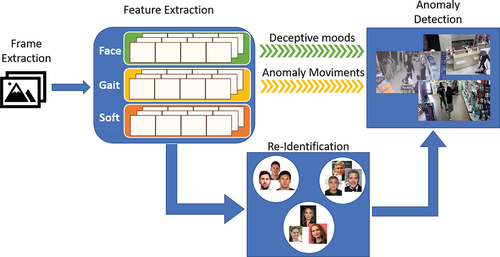
The systems consists of four phases:
Frame extraction from videos
Feature Extraction
Re-Identification
Anomaly Detection
For each video input, the system extracts the frames, subsequently for each extracted frame the feature extraction phase is performed, extracting the face, soft and gait features.
With the extracted features, the user re-identification phase is performed. The re-identification was done to filter the people on whom to perform the anomaly detection. The reason for this choice is due to the fact that possible thieves or the like could show up several times in the shop before carrying out the crime.
Finally, with the extracted features of the re-identified people and with the addition of space-time features such as indications of place and time, the anomaly detection phase is performed.
3.1. Feature Extraction
Face Detection is performed frame-by-frame adopting a Multi-Task Cascaded Convolutional Neural Network (MTCNN) [Citation24]. It consists of three main phases of convolutional networks, which can both recognise faces and recognise face landmarks such as eyes, nose and mouth. The MTCNN is divided into three main phases, a first one called Proposal Network (P-Net) in which a shallow CNN is used to produce the windows, a second one called Refine Network (R-Net) in which a more complex CNN is used to refine the results, and finally, a third one called Output Network (O-Net) in which an even more complex CNN is used to further refine the results and return the locations of the face landmarks under analysis. Successively, VGG-Face algorithm is adopted to derive face features. VGG-Face is a pre-trained model on sub-spatial learning for face recognition. The VGG-Face architecture is trained on the recognition of 2622 subjects out of approximately 2,600,000 training samples. The architecture requires the face image to be of a fixed size of 224 × 224 pixels [Citation25]. The architecture consists of 11 blocks, where each of them, contains a linear transformation followed by a subsequent nonlinear operation, as Rectification Layer (ReLu) [Citation26] and Max Pooling. Of the 11 total blocks, the first 8 are convolutional layers, in which the linear transformation is a series of linear filters (or convolutional filters). The last 3 blocks, however, are fully connected layers, which are identical to the previous convolutional layers, with the only difference being the size of the filters. Indeed, it is the same as the size of the input data, so that each filter can encode the information of the complete image. Next, all convolutional layers are followed by a ReLu operation. Of the 3 fully connected layers, the first two layers return an output of size 4096, while the last layer has an output of size 2662 or 1024 depending on the loss function used [Citation27].
Thus, the results obtained are vectors of descriptors of the faces identified in the input faces.
Concerning the soft-biometric features, ResNet34 has been adopted. It consists of one convolution and pooling step followed by four layers of similar behaviour. Each of the layers follows the same pattern. They perform 3 × 3 convolution with a fixed feature map dimension, respectively, bypassing the input every two convolutions. Furthermore, the width and height dimensions remain constant during the entire layer.
The model distinguishes two classes for gender (Male and Female), seven classes for ethnicity (White, Black, Latino-Hispanic, East Asian, Southeast Asia, Indian, Middle Eastern) and nine age classes (0–2, 3–9, 10–19, 20–29, 30–39, 40–49, 50–59, 60–69, 70+). For each input face we obtain the three identified classes of soft biometric parameters. Classes were one-hot encoded and stacked horizontally in the final outputting vector.
Gait analysis starts extracting the joints of people’s bodies by means of pose estimation algorithms such as OpenPose [Citation28]. It is able to detect 25 different parts of the body, but for purposes of this work, only 15 main joints were selected: nose, neck, shoulders, elbows, wrists, hips, knees and ankles, which are the most important for this task. Moreover, apart from the nose and neck, the remaining joints were acquired for the right and left parts of the body, respectively.
The joints are then used to calculate the following spatio-temporal features: displacement, speed, acceleration and tangent angle. For the first three, both the X and Y coordinates have been calculated and then the resulting one. Being spatial-temporal features, they are time-dependent, so for each frame they are calculated by comparing the joint detected on the next frame with the corresponding one of the current frame. The calculatedfeatures are shown in .
Table 1. Features calculated for Gait Analysis.
3.2. Re-Identification Module
People’s re-identification is an unsupervised problem. For this reason, clustering techniques have been adopted upon face, soft and gait features to re-identify users. To the aim, two clustering techniques have been proven: DBSCAN and K-Means.
Density-Based Spatial Clustering of Algorithm with Noise (DBSCAN) [Citation29] is a basic algorithm for density-based clustering. Density-based clustering refers to unsupervised learning methods that identify distinctive groups/clusters in the data, based on the idea that a cluster in the data space is a contiguous region of high point density, separated from other similar clusters by contiguous regions of low point density. DBSCAN can detect clusters of different shapes and sizes from a large amount of data, which contain noise and outliers. The DBSCAN algorithm uses two main parameters:
the minimum number of points (a threshold) clustered together for a region to be considered dense. For the experimental phases the parameter has been set to 2.
a distance measure that will be used to find points in the neighbourhood of any point. For the experimental phases the distance measure used is the distance of the cosine.
The choice to use DBSCAN is mainly due to its advantages for the specific topic of this work, such as the possibility of not specifying the number of clusters (users) in real contexts.
The K-means algorithm allows a set of objects to be divided into k groups based on their attributes. It is assumed that the attributes of the objects can be represented as vectors, and thus creating a vector space. The goal of the algorithm is to minimise the total intra-group variance; each group is identified by a centroid or midpoint. K-Means was chosen because of its notoriety in the speed of convergence and in terms of quality of results, but unlike DBSCAN it requires the number of clusters a priori. For the experimental phases the parameter has been set to 25. Of course, this is a limitation in real cases but, in general, a multiclass clustering problem can be coped as a set of binary clustering problems. However, its use within this context is principally for performance comparison aims.
The choice of clustering algorithms fell on DBSCAN and K-Means because the first is able to automatically infer the number of people (clusters), while the second requires additional analysis tools such as elbow curves and silhouette plot for the analysis of bias and subsequent choice of the number of users. Thus, it was important to measure the accuracy impact of using an automated tool such as DBSCAN without the a-priori knowledge of the number of people (the clusters) to reidentify with respect to the K-Means where the number of clusters is set initially as a parameter.
Both algorithms are able to return, ideally, a cluster referred to a specific user whether if he/she appears in a single video or whether he/she appears in several videos related to different acquisitions even in different shops. In other words, the approach groups frames containing a specific identity within a video (from his/her arrival to the departure) as well as in other videos (different visit event). In fact, the timestamps are an additional feature, so that if the same person is re-identified over time (outside a specific video session), an additional feature representing this event is computed. At this stage, the number of occurrences is reported along with the mean interleaving time interval. The analysis of timestamps is also able to reveal co-occurrences of users and intra-users correlations. In this work, the comparison is made through the similarity of the cosine.
To re-identify the users, the test users are then compared with those identified by the clustering phase. The metric used is the distance of the cosine with a threshold value of 0.30.
3.3. Anomaly Detection Module
Anomaly Detection (or Outlier Detection) has been performed to identify anomalous behaviours. The adopted anomaly detection techniques take as an input the set of features previously extracted of the re-identified people as well as additional information related to time and camera id.
Outliers are defined as observations that are distant from the others. Outlier Detection then attempts to fit the regions where the data are most concentrated, while ignoring deviant observations. In the context of outlier detection, outliers cannot form a dense cluster because the available estimators assume that outliers are located in regions of low density.
Based on the fact that the system voluntarily does not assume any behaviour as a priori anomalous, Ensemble Consensus algorithms have been considered. In these algorithms three techniques are fused together, by means of weighted score, in order to get a solid decision creating an ensemble of outlier detectors. These techniques are Local Outlier Factor (LOF), Elliptic Envelope (EE), and Isolation Forest (IF).
The Local Outlier Factor (LOF) algorithm calculates a LOF score that measures the deviation of the local density of a given data point from its neighbours. Then the LOF algorithm will attempt to detect samples that have substantially lower density than their neighbours (the local density is obtained from the k-nearest neighbours).
The LOF score of an observation is equal-to-the ratio of the average local density of its k-nearest neighbours to its local density. The assumption is that abnormal data should have a much smaller local density.
The strength of the LOF algorithm is that it takes into account both local and global properties of the datasets: it can work well even in datasets where the abnormal samples have different underlying densities.
The Elliptic Envelope has as an assumption that the data is Gaussian and that an ellipse is learned. The model tries to capture correlations between the data, so it can skew the Gaussian along any line x1 = x2 and thus assume an ellipsoidal shape. The presence of outliers in X can cause a huge bias in the fitted Gaussian, but a more robust estimate can be obtained by changing the contamination of the parameters. Elliptic Envelope will then determine which points to discard in order to fit the ellipsoid with the smallest volume.
The Isolation Forest explicitly identifies outliers. Isolation Forest, like any tree ensemble method, is built on the basis of decision trees (analogous to Random Forest). Partitions are created by first randomly selecting a feature and then selecting a random split value between the minimum and maximum value of the selected feature. At the beginning, outliers are less frequent than regular observations and are different from them in terms of values (they lie further away from regular observations in feature space).
Anomaly detection is performed on the features of the re-identified people. The feature vector is composed by face feature vector of size 2622, the gait features matrix of size 10 × 14 (10 space-time features for 14 joints), the soft biometric features vector of size 3, and the addition of two further fields representing the camera id and the timestamp. A one hot encoder was then carried out on the features and subsequently these were analysed by an ensemble of the previously described algorithms of Anomaly Detection (LOF, EE, IF) to identify possible suspicious behaviours. In particular, each of the three techniques evaluates the entries as anomalous with a value in the range [−1, 1]. If the average of the evaluations reported by the three techniques is under a threshold, then the tuple is considered anomalous otherwise it is considered non-anomalous.
4. Experiments and Results
Four total experiments were conducted, the first three are carried out to validate the feature extraction techniques and the fourth for the overall system.
4.1. Face Recognition
The ChokePoint dataset [Citation30,Citation31] was used for the test of the person re-identification module just based on faces. The P1E subset was used. This experimental phase was performed to validate the feature extraction technique for re-identification.
The P1E dataset has been divided into Training and Test, the first three sessions of each user have been used for the training and the last session for the test, for a total of 6437 images for the training and 2171 for the test. The experimentation was carried out by performing the feature extraction through Face Recognition to the images of the training. The extracted features were grouped through a clustering step. K-Means is the clustering algorithm used for Face Recognition experimentation.
The features extracted from the test images are compared with those present in clusters by the similarity of the cosine.
shows the results obtained (in terms of EER) compared with another works on the ChokePoint dataset.
Table 2. Result Face Recognition with ChokePoint dataset.
4.2. Gait Recognition
The experimentations of the Gait Recognition are identical to those made in the Face Recognition, with just the change of the type of extracted features. Also, in this case the ChokePoint dataset has been used and divided in Training and Test, precisely using the first three sessions of each user for the training and the last session for the test, for a total of 6437 images for the training and 2171 for the test.
Also in this case, an experimental phase was performed to validate the feature extraction technique for re-identification. Through the features of the gait, it is possible to detect a series of anomalous movements based on trajectories, such as falls, skids, overbearing ways of walking as well as running or parking for a long time, or violent actions and thefts.
The experimentation was carried out by performing the feature extraction with Gait Recognition at the images of the training. The extracted features were fed into a clustering algorithm. DBSCAN is the clustering algorithm used for the Gait Recognition experimentation.
The features extracted from the test images are compared with those present in clusters. By using the cosine similarity, if their score exceeds a set threshold value then they are considered re-identified.
shows the results obtained by our system compared with another work tested on the same ChokePoint dataset.
Table 3. Result reidentification with Gait Recognition at ChokePoint dataset.
The results obtained from our experiments are less performant than those of the comparable works. Both comparison works use Deep Neural Network techniques.
It is possible to assert that Deep Neural Network techniques, when trained and tested on the different split ratios of the same dataset, tend to overfit on particular details such as clothes and face/hairs and in particular the background [Citation32]. Thus, error rates could be misleading. The choice of the open pose technique with space-time features was pursued because of its generalisation power: since it is not based on image recognition, features learned to capture the majority of the information that is present during the motion. Because of this, the way a person moves, i.e. his/her behavioural biometric trait, could be discriminating regardless of the face, place and how the person is dressed.
4.3. Soft Biometric Recognition
For the experimentation of the Soft Biometric Recognition, FairFace [Citation33] dataset was used. The dataset was not split into training and testing since, in this case, the experimental phase was not performed to validate the feature extraction technique for re-identification, but for understanding the quality of the model in order to correctly evaluate the three soft traits: age, gender and ethnicity. The model was used to extract the classes related to the three soft biometric parameters.
Soft Biometrics Recognition algorithm was run on all the images in the dataset and the values of the three soft traits obtained were compared with the real ones.
In are shown the results obtained with Soft Biometric Recognition.
Table 4. Result Soft Biometric Recognition.
4.4. Overall System
Due to the lack of public datasets for the task of anomaly detection in the specific context of this work, an ad hoc dataset was created. The dataset includes a total of 102 videos each of which has the duration of an ordinary working session (all videos have been then divided into frames). In these videos several persons (actors) are recorded. Usual interactions include multiple shop visits, interaction with the shop assistant, requests of info, successful as well as not-concluded transactions, etc. Among the others, five people interpret behaviours that could be considered typically suspicious over a set of five stores.
Each simulated store is equipped with 2–3 cameras with 1920x1080dpi of resolution and 30 FPS.
Regarding the metrics of performance evaluations of the overall system, the confusion matrix was calculated along with Precision, Recall, Accuracy and F1-Score.
The results obtained from the overall system performance and runtime evaluation metrics are shown, respectively, in . All the results are related to a snapshot of the system using 69 videos for training and 33 for testing.
Table 5. Confusion matrix.
Table 6. Performance evaluation metrics.
Table 7. Lead time test phase.
The confusion matrix is shown in . The table shows the results obtained with the anomaly detection.
shows the evaluation parameters, namely Precision, Recall, F1-Score and Accuracy, obtained from the anomaly detection.
reports execution times of every single phase of the system obtained using a system running Windows 10 on Ryzen 9 3900X CPU, with 16 GB DDR4 RAM, 512 GB NVMe 4.0 SSD.
5. Discussion
This work reports a wise integration of techniques to perform people re-identification and anomaly detection based on face, gait and soft biometrics in the context of shops.
The face recognition module developed in this system is able to exhibit a very low EER value of 0.69% which is consistent with the state of the art on the ChokePoint dataset [Citation34,Citation35].
On the other hand, the results of re-identification by Gait Recognition are less accurate than those obtained by Face Recognition. They are less accurate than those reported as the state of the art results achieved by using body features, which in turn are less accurate than Face Recognition systems [Citation34,Citation35]. It should be highlighted that the employed dataset (ChokePoint) consists of images that usually exhibit only a part of the body of the subjects (the body of the person appears truncated). This fact leads to a loss of relevant information of the whole lower part of the body (pelvis, legs, knees, etc …), and negatively affects the performance of the whole system.
Due to the lack of a public dataset specifically made for anomaly detection in shops of the same franchise, it has been decided to build an ad hoc dataset and test the overall developed system at it.
Regarding the detection of anomalies, the ensemble of anomaly detection algorithms, when used in the context of a majority voting modality, allowed to correctly identify anomalies with high accuracies. It was indeed obtained an accuracy of 96.39% with the re-identification performed by DBSCAN as a clustering algorithm, and 96.17% with K-MEANS used as a clustering algorithm. Moreover, the data show that all the movements identified by the system as anomalous are actually anomalous: the precision of the system in this regard is 100% in both cases. On the other side, the ability to identify all the existing anomalies is slightly less performing: the recall value is 72.72% with DBSCAN and 71.92% with K-MEANS.
It is important to assert that the ensemble of anomaly detection algorithms played a major role at correctly identifying suspicious behaviours with a precision of 100% in a completely unsupervised learning context. A supervised learning modality would have probably end up with higher recalls and accuracies, but it would have suppressed its applicability in an unsupervised context as well as on its continuous learning capabilities.
As regards the performance of the system from the computational point of view, it is observed that some phases of the system, like almost all the test phases (frame extraction, gait extraction, soft biometrics extraction, Re-Identification and Anomaly Detection) second to analyse 1 second of video, while Face Extraction takes almost 3 seconds to analyse 1 second of video. All tests were performed on the CPU. Overall, the system took around 100 minutes to process around 30 minutes of video. This means that for every second of video, the full run-time analysis takes approximately 3.31 seconds for the aforementioned set of tests. In future works, the real estimate of the time taken between the occurrence of the anomaly and its detection will be evaluated.
It is important to observe that the overall lifetime would be drastically decreased if all processes using deep neural networks (deep learning) were run on GPUs. Indeed, authors in [Citation36] show that, with an Intel i7-960 CPU, face detection tasks took 409 ms per frame, while on an Nvidia GTX Titan Z GPU only 19 ms per frame, which is a 21x speedup.
A reduction in resolution and a down sampling with respect to the FPS of the videos would also decrease the time required to run the entire pipeline.
6. Conclusions
In this work an anomaly detection system performing face recognition, gait analysis and soft biometrics trait, has been developed with the aim of identifying suspicious events and behaviours happening inside retail shops of the same franchise. Each part of the system has been tested with their respective dataset and accuracies are consistent with the state of the art results. The wise integration of each part, joined together with clustering algorithms and an ensemble of anomaly detection algorithms, namely K-Means and DBSCAN for clustering and Elliptic Envelope, Isolation Forest and Local Outlier Factor for anomaly detection, allowed to reach satisfying results of about 96% of accuracy for the anomaly detection with unsupervised learning on a custom dataset.
This is a first attempt to cope with the problem of laundering actions by means of unsupervised learning ‘into the wild’. The proposed system has demonstrated to be dynamic enough to be applied in practical use cases without any a priori knowledge or any supervised training.
In future the system could be expanded to work with more sensors such as depth cameras and force platforms as well as with more biometric data, such as detecting the presence of tattoos, pigtails etc. From a functional point of view, it can be extended with a user interface that shows in real time if an anomaly event is happening and who is the subject behind it.
Acknowledgments
The scientific contents described in this paper are within the “REACTION- people Re-identification with fAce reCognition Techniques without Identity kNowledge” Project commissioned by Azzurro S.r.l.
Disclosure statement
No potential conflict of interest was reported by the author(s).
References
- Teichmann E FMJ, Falker MC. Money laundering – the gold method. J Money Laund Control. 2020;ahead-of-print(ahead–of–print). DOI: 10.1108/JMLC-07-2019-0060.
- Cao Z, Hidalgo G, and Simon E T, et al. OpenPose: realtime multi-person 2D pose estimation using part affinity fields Proceedings of the IEEE conference on computer vision and pattern recognition. 2018.
- Dentamaro V, Convertini VN, and Galantucci S, et al. Ensemble consensus: an unsupervised algorithm for anomaly detection in network security data, ITASEC, Italy. 2021 Italian Conference on Cybersecurity, 7-9 April, p. 309–318.
- Viola E P, and Jones M. Rapid object detection using a boosted cascade of simple features. Comput Vision Pattern Recognit. 2001;1:I–I .
- Liu W, Anguelov D, Erhan D, et al. Ssd: single shot multibox detector, European Conference on Computer Vision (ECCV); 2016, p. 21–37.
- Mita T, Kaneko E T, Hori O. Joint haar-like features for face detection, Proceedings of the Tenth IEEE International Conference on Computer Vision; 2005.
- Luttrell JB, Zhou Z, Zhang C, et al. Facial recognition via transfer learning: fine-tuning keras-vggface, Proceedings - 2017 International Conference on Computational Science and Computational Intelligence, CSCI; 2017, p. 576–579.
- Jiao Z, Qiao F, Yao N, et al. An ensemble of VGG networks for video-based facial expression recognition. 1st Asian Conference on Affective Computing and Intelligent Interaction, ACII Asia; 2018, 8470338, 2018.
- Muro-De-La-Herran A, Garcia-Zapirain E B, Mendez-Zorilla A. Gait analysis methods: an overview of wearable and non-wearable systems, highlighting clinical applications. Sensors. 2014;14(2):3362–3394.
- Wu Z, Huang Y, Wang L, et al. A comprehensive study on cross-view gait based human identification with deep CNNs. IEEE Trans Pattern Anal Mach Intell. 2017;39(2):209–226.
- Zhang C, Liu W, Ma E H, et al., «Siamese neural network based gait recognition for human identification,» ICASSP, IEEE International Conference on Acoustics, Speech and Signal Processing - Proceedings, p. 2832–2836, 2016.
- Badave E H, Kuber M. Evaluation of person recognition accuracy based on openpose parameters. Proceedings - 5th International Conference on Intelligent Computing and Control Systems, ICICCS; 2021;2021, p. 635–640.
- Datcheva A, Elia E P, and Ross A. What else does your biometric data reveal: a survey on soft biometrics. IEEE Trans Inf Forensics Secur. 2016. 11(3):441–467.
- Syed Idrus SZ, Cherrier, C E, Rosenberger C P. Bours. soft biometrics for keystroke dynamics: profiling individuals while typing passwords. Comput Secur. 2014;45:147–155.
- Patruno C, Marani R, Cicirelli G, E. Stella, T. D’Orazio. People re-identification using skeleton standard posture and color descriptors from RGB-D data. Pattern Recogn. 2019;89:77–90.
- Gogoi P, Bhattacharyya DK, Borah E B, et al. A survey of outlier detection methods in network anomaly identification. Comp J. 2011;54(4):570–588.
- Koufakou E A, Georgiopoulos M. A fast outlier detection strategy for distributed high-dimensional data sets with mixed attributes. Data Min Knowl Discov. 2010;20(20):259–289.
- Salzberg SL. «C4.5: programs for machine learning,». Mach. Learn. 1994;16(3):235–240.
- Suykens E JA, Vandewalle J. Least squares support vector machine classifiers. Neural Process Lett. 1999;9(3):293–300.
- Ghoting A, Otey E ME, Parthasarathy S. Loaded: link-based outlier and anomaly detection in evolving data sets. Proceedings of the 4th IEEE International Conference on Data, p. 387–390, 2004.
- Du Y, Zhang E R, and Guo Y. A useful anomaly intrusion detection method using variable-length patterns and average hamming distance. J Comput. 2010;5(8):1219–1226.
- Breunig MM, Kriegel HP, Ng E RT, et al. Lof: identifying density-based local outliers. ACM SIGMOD. 2000;29(2):93–104.
- Benali L, Notton G, Fouilloy A, et al. Solar radiation forecasting using artificial neural network and random forest methods: application to normal beam, horizontal diffuse and global components. Renewable Energy. 2019;132:871–884.
- Zhang K, Zhang Z, Li E Z, et al. Joint face detection and alignment using multi-task cascaded convolutional networks. ArXiv. 2016.
- Parkhi OM, Vedaldi E A, Zisserman A. Deep face recognition. Brit Mach Vision Conf. 2015;13: 1–12.
- Krizhevsky A, Sutskever E I, and Hinton GE. ImagineNet classification with deep convolutional neural networks. Adv Neural Inf Process Syst. 2012:25:1097–1105.
- Wan L, Liu N, Huo E H, et al. Face Recognition with Convolutional Neural Networks and subspace learning. 2nd International Conference on Image, Vision and Computing (ICIVC), p. 228–233, 2017.
- Cao Z, Simon T, Wei E SE, et al. Realtime multi-person 2d pose estimation using part affinity fields. Proceedings of the IEEE conference on computer vision and pattern recognition, p. 7291–7299, 2017.
- Ester M, Kriegel HP, and Sander E J, et al. A density-based algorithm for discovering clusters in large spatial databases with noise. KDD-96. 1996;96(34).
- ChokePoint Dataset. sourceforge. [Online]. [updated 27 April 2022]. Available from: http://arma.sourceforge.net/chokepoint/. [ Consultato il giorno].
- Wong Y, Chen S, Mau S, et al. Patch-based probabilistic image quality assessment for face selection and improved video-based face recognition. IEEE Biometrics Workshop, Computer Vision and Pattern Recognition (CVPR) Workshops, p. 81–88, 2011.
- Choi J, Gao C, Messou E JCE, et al. Why can’t i dance in the mall? Learning to mitigate scene bias in action recognition. 33rd Conference on Neural Information Processing Systems (NeurIPS 2019), Vancouver, Canada., 2019.
- Karkkainen E K, and Joo J. FairFace: face attribute dataset for balanced race, gender, and age. Arxiv Pre Prints. 2021.
- Koo JH, Cho SW, Beak NR, et al. CNN-based multimodal human recognition in surveillance environments. Sensors. 2018;18(9):3040.
- Koo JH, Cho SW, Beak E NR, et al. Face and body-based human recognition by GAN-based blur restoration. Sensors. 2020;20(18):5229.
- N. R AP, Alling ST. Face recognition: a tutorial on computational aspects. Emerging research surrounding power consumption and performance issues in utility computing, p. 405–425, 2016.