
Abstract
Purpose: The goal of this investigation was to characterize the compliance properties in selected polymers used for temporary (provisional crown and bridge) applications.
Method: Polymethyl methacrylate (PMMA)- and polyethyl methacrylate (PEMA)-based JET and TRIM II were investigated along with two bisacryl composite resins (LUXATEMP and PROTEMP 3 GARANT). Rectangular samples of the resins were subjected to creep–recovery tests in a dynamic mechanical analyzer at and near the oral temperature (27 °C, 37 °C and 47 °C). The instantaneous (elastic), and time-dependent viscoelastic, and viscoplastic compliance profiles of the materials were determined and analyzed as a function of materials and temperature.
Results: Highly significant (p = 0.0001) differences among means of elastic, viscoelastic and viscoplastic compliance values were found as a function of materials. TRIM II showed an order of magnitude higher viscoplastic deformation than the other three materials (LUXATEMP, PROTEMP 3 GARANT and JET).
Conclusions: The results indicate that PEMA is susceptible to significantly greater elastic, viscoelastic, and more importantly to viscoplastic compliant behavior compared with bisacryl composite and PMMA provisional crown and bridge materials. This indicates high-dimensional instability and poor stiffness and resiliency in PEMA appliances vis-à-vis those of PMMA and bisacryl composites.
1. Introduction
A provisional prosthesis is used as an interim restoration in clinical dental practice before a permanent prosthesis is placed. Typically, the use of these appliances is limited to several weeks. However, there are many situations, such as in implant dentistry, where the temporary prosthesis may function for substantially longer waiting period before the permanent prosthesis is placed. In addition, the prosthesis in high stress sites and long pontic segments can throw up additional challenges even for short-term use. For this reason, the medium- to longer- term environmental, chemical, mechanical and esthetic stability of the prosthesis in the oral environment becomes an important consideration. The properties of provisional materials for crown and bridge application have been investigated by several authors. Some of these investigations covered selected mechanical properties.[Citation1–14] Others have studied monomer conversion,[Citation15] microstructures,[Citation16] marginal adaptation,[Citation17], color stability,[Citation17,Citation18] surface roughness [Citation19], etc. Although these mechanical, esthetic and other properties are extremely important, the clinical performance of provisional materials also depends on their dimensional and functional durability under stress during mastication. A recent study has shown that these materials may undergo significant time-dependent deformation under stress.[Citation20] Dimensional stability of polymeric materials is critically important in clinical function and can be studied through static and dynamic deformation response during stress application. Creep and stress relaxation are two important time-dependent properties under static loading. The stress relaxation behavior in temporization materials was previously reported.[Citation21] This study is focused on the elastic, viscoelastic and viscoplastic deformation behavior of selected provisional materials during creep–recovery tests. Creep is the time-dependent change in strain under constant stress, and creep experiments typically measure dimensional change as a function of time at a pre-selected stress. The deformation at each time point is expressed by a parameter called compliance (J) by estimating the ratio of strain at any given time {i.e. ɛ(t)} to the initial and constant stress (σo) applied during the period of creep measurement, i.e. Compliance J(t)= ɛ(t)/σo. Compliance has units of (M2/N), i.e. strain resulting from application of unit stress over a time interval.
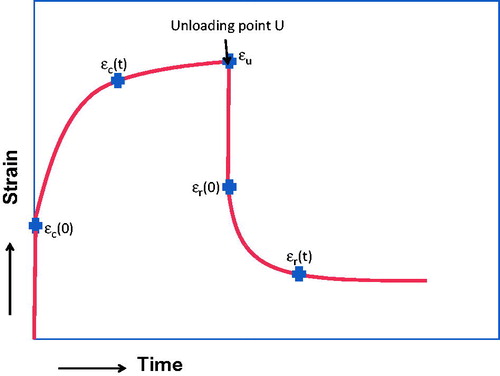
illustrates a typical strain versus time curve in a polymer creep–recovery experiment, and consists of an instantaneous strain {or elastic deformation, ɛc(0)} on loading and additional delayed time-dependent strain (creep deformation) during stress application. On unloading at point U, there is also an instantaneous recovery of elastic portion of the strain, and a subsequent partial delayed time-dependent recovery. However, a permanent residual strain (viscoplastic flow) typically remains after allowing the recovery to reach a steady state. The ratio of the instantaneous deformation {ɛc(0)} to the applied constant stress σo measures the elastic compliance, i.e. J(0) = ɛc(0)/σo. The elastic compliance is fully recoverable instantly on load removal. The measured overall or total compliance ɛc(t)/σo at any point in time of creep deformation is the sum of elastic compliance above and time-dependent compliance changes under constant stress at time t. However, time-dependent compliance is itself associated with two types of deformation, namely a recoverable (viscoelastic) and non-recoverable (viscoplastic) deformation during a stress application segment in a creep–recovery experiment. Time-dependent viscoelastic and viscoplastic contributions to overall deformation (i.e. creep) occur simultaneously during stress application over a selected time interval. A recovery segment after unloading helps to conveniently estimate the time-dependent recoverable and non-recoverable portions of creep deformation. These estimates can be used to define an empirical but practically useful separation of compliance to recoverable and non-recoverable compliance values corresponding to each time point. The experimental parameters used to separate the recoverable and non-recoverable compliance values from total measured deformation at each time point are also shown in . The total compliance at time t is given by
(1)
Figure 1. Typical strain profile in a creep–recovery test and calculation of different compliance contributions from the strain profile using the designated values defined in the figure: (a) elastic compliance (EC) = ɛc(0)/σo, (b) total compliance at time t = ɛc(t)/σo, (c) viscoelastic compliance (VECC)=total recovered compliance at time t − recovered elastic compliance = {ɛu−ɛr(t) − (ɛu−ɛr(0)}/σo= {ɛr(0) −ɛr(t)}/σo and (d) viscoplastic compliance (VPCC)= total compliance at time t in creep curve − total recovered compliance at time t in recovery curve= {ɛc(t) − (ɛu−ɛr(t)}/σo.
The first term within the curly brackets on the right is the total recovered compliance, which includes both elastic compliance (EC) given by (ɛc(0)/σo) and (time-dependent) recovered creep compliance {ɛrec(t)/σo} designated as viscoelastic creep compliance{VECC(t)} The total recovered compliance TRC(t) can be calculated from the difference between the strain at the time of unloading and the strain at time t in the recovery curve, i.e. {ɛu−ɛr(t)}/σo, where ɛu is the strain at the time of unloading and ɛr(t) is the strain in the recovery curve at time t. The recovered elastic compliance is obtained from the instantaneous recovery of strain after unloading, i.e. {ɛu−ɛr(0)}/σo. VECC(t) is the difference between TRC(t) and recovered elastic compliance above, i.e. [{ɛu−ɛr(t)} − {ɛu−ɛ(0)}]/σo or {ɛr(0)−ɛr(t)}/σo. The last term in EquationEquation (1)(1) ɛnrec(t)/ σo is the non-recoverable creep compliance at time t {designated as viscoplastic creep compliance VPCC(t)} and is given by the difference between the total compliance at time t and the total recovered compliance TRC(t) at time t, i.e. VPCC(t) = [ɛc(t) − {ɛu−ɛr(t)}]/σo.Thus, the total compliance {TC(t)}, the elastic compliance (EC), the viscoelastic creep compliance {VECC(t)} and viscoplastic creep compliance {VPCC(t)} are readily estimated from the parameters identified in creep–recovery curve shown in .
EC and VECC do not contribute to permanent dimensional change because the dimensional changes are reversed after unloading. VPCC portion is not reversible and is associated with permanent dimensional change. It is, therefore, important to experimentally separate total compliance TC(t) into EC, VECC(t) and VPCC(t) to fully characterize the creep effects to dimensional instability of polymers used in restorative applications.
The objective in this study was to determine and analyze EC, VECC(t) and VPCC(t) contributions to the TC(t) in selected materials used for provisional restorations. The null hypothesis is that different provisional restorative materials evaluated are not significantly different in their EC, VECC and VPCC contributions. Since differences in these compliance values may lead to differences in permanent dimensional changes during stress application, there will be changes in the geometry and occlusion of the restorations under applied stress with time (and the consequent changes in stress distribution differences). These results may significantly compromise the function and durability of the restoration, especially when the temporary prosthesis has to function for intermediate or longer term durations in specific treatment situations.
2. Materials and methods
2.1. Materials
Four different materials were studied in this investigation. These materials were selected to represent different compositional features used in the current popular provisional crown materials. They included two mono-methacrylate systems of polymethyl methacrylate (PMMA) and polyethyl methacrylate (PEMA) and two bisacryl resin-based composite systems. PMMA has been used over many years because of low cost, good esthetics (including color stability and polishability), but it also suffers from disadvantages such as poor working time, strong odor, high curing heat and high polymerization shrinkage. PEMA system was developed as a low cost alternative to PMMA system to extend the working time and to reduce heat of cure and shrinkage. More recently, bisacryl and bisGMA composites with silica or other filler material have been developed to enhance strength and to reduce heat of cure, improve mechanical properties, esthetics, etc. The materials evaluated in this study included two mono-methacrylate (PMMA-based JET and PEMA-based TRIM II) and two bisacryl composite materials (LUXATEMP and PROTEMP 3 GARANT). lists the materials studied in this investigation and includes the material brand name, ID code, supplier name, specified list of ingredients and the mixing method for the ingredients along with the type of curing used to prepare the specimens for the tests.
Table 1. Materials.
2.2. Method
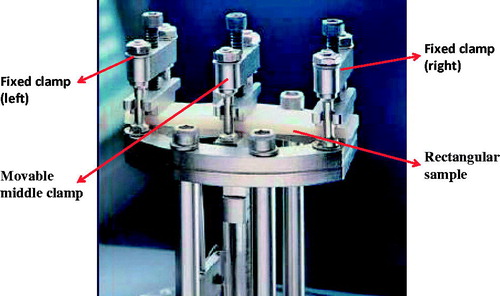
Rectangular samples of 45 × 20 × 2 mm were prepared in a stainless steel mold. Manufacturer recommended procedures were used in preparing the samples. The manual mix powder-liquid self-cure materials (JET and TRM) were mixed as per manufacturer instructions and placed into the mold and allowed to cure for 15 min. The dual-cure auto-mix composite materials (PRO and LXT) were injected from their Auto-Mix Dispenser to fill the mold, leveled and self-cured. After curing for 30 min, excess flash was trimmed off and the specimens were stored in a humidity chamber at 37 °C for 24 h before testing. Flexural compliance is clinically most relevant for crowns and bridges under masticatory stress, and flexural creep compliance is also known to be somewhat lower than tensile creep compliance in polymers.[Citation22]. Therefore, flexural creep experiments were performed under dual cantilever flexural loading in a TA Instruments (New Castle, DE) dynamic mechanical analyzer (DMA) model 2980, using TA Advantage instrument Control Program. shows the sample placed in the clamp for experimental measurement. The sample is fixed at the ends by the stationary clamps at its two ends and subjected to flexural deformation by the middle movable clamp under a constant applied load. The use of dual cantilever clamp is similar to three-point bending except that the ends of the sample are fixed. This type of clamp is especially useful in applications where the samples are likely to bend significantly under static stress, as is the case in TRM samples that were included in this study. However, the use of the clamp also necessitates empirical corrections to eliminate errors due to the failure of any assumptions in the model equations set up for calculations, as indicated below.
Figure 2. Illustration of the dual cantilever clamp with a sample placed in the clamp for flexural deformation. The sample is fixed at the ends by the right and left clamps, and deformed in flexure by the movable middle clamp.
The amplitude of deformation δ is measured in the test along with the applied load. The following equations are used to calculate maximum stress and strain data from the applied load and the measured amplitude of deformation, respectively:
where σx is the stress, εx is the strain, P is the ½ the applied load, δ is the measured amplitude of deformation, t is the sample thickness, L is the sample length, w is the sample width and Fc is a pre-determined clamping correction factor, as explained below.
The uncorrected equation for strain calculations in the dual cantilever test does not include the correction factor Fc. The equation is derived on the assumption that the strain in the sample ends where the sample enters the clamp, and this assumption is not realized in practice in cantilever loading. Consequently some error will be introduced in the strain and other parameters that include strain (e.g. compliance or modulus) directly calculated from data using the uncorrected equation for strain. This is different from a flexural test using a three point bending test in the DMA, where the local deformation of the sample at the end points of support can be assumed to be negligible. Fortunately, this can be corrected by a carefully pre-determined correction factor. This correction factor is empirically determined by the relation ![]() where Ks is the known flexural stiffness for a sample and K is the measured stiffness using the dual cantilever method. The measured stiffness uses the uncorrected model equation for stiffness given by
where Ks is the known flexural stiffness for a sample and K is the measured stiffness using the dual cantilever method. The measured stiffness uses the uncorrected model equation for stiffness given by where I is the sample moment of inertia given by
![]() The ratio of the known stiffness to the measured sample stiffness is used as a correction factor Fc. A model equation for the correction factor relating it to sample dimensions L and t, and some numerical constants have been derived for the dual cantilever camp used in the TA Instruments DMA using finite element analysis from experimental data involving a number of sample materials and geometries (Application note on Calculations based on Clamp type: Dual cantilever Clamp, TA Instruments DMA Manual). This equation is given by the following:
The ratio of the known stiffness to the measured sample stiffness is used as a correction factor Fc. A model equation for the correction factor relating it to sample dimensions L and t, and some numerical constants have been derived for the dual cantilever camp used in the TA Instruments DMA using finite element analysis from experimental data involving a number of sample materials and geometries (Application note on Calculations based on Clamp type: Dual cantilever Clamp, TA Instruments DMA Manual). This equation is given by the following:
Thus the strain and compliance determination in the study used a validated empirical clamp correction factor to ensure the accuracy of the calculated strain and compliance data. All calculated strain and compliance data reported are corrected values.
Creep–recovery curves were run at 27 °C, 37 °C and 47 °C to simulate the creep behavior near the ambient oral temperature. Both creep and recovery segments were run for 60 min each. All experiments were run with a span length of 35 mm between the end clamps. Amplitude of deformation, %strain, total compliance and recoverable compliance data were collected by TA Instruments Thermal Advantage Program and plotted from the data spread sheet using Microsoft Excel (Version 2010). A sample size of N = 6 was used, and this corresponded to 90% power based on the power analysis of data from research results we reported previously (American association of Dental Research Annual Session presentation # 1991, 2001). All tests were done under a pre-optimized constant stress level of 3 MPa. The stress level of 3 MPa was selected based on our trial experiments. The flexural strength (MPa) values for PMMA-, PEMA- and bis(acryl) provisional crown and bridge materials at 23 °C have been reported as approximately 57, 40 and 100 MPa, respectively,[Citation23] but the corresponding values near 37 °C will be lower. The stress level of 3 MPa was selected by trial experiments to maintain the load and amplitude of deformation within the specified limits of the instrument (load ≤18 N, amplitude ≤1 mm for the DMA) for all materials tested in the study.
3. Results
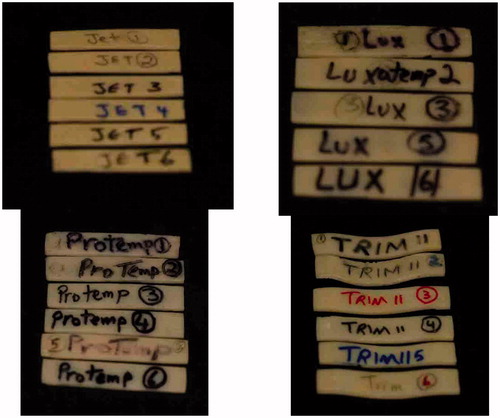
shows typical creep–recovery %strain profiles (as a function of time and temperature) of the different provisional crown materials studied in this investigation. The 60-min % strain values during creep range from a low of 0.19% at 27 °C for PRO to as high as 10.43% at 47 °C for TRM. While there are limited differences between the profiles of JET, LXT and PRO, the % strain values in TRM were at least an order of magnitude higher (over the entire range of values at each temperature) than those of the rest of the materials. is a macro-photograph of the post-test appearance of the samples after creep–recovery tests and indicated visual sample distortion effects only in the TRM samples. Thus, displacement profiles and post-test sample appearance strongly indicate significant dimensional instability in TRM after a limited creep–recovery test sequence near the oral temperature.
Figure 3. Typical examples of creep–recovery curves in (a) JET, (b) PRO, (c) LXT and (d) TRM. Note the maximum (10%) strain in TRS as compared with <1% in JET, PRO and LXT. Note also differences in scales used to accommodate the large strain values in TRM.
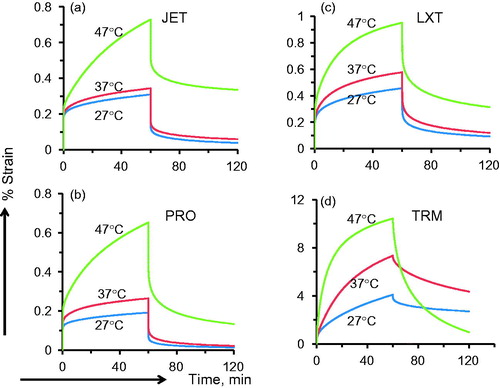
Figure 4. Post-test appearance of specimens. Note the visually detectable macroscopic deformation in TRM, but not in other materials.
shows typical total compliance (TC) profiles of all materials as a function of time at 37 °C. Significant differences are readily apparent in the compliance profiles, with TRM again as a standout difference from the rest with an order of magnitude difference in the TC across the entire range of time. The profiles at 27 °C and 47 °C were similar to that of 37 °C. and , respectively, show VECC and VPCC profiles as a function of time at 37 °C for different materials. Both VECC and VPCC profiles also show major differences between TRM and other materials. Mean values of EC, 60-min VECC and VPCC values were also estimated, and shows a bar graph of the respective values as a function of both materials and temperatures studied. The range of compliance means (μm2/N) and (SD) at 27, 37 and 47 °C, respectively, were (EC) Jet: 515.8 (36.3), 584.0 (55.4), 674.3 (53.3); LXT: 594.5 (86.7), 795.0 (146.7), 1032.2 (189.7); PRO: 625.7 (65.9), 808.7 (88.0), 1212.7 (142.9); TRM: 1858.0 (346.6), 2127.5 (639.8), 4031.0 (1241.4); (VECC60min) JET: 324.5 (34.7), 302.3 (61.6), 518.5 (55.5); LXT: 558.8 (165.4), 656.6 (148.3), 1073.2 (285.4); PRO: 441.7 (119.3), 691.2 (126.7), 1318.0 (202.8); TRM: 2922.2 (324.6), 7685.2 (1636.1), 27,130.3 (3608.8); (VPCC60min) JET: 73.2 (79.6), 155.3 (57.9), 992.7 (298.2); LXT: 252.2 (48.3), 331.3 (84.0), 862.8 (102.9); PRO: 170.0 (92.0), 327.8 (55.3), 959.5 (483.3); TRM: 9755.8 (1349.0), 14,210.8 (1401.8), 4687.2 (1363.4). Two-way ANOVA and follow-up multiple comparisons by Tukey HSD tests were used to characterize the significant differences between EC, 60-min VECC and VPCC means as a function of material, temperature and material–temperature interactions. Consolidated summary of ANOVA results () for TC60 min, EC, VECC60 min, VPCC60 min showed highly significant differences in all compliance parameters among materials, temperature and material-temperature interactions (p < 0.0001). In addition, Tukey contrast in shows that TRM means for EC, VECC600 min and VPCC600 min are relatively very high, and significantly different (p < .0001) from all other formulations. At 37 °C, TRM had the highest VPCC mean (μm2/N) of 14211 and can be compared with that of JET mean (155.3).
Figure 5. Example of total compliance (TC) variation as a function of time. Note the large difference in TC between TR and other formulations.
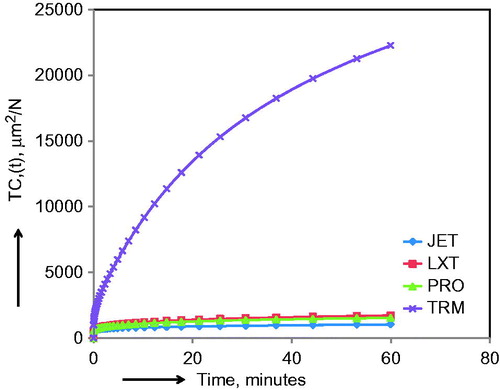
Figure 6. Example of viscoelastic creep compliance as a function time {VECC(t)}. Note the large difference in VECC values between TR and other formulations.
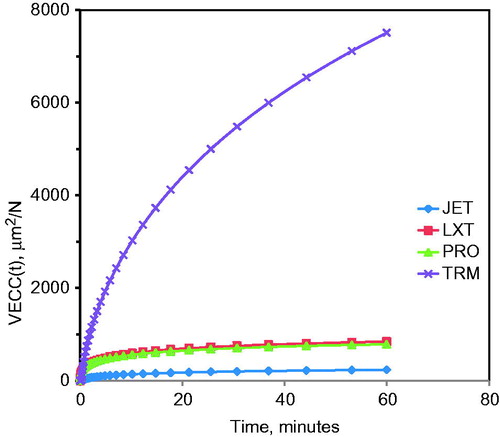
Figure 7. Example of viscoplastic creep compliance as a function of time {VPCC(t)}. Note the large difference in VPCC values between TR and other formulations.
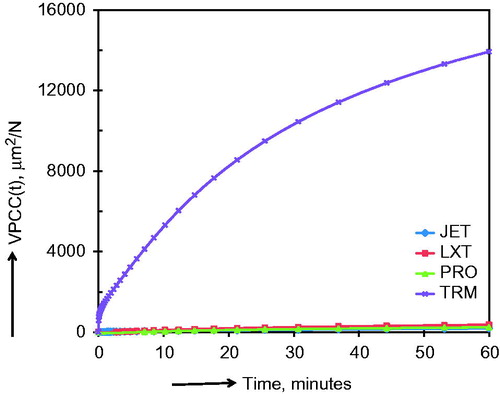
Figure 8. Bar graphs showing means and (SDs) illustrating differences between compliance contributions as a function of materials and temperature. (a) TC, (b) EC, (c) VECC60 min and (d) VPCC60 min. Note that for better clarity, the compliance scale used for different bar graphs are not identical due to large differences in the compliance values. Note also the large difference in all compliance parameters between TR and other formulations.
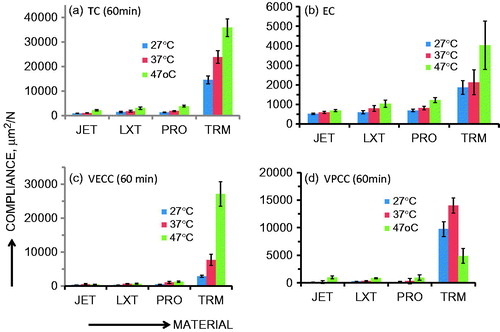
Table 2. Consolidated summary of ANOVA results for TC, EC, RCC60 min and NRCC60 min significant differences.
Table 3. Statistical analysis: Tukey contrasts.(a) Tukey contrast of compliance LS means: materials effectsTable Footnotea.
(b) Tukey contrast of compliance LS means:temperature effects Table Footnotea.
(c) Tukey contrast of compliance LS means: interactive effectsTable Footnotea.
4. Discussion of results
ANOVA of the compliance data in this study resulted in the rejection of our null hypothesis of no difference between materials. Statistically highly significant differences (p < 0.0001) among TC, EC, VECC600 min and VPCC600 min means were identified among different materials studied (see ). Tukey contrasts in also illustrate the highly significant differences between TRM and other materials. The main effect of temperature as well as the material–temperature interaction effect on all three compliance means was also highly significant (p < .0001).
Compliance is important from a practical and clinical point of view. Compliance is a measure of the ability of a material to deform under unit applied stress. However, different types of deformation are typically observed in polymers under stress. The differences in the types and extent of each type of deformation in different materials may profoundly influence their failure modes and tendencies. Elastic and recoverable viscoelastic deformations are energy storage processes. Since energy is stored without loss during the deformation, elastic and recoverable viscoelastic compliance is useful to manipulate materials during clinical placement or adjustment by limited deformation which is recoverable and causes no permanent dimensional change. Unfortunately, stored elastic energy above a critical energy level is also the source of fracture propagation under stress, and is responsible for brittle failure in materials. When a material has a very high elastic modulus with no ability to delay stress build up through viscoelastic deformation and/or dissipate stress through viscoplastic deformation, the material is typically brittle and tends to build up the stored energy rapidly on stress application. This promotes stress concentration at crack fronts of pre-existing flaws above the critical value needed for their propagation. On the contrary, too high an elastic compliance may result in low stiffness that is contra-indicated for masticatory function. Therefore, only an optimum level of elastic or recoverable viscoelastic compliance in an appliance is useful. Limited localized non-recoverable viscoplastic deformation at highly stressed crack fronts may potentially help in lowering the stress concentration at these sites by the energy used up for such deformation at these high stress points. Such limited local deformation may help delay or prevent fracture and catastrophic failure. However, excessive non-recoverable viscoplastic compliance at even low stress levels used in this study may lead to significant dimensional instability in the bulk of the material during long-term clinical function. Such deformation of the restoration can lead to significant changes in occlusion and stress distribution conditions, leading to restoration failure as well as risk of periodontium trauma. Thus the tradeoffs needed for optimum compliance parameters for improved durability of an interim prosthesis indicate that it should ideally possess moderate elastic and recoverable compliance and very limited or no non-recoverable compliance.
Our results indicate that three of the four materials (LXT, PRO and JET) studied demonstrated moderate elastic and viscoelastic compliance with relatively low-viscoplastic compliance and better dimensional stability. Only TRM showed significantly larger values of all compliance contributions and visual sample distortion after the experiments were completed. The % resilience (arbitrarily defined as the ratio of total recovered compliance after 60 min recovery to the total compliance after 60-min creep) at 37 °C varied as follows: JET: 85.5 (4.23), LXT: 81.3 (2.1); PRO: 81.4 (2.6), TRM: 37.3 (8.2). At the oral temperature, TRM demonstrated poor resilience vis-à-vis LXT, PRO and JET.
In a previous report, Pae et al. [Citation20] also reported dimensional differences in their experiments involving bisacryl composites and mono-methacrylate resins. However, these authors concluded that mono-methacrylate formulations are highly dimensionally unstable when compared with the composite formulations. Our results and analysis indicate that different mono-methacrylate resin systems may differ from each other in their deformation behavior depending on their structure. Mono-methacrylate PMMA resin system JET is actually one of the more dimensionally stable resin systems at 37 °C under the stress levels we used, although it may have other limitations. The other mono-methacrylate PEMA system TRM is, however, dimensionally highly unstable under stress used in the study, as also reported by Pae et al. It is well recognized in the literature that flexible alkyl side chains in a polymer backbone may significantly influence the plasticity of the polymer through lowering of Tg, the glass transition temperature.[Citation24] The increasing chain length of aliphatic groups has also been reported to decrease the glass transition temperature of methacrylate polymers. In TRM, the glass transition temperatures of poly-isobutyl methacrylate from the isobutyl monomer liquid and polyethyl methacrylate of the PEMA powder both have low glass transition temperatures (53 °C and 65 °C, respectively [Citation24,Citation25]). The glass transition temperature of PMMA is known to be 105 °C.[Citation24,Citation25] High compliance values of TRM vis-à-vis JET are in accordance with the significant difference in the glass transition temperatures between PMMA and PEMA systems used in JET and TRM, respectively. The higher compliance (mean) values of TRM vis-à-vis JET are also in accordance with its lower flexural strength (40 MPa) compared with that of JET (57 MPa). The presence of filler in Bis(acryl) resins make it difficult to compare them against TRM or JET because of the significant effect of filler contribution to both glass transition temperature and flexural strength.
The breakdown and analysis of recoverable and non-recoverable compliance properties of biomedical polymeric materials used in dentistry or medicine are critically important to assess their dimensional stability during clinical function. The separation of compliance to elastic, viscoelastic and viscoplastic contributions is a very useful approach not only to understand the mechanisms involved in polymer mechanical behavior but also to design polymer formulations with a desired mix of deformation responses ranging from purely elastomeric behavior to controlled flexible behavior or from a rigid to highly flexible structure. This has significant implications for rational development of a wide range of polymeric biomedical materials such as restorative materials, impression materials, maxillofacial materials and ophthalmic materials.
5. Conclusions
The following are the conclusions based on the study:
There were significant differences among elastic, viscoelastic and viscoplastic contributions to the overall compliance of different provisional crown materials, as a function of both material and temperature.
PEMA-based resin TRM II exhibited excessive dimensional instability with high-viscoplastic deformation and appears to be unsuitable as an interim appliance for longer term treatment situations.
The bisacryl composites LXT and PRO, and PMMA-based JET show significantly better dimensional accuracy and resiliency, and are, therefore, preferable in medium to longer term applications than TRM.
Separating compliance to its elastic, recoverable and non-recoverable contributions is a valuable approach in not only understanding polymer behavior under stress but also in rational design of a polymer to tailor its functional and clinical performance.
Disclosure statement
This research was conducted with research support from the Department of Restorative Dentistry, and received no external support. The authors report that they have no conflicts of interest.
References
- Balkenhol M, Mautner MC, Ferger P, et al. Mechanical properties of provisional crown and bridge materials: chemical-curing versus dual-curing systems. J Dent. 2008;36:15–20.
- Hernandez EP, Oshida Y, Platt JA, et al. Mechanical properties of four methylmethacrylate-based resins for provisional fixed restorations. Biomed Mater Eng. 2004;14:107–122.
- Ireland MF, Dixon DL, Breeding LC, et al. In vitro mechanical property comparison of four resins used for fabrication of provisional fixed restorations. J Prosthet Dent. 1998;80:158–162.
- Balkenhol M, Kohler H, Orbach K, et al. Fracture toughness of cross-linked and non-cross-linked temporary crown and fixed partial denture materials. Dent Mater. 2009;25:917–928.
- Gegauff AG, Pryor HG. Fracture toughness of provisional resins for fixed prosthodontics. J Prosthet Dent. 1987;58:23–29.
- Gegauff AG, Wilkerson JJ. Fracture toughness testing of visible light- and chemical-initiated provisional restoration resins. Int J Prosthodont. 1995;8:62–68.
- Yilmaz A, Baydas S. Fracture resistance of various temporary crown materials. J Contemp Dent Pract. 2007;8:44–51.
- Koumjian JH, Nimmo A. Evaluation of fracture resistance of resins used for provisional restorations. J Prosthet Dent. 1990;64:654–657.
- Lang R, Rosentritt M, Behr M, et al. Fracture resistance of PMMA and resin matrix composite-based interim FPD materials. Int J Prosthodont. 2003;16:381–384.
- Nejatidanesh F, Momeni G, Savabi O. Flexural strength of interim resin materials for fixed prosthodontics. J Prosthodont. 2009;18:507–511.
- Osman YI, Owen CP. Flexural strength of provisional restorative materials. J Prosthet Dent. 1993;70:94–96.
- Rosentritt M, Behr M, Lang R, et al. Flexural properties of prosthetic provisional polymers. Eur J Prosthodont Restor Dent. 2004;12:75–79.
- Haselton DR, Diaz-Arnold AM, Vargas MA. Flexural strength of provisional crown and fixed partial denture resins. J Prosthet Dent. 2002;87:225–228.
- Korkmaz T, Doğan A, Usanmaz A. Dynamic mechanical analysis of provisional resin materials reinforced by metal oxides. Biomed Mater Eng. 2005;15:179–188.
- Kim SH, Watts DC. Degree of conversion of bis-acrylic based provisional partial denture materials. J Korean Acad Prosthodont. 2008;46:639–642.
- Mayer T. The microstructure and materials properties of provisional crown and bridge materials. Schweiz Monatsschr Zahnmed. 1995;105:1134–1141.
- Givens EJ Jr., Neiva G, Yaman P, et al. Marginal adaptation and color stability of four provisional materials. J Prosthodont. 2008;17:97–101.
- Haselton DR, Diaz-Arnold AM, Dawson DV. Color stability of provisional crown and fixed partial denture resins. J Prosthet Dent. 2005;93:70–75.
- Haselton DR, Diaz-Arnold AM, Dawson DV. Effect of storage solution on surface roughness of provisional crown and fixed partial denture materials. J Prosthodont. 2004;13:227–232.
- Pae A, Jeong MS, Kim SH. Time-dependent deformation of polymer based provisional crown and partial denture materials. J Korean Acad Prosthodont. 2005;43:717–726.
- Vaidyanathan TK, Vaidyanathan J, Manasse M. Analysis of stress relaxation in temporization materials in dentistry. Dent Mater. 2015;31:e55–e82.
- Bradley SW, Bradley WL, Puckett PM. On the variation of compliance measurements in polymeric solids. In: Peraro JS, editor. Limitations of test methods for plastics. ASTM STP 1369. West Conshohocken (PA): American Society for Testing and Materials; 2000.
- Mei MJ, Su YC, Li H, et al. Effect of heat treatment on the physical properties of provisional crowns during polymerization. Materials 2008;8:1766–1777.
- Nielson L. Mechanical properties of polymers and composites. Vol 1. New York: Marcel Decker Inc.; 1974. p. 20.
- Malhotra SL, Minh L, Blanchard LP. Thermal decomposition and glass transition temperature of poly(methyl methacrylate) and poly(isobutyl methacrylate). J Macromol Sci: Part a – Chem. 1983;19:579–600.