
Abstract
Objectives: To assess the effects on curing conditions (dry versus submerged curing) and particle size on the compressive strength (CS) and flexural strength (FS) of set MTA cement.
Materials and methods: Two different Portland cements were created, P1 and P2, with P1 < P2 in particle size. These were then used to create two experimental MTA products, M1 and M2, with M1 < M2 in particle size. Particle size analysis was performed according to ISO 13320. The particle size at the 90th percentile (i.e. the larger particles) was P1: 15.2 μm, P2: 29.1 μm, M1: 16.5 μm, and M2: 37.1 μm. M2 was cured exposed to air, or submerged in fluids of pH 5.0, 7.2 (PBS), or 7.5 for 1 week. CS and FS of the set cement were determined using a modified ISO 9917-1 and ISO 4049 methods, respectively. P1, P2, M1 and M2 were cured in PBS at physiological pH (7.2) and likewise tested for CS and FS.
Results: Curing under dry conditions gave a significantly lower CS than when cured in PBS. There was a trend for lower FS for dry versus wet curing. However, this did not reach statistical significance. Cements with smaller particle sizes showed greater CS and FS at 1 day than those with larger particle sizes. However, this advantage was lost over the following 1–3 weeks.
Conclusions: Experiments that test the properties of MTA should cure the MTA under wet conditions and at physiological pH.
Introduction
Mineral trioxide aggregate (MTA) is typically comprised of 80% Portland cement (PC) and 20% bismuth oxide (BO). Particles of BO make the cement radiopaque,[Citation1] but they are insoluble in water, and do not make a significant contribution to the setting reaction.[Citation2] However, BO physically separates particles of PC during the setting reaction, which then influences the properties of the set cement.[Citation3–5]
The particle size distribution (PSD) is known to influence the setting time of both PC and MTA, since cements with smaller particle sizes achieve earlier resistance to indentation and take less time to reach 95% of the plateau value for elastic modulus plateau.[Citation6,Citation7] It is not yet known how changing the particle size affects the compressive strength (CS) and flexural strength (FS) of the set cement.
Assessment of PSD is performed using laser diffraction analysis as it can account for the three dimensionality of particles and also for a large range of particle sizes.[Citation8] The use of SEM sampling was not used because the method involves assessing individual particles and hence would lead to an unrepresentative result.[Citation8]
The international standard for testing the CS of water-based cements involves removing samples from their setting molds only after one hour.[Citation9] However, as MTA cements typically take several hours to set, it is prudent to keep the samples within their molds for a wet curing period of 24 h.[Citation1, Citation9]
The international standard does not describe how to store samples of cement after the initial 24-h period, prior to testing. A range of storage methods have been used, including dry storage, storage in air with 95% or 100% humidity, and complete immersion in water.[Citation10,Citation11] MTA cement will expand when stored in physiological solutions and therefore is expected to desiccate if stored dry in room air,[Citation12] which could result in lower strengths. Aggarwal et al. assessed the flexural strength of set MTA when exposed to various irrigation solutions including 5.25% NaOCl, 2% chlorhexidine gluconate, 17% EDTA, BioPure MTAD and distilled water,[Citation13] but their study did not assess the influence of pH per se.
It can be anticipated that storage parameters such as moisture and pH in the laboratory have parallels to clinical conditions where set MTA is in contact with tooth structure. Given the likely influence of environmental conditions on the physical properties of MTA, the aim of this study was to assess the impact of curing conditions on the mechanical properties of MTA (i.e. CS and FS), particularly variables that could contribute to differences in laboratory studies of MTA. Likewise this study also examined the effect of PC particle size on these same parameters, since alterations in particle size could give improved properties to the set MTA cement which mitigate or overcome the influence of the storage conditions.
Material and methods
Sample preparation
Two experimental MTA cements were created by combining PC (Si Powders Pty Ltd, Toowoomba, Australia, Lot: UFGP0907/MilledGP) and BO (Alfa Aesar, Ward Hill, MA, Lot No E11Y009). Regular PC (P2) was created by routine milling processes to create Portland cement. A finer powder (P1) was produced by jet-milling the PC which abrades the larger particles into smaller particles while selectively collecting particles of lower mass and size. P2 and P1 was and then mixed with BO powder at a 4:1 ratio, thus producing two MTA cements of differing particle size (M2 > M1).
Particle size distribution
Laser diffraction particle size analysis was performed in accordance with ISO 13320 as described previously,[Citation14] using a Mastersizer 2000 Analyzer (Malvern Instruments, Worcestershire, UK). The Mastersizer 2000 Analyzer can measure particles from 0.02 μm to 2000 μm with accuracy of ±1%.[Citation15]
One gram of each powder was dispersed into 1 L of methylated spirits as the diluent.[Citation6,Citation16,Citation17] Methylated spirits was used as it produces similar results to isopropyl alcohol when assessing small particles.[Citation8] Ultrasonic energy was applied to disperse agglomerated particles with samples tested within 5 s on application of the samples to diluent. This short period of ultrasonification is not expected to significantly alter the particle size distribution of the sample and is commonly applied in industries assessing Portland cement.[Citation18]
The particle absorption index used was 0.1. The refractive index (RI) of heterogeneous materials was calculated using weighted averages. For methylated spirits, the calculated RI was 1.36 (5% of methanol RI 1.327 and 95% of ethanol RI 1.362).[Citation19] Likewise, the calculated RI for MTA was 1.844 (80% of PC RI 1.68 and 20% of BO RI 2.5).[Citation20,Citation21] The Mie theory for calculating particle size was applied, as it is the preferred method for samples with particles below 50 μm.[Citation14]
Curing conditions and compressive strength
To prepare samples for testing CS and FS, powders were mixed with water at a powder-to-water ratio of 3:1 (by mass), as suggested by the original MTA patent,[Citation1] using mixing capsules with 30 s agitation at 4600 oscillations per minute within an amalgamator (Ultramat 2 SDI Ltd, Bayswater, Australia).
To assess the effects of storage on physical properties, cement M2 was chosen. CS was assessed using the method of ISO 9917–1 at 1 week.[Citation9] M2 cement was prepared and placed into split molds (internal dimensions 4 mm diameter and 6 mm height, and the material allowed to set for 1 day.
ISO 9917–1 involves setting cements in molds for 1 h followed by storage of the cement in grade 3 water at 37 ± 1 °C for 23 ± 0.5 h. However, as MTA takes several hours to set,[Citation1] the following alterations to ISO 9917–1 were performed:
Rather than setting the cement for 1 h prior to removing the cement from the molds, the cements were allowed to set for 1 day. This was to accommodate the prolonged setting time of MTA as ISO 9917-1 is more appropriate for fast setting cements such as GIC.[Citation9]
Rather than storing the cement in Grade 3 water, the cement was stored under four conditions, namely dry, in pH 5 Grade 3 water, in pH 7.5 Grade 3 water and in 0.15 mmol/L phosphate buffered saline (PBS)(Sigma-Aldrich, MO), at pH 7.2. The purpose of using PBS compared against the other conditions was to see if physiological conditions differ from anticipated typical laboratory conditions. The purpose of the two types of Grade 3 water is to assess whether Grade 3 water can produce variable results.
Samples were then tested with one of two CS assessments. The first used an Instron 5543 Testing Machine (High Wycombe, UK), which was used in a dry room (24 °C). The second used an Instron 5848 Testing Machine (High Wycombe, UK), in which the samples were submerged in PBS at 37 °C in an Instron BioPuls bath (High Wycombe, UK). The loading rate for both machines was 50 N/min. Six replicates were used for each sample group instead of five. The purpose was to again, consider the differences between testing in a dry environment against testing submerged in PBS to replicate physiological conditions.
CS was calculated using the formula:
where, p is the maximum force applied (N); d is the measured diameter of the specimen (mm).
Curing conditions and flexural strength
Samples of M2 cement were cured, stored and tested in various environmental conditions as described above. The split molds had internal dimensions of 25 mm length, 2 mm height, and 2 mm width, as per ISO 4049.[Citation22] Eight replicates were used for each sample group. ISO 4049 is typically for composite resins and hence the curing conditions described above for compressive strength were utilized.[Citation22]
FS was calculated using the formula:
where, F is the maximum load (N) exerted on the specimen; l is the distance (mm) between the supports; b is the width (mm) at the center of the specimen; h is the height (mm) at the center of the specimen.
Particle size effects on compressive strength
Samples of P1, P2, M1 and M2 cements were prepared, using split molds with internal dimensions of 6 mm height and 4 mm diameter. The samples were allowed to set for 1 day submerged in PBS solution at 37 °C, and then allowed to cure for a further 1 day, 1 week or 3 weeks, all in PBS at 37 °C. This protocol was chosen based on the optimal results obtained for M2 cement in the previous part of the study. Compressive strength was assessed as per ISO 9917–1,[Citation9] using an Instron 5848 Testing Machine (High Wycombe, UK) with the samples submerged in PBS at 37 °C as described above. The loading rate was 50 N/min. Nine replicates were used for each sample group which was different to the suggested five replicates in ISO 9917–1.
Particle size effects on flexural strength
Samples of P1, P2, M1 and M2 cements were prepared, using split molds had internal dimensions of 25 mm length, 2 mm height and 2 mm width, as per ISO 4049.[Citation22] The samples were allowed to set for 1 day submerged in PBS solution at 37 °C, and then allowed to cure for a further 1 day, 1 week or 3 weeks, all in PBS at 37 °C. Flexural strength was assessed as described above for M2 cement. Ten replicates were used for each sample group.
Statistical analysis
Data sets were tested for normality followed by ANOVA with post-hoc tests. Those which did not pass normality tests were assessed using the Mann–Whitney or Kruskal–Wallis test to determine differences between groups, with Dunn’s multiple comparison post-hoc tests. Data sets which did pass normality tests were assessed using analysis of variance, with Bonferroni post-hoc tests.
Results
Particle size distribution
Data for PSD is summarized in . P2 and M2 had larger particle sizes, while P1 and M1 had smaller particles.
Table 1. Particle size distributions of experimental cements and their constituents.
Effect of curing and testing conditions on compressive strength
As shown in , M2 cement, in a PBS was significantly greater in CS than dry storage when tested in dry conditions (p <.01) with all other samples that were tested in dry conditions illustrating no significant differences. However, when comparing samples that were all tested in PBS, there was no significance between the groups.
Figure 1. Effect of curing conditions on the physical properties on MTA. Bars show means and errors bars indicate 95% confidence intervals. Differences between groups were calculated with the Kruskal–Wallis test, with post-hoc Dunn’s multiple comparison tests. Error bars are 95% confidence intervals. Bars indicated with the same letters are significantly different. S: Storage conditions for 1 week. T: Testing conditions.
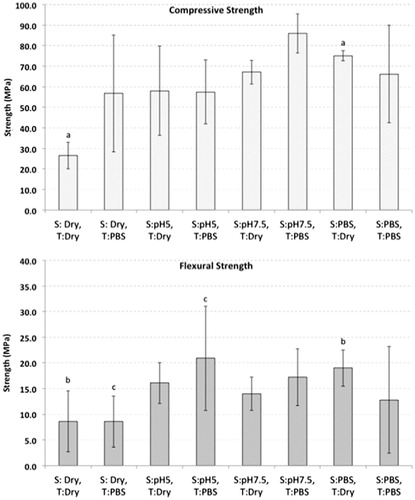
When comparing dry versus submersion in PBS testing conditions, there was a two-fold increase in the means from a sample that was stored dry and tested dry, to a sample that was stored dry and tested in PBS. However, there was no significant difference between the groups.
Effect of curing and testing conditions on flexural strength
As shown in , M2 that were stored in PBS and tested in dry conditions illustrated significantly greater flexural strength than samples that were stored dry and tested in dry conditions (p < .05). However, there were no differences among the remainder of the samples under dry conditions.
For samples that were tested in PBS, there was a significant difference between samples that were stored dry and samples that were stored in pH 5 (p < .05). However, there was no difference between the other groups.
Effect of particle size on compressive strength
Results for CS over time in the four different cements during storage in PBS are summarized in . At day 1, the cements with smaller particle sizes (M1 and P1) had greater compressive strength than those with larger particle sizes (M2 and P2). Comparing similar products, there was a significant difference between M1 and M2 (p < .001), and between P1 and P2 (p <.01). Also, there was significance between P1 and M2, (p <.001) and P2 and M1 (p <.05).
Figure 2. Influence of particle size and time on the physical properties of MTA, when stored in PBS. Bars show means and errors bars indicate 95% confidence intervals. Differences between groups were calculated with parametric ANOVA with post-hoc Bonferroni’s multiple comparison tests. Bars indicated with the same letters are significantly different. 1d, 1w, 3w: Stored in PBS for 1 day, 1 week and 3 weeks, respectively.
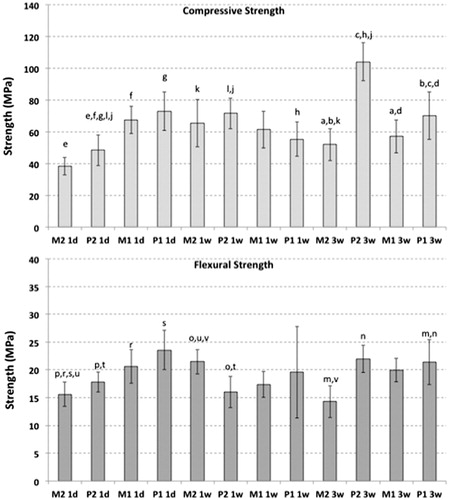
By one week of curing, there was no significance difference between the cements.
After 3 weeks, P2 showed a significantly higher CS than the other three cements (p <.001) while the other cements had no differences between each other.
P1 had a significant drop from 1 day to 1 week (p <.05), however, there was no significant difference between the other time periods. P2 had significant increase in CS over those time periods (p <.05/3). There was no difference in M1 over the time periods of 1 day, 1 week and 3 weeks. M2 had a significant increase (p <.001) from 1 day to 1 week and from 1 day to 3 weeks. However, the differences between the other time periods were not significant.
Effects of particle size on flexural strength
Changes in FS over time are summarized in . At day 1, P1 had a significantly greater FS than P2 and M2 (p <.05 and <.001, respectively). There were no significant differences between the other groups.
By one week of curing, M2 had a significantly greater FS than P2 (p <.05). However, there were no significant differences between the other groups.
By three weeks of curing, M2 was significantly lower than the other cements (p <.05) with the other cements having no difference between each other.
Comparing the same cement tested over different time periods, P1 and M1 had no significant difference over the time periods. P2 at 1week was significantly lower (p < .01) than the other time periods of 1 day and 3 weeks, however, 1 day and 3 weeks were not different from each other. M2 is significantly improved from 1 day to 1 week (p <.01) and there was a significant, albeit small, drop from 1 week to 3 weeks (p <.01) but there were no significant differences between 1 day to 3 weeks.
Discussion
This study utilized the mechanical mixing of encapsulated MTA to eliminate operator-induced variability on mixing and consistent mixing of optimum water to powder proportions, a method applied by other studies.[Citation23, Citation24]
Samples those were stored in PBS, when tested in dry conditions, had better CS and FS than samples that were stored dry and tested dry. This illustrates the importance of submerged MTA in PBS when storing samples as dry storage of MTA would desiccate the MTA resulting in weaker CS. The average value of 26.5 MPa obtained for dry-stored and dry-tested MTA is comparable to the findings of Porter (27 MPa),[Citation10] while the 66 MPa value obtained for PBS-stored and wet-tested MTA is comparable to that of Camilleri (above 65 MPa)[Citation5] and Torabinejad et al (67 MPa).[Citation25]
A trend was seen for lower CS under acidic conditions. This aligns with results of previous studies that reported environmental acids causing MTA to deteriorate.[Citation26–28] This point is also relevant to sites of dental caries or acute inflammation where a lower pH will be found. Despite the trend of lower CS for acidic conditions, the differences were not statistically significant with PBS and slightly alkaline mixing water.
Interestingly, the CS of dry-stored MTA tested in PBS was comparable to samples cured in aqueous conditions, suggesting that MTA once rehydrated shows improved CS but not improved FS.
In this study, the number of samples able to be assessed in each group varied slightly due to some samples becoming locked into the split molds or being damaged upon removal, and thus excluded. This problem could be overcome if the stainless steel molds specified in the ISO standard were replaced with single use or re-useable soft bendable molds, to facilitate sample removal. One study had employed single-use molds that were cut to preserve the integrity of the set samples, and reported that the CS of such MTA samples when cured in the presence of air, albeit, with a nearby wet cotton pellet were higher than similarly dry stored samples in other studies.[Citation29]
After placing MTA, clinicians can place a wet cotton pellet, dry cotton pellet,[Citation30] or a restorative material above the newly placed MTA.[Citation31] The results of the present study illustrates that using a dry cotton pellet could be detrimental to the strength of the MTA. Although curing MTA in a wet environment is better than curing in a dry environment, the current results do not suggest that placing a wet cotton pellet is superior to placing a restoration directly above the MTA.
In the cements tested in the present study, smaller particle sizes gave significant greater initial CS at 1 day. However over periods of 1 to 3 weeks, this advantage became less apparent. The present results shows a trend where MTA generally had weaker initial strengths than its counterpart in PC, which replicates the findings of Islam and colleagues.[Citation32] However, a significant difference was not found in this study, likely due to the smaller sample sizes. The other trend demonstrated that was that cements with larger particle sizes have weaker initial strengths than their counterparts with smaller particles. This trend is comparable to a rheological study which illustrated that both MTA and PC with smaller sizes had faster setting times.[Citation7]
M2 was used in this study as its PSD is similar to commonly acquirable PC enabling greater reproducibility of similar studies. Although M1 has faster setting times, its long-term properties showed no advantages over M2. In fact, the fast setting time of ultrafine PCs can result in thermal cracking as well as chemical shrinkage.[Citation33] Ultrafine PCs also require a greater water-to-cement mixing ratio, or alternatively, become a difficult to handle material (i.e. crumbly).[Citation34] A possible risk is utilizing greater amounts of mixing water will increase solubility of MTA which is a clinically undesirable property.[Citation35]
Although the use of finer cements can reduce the setting time of PC and MTA, consideration of chemical additives are required to overcome the other properties that accompany the reduction in PSD.[Citation6]
An interesting finding was that the d90 for the experimental MTAs was greater than the d90 of the PCs and BO, when it should be less. The use of a weighted average RI is appropriate for d10 and d50, however this approach becomes less accurate for the larger d90 particles. A possible method which could be employed in future studies measuring the PSD of MTA would be to use centrifugal separation, as the density of the BO radiopacifier particles is far greater than those of the PC particles, and to then perform laser diffraction analysis of the separated mixtures. Alternatively, a study could be performed using various PC and BO products with a range of PSDs, which are then combined to create experimental MTA cements, to determine an ideal RI for MTA.In summary, when MTA is assessed in vitro, it should be wet-cured, i.e. submerged in water, to prevent desiccation of the samples. Testing should also be performed in physiological conditions. Reducing the particle size provides initial advantages in CS and FS as well as reported acceleration in setting time.[Citation6] However, this advantage is lost over time and other methods to improve the properties of MTA should be considered.
Acknowledgements
The authors thank SiPowders Pty Ltd for providing the cement powders in this study, and Cement Australia Pty Ltd for assistance with laser diffraction testing. We thank Mingyuan Lu for assistance with strength testing.
Disclosure statement
The authors deny any conflicts of interest.
References
- Torabinejad J, White DJ, Tooth filling material and method of Use. WIPO Patent Publication WO 94/24955. November 1994.
- Fridland M, Rosado R. Mineral trioxide aggregate (MTA) solubility and porosity with different water-to-powder ratios. J Endod. 2003;29:814–817.
- Gurney LR, Bentz DP, Sato T, et al. Reducing set retardation in high-volume fly ash mixtures with the use of limestone. Transport Res Rec. 2012;2290:139–146.
- Camilleri J, Gandolfi MG. Evaluation of the radiopacity of calcium silicate cements containing different radiopacifiers. Int Endod J. 2010;43:21–30.
- Camilleri J. Evaluation of the physical properties of an endodontic Portland cement incorporating alternative radiopacifiers used as root-end filling material. Int Endod J. 2010;43:231–240.
- Ha WN, Bentz DP, Kahler B, et al. D90: The strongest contributor to setting time in mineral trioxide aggregate and Portland cement. J Endod. 2015;41:1146–1150.
- Ha WN, Nicholson T, Kahler B, et al. Methodologies for measuring the setting times of mineral trioxide aggregate and Portland cement products used in dentistry. Acta Biomater Odontol Scand. 2016;2:25–30.
- Ana IA, Chiara FF, Vincent AH. Measurement of particle size distribution in Portland cement powder: analysis of ASTM round robin studies. Cem Concr Aggr. 2004;26:1–11.
- International Organization for Standardization. Dentistry: water-based cements. International standard; ISO 9917-1. 2nd ed. Geneva: ISO; 2007.
- Porter ML, Berto A, Primus CM, et al. Physical and chemical properties of new-generation endodontic materials. J Endod. 2010;36:524–528.
- Holt DM, Watts JD, Beeson TJ, et al. The anti-microbial effect against Enterococcus faecalis and the compressive strength of two types of mineral trioxide aggregate mixed with sterile water or 2% chlorhexidine liquid. J Endod. 2007;33:844–847.
- Gandolfi MG, Iacono F, Agee K, et al. Setting time and expansion in different soaking media of experimental accelerated calcium-silicate cements and ProRoot MTA. Oral Surg Oral Med Oral Pathol Oral Radiol Endod. 2009;108:e39–e45.
- Aggarwal V, Jain A, Kabi D. In vitro evaluation of effect of various endodontic solutions on selected physical properties of white mineral trioxide aggregate. Aust Endod J. 2011;37:61–64.
- International Organization for Standardization. Particle size analysis - Laser diffraction methods. In: International Standard; ISO 13320:2009. Geneva: ISO; 2009.
- Malvern Instruments Ltd. Mie theory – The first 100 years [Internet]. 2010; [cited 2016 June 12]. Available from: http://www.atascientific.com.au/publications/wp-content/uploads/2011/06/Mie-Theory-the-first-hundred-years-MRK1304-02.pdf.
- Ha WN, Kahler B, Walsh LJ. Particle size changes in unsealed mineral trioxide aggregate powder. J Endod. 2014;40:423–426.
- Ha WN, Shakibaie F, Kahler B, et al. Deconvolution of the particle size distribution of ProRoot MTA and MTA Angelus. Acta Biomater Odontol Scand. 2016;2:7–11.
- Rawle A, Basic principles of particle size analysis [Internet]. 2000; [cited 2016 June 12]. Available from: http://www.rci.rutgers.edu/∼moghe/PSD%20Basics.pdf.
- Polyanskiy M, RefractiveIndex.INFO - Refractive index database [Internet]. 2015; [cited 2016 March 10]. Available from: http://refractiveindex.info/.
- Malvern Instruments. In: Sample dispersion & refractive index guide. [Internet]. 1997; [cited 2016 June 12]. Available from: https://www.scribd.com/doc/295050478/Refractive-Index-Guide.
- Phelly Materials Inc. Bismuth oxide [Internet]. 2015; [cited 2016 March 10]. Available from: http://www.phelly.com/bi2o3/.
- International Organization for Standardization. Dentistry – polymer-based restorative materials. In: International standard; ISO 2009. 4th ed. Geneva: ISO; 2009
- Nekoofar MH, Davies TE, Stone D, et al. Microstructure and chemical analysis of blood-contaminated mineral trioxide aggregate. Int Endod J. 2011;44:1011–1018.
- Basturk FB, Nekoofar MH, Gunday M, et al. The effect of various mixing and placement techniques on the compressive strength of mineral trioxide aggregate. J Endod. 2013;39:111–114.
- Torabinejad M, Hong CU, McDonald F, et al. Physical and chemical properties of a new root-end filling material. J Endod. 1995;21:349–353.
- Saghiri MA, Lotfi M, Saghiri AM, et al. Effect of pH on sealing ability of white mineral trioxide aggregate as a root-end filling material. J Endod. 2008;34:1226–1229.
- Shokouhinejad N, Nekoofar MH, Iravani A, et al. Effect of acidic environment on the push-out bond strength of mineral trioxide aggregate. J Endod. 2010;36:871–874.
- Kayahan MB, Nekoofar MH, Kazandag M, et al. Effect of acid-etching procedure on selected physical properties of mineral trioxide aggregate. Int Endod J. 2009;42:1004–1014.
- Nekoofar MH, Stone DF, Dummer PM. The effect of blood contamination on the compressive strength and surface microstructure of mineral trioxide aggregate. Int Endod J 2010;43:782–791.
- Sluyk SR, Moon PC, Hartwell GR. Evaluation of setting properties and retention characteristics of mineral trioxide aggregate when used as a furcation perforation repair material. J Endod. 1998;24:768–771.
- Eid AA, Komabayashi T, Watanabe E, et al. Characterization of the mineral trioxide aggregate-resin modified glass ionomer cement interface in different setting conditions. J Endod. 2012;38:1126–1129.
- Islam I, Chng HK, Yap AU. Comparison of the physical and mechanical properties of MTA and portland cement. J Endod. 2006;32:193–197.
- Bentz DP, Garboczi EJ, Haecker CJ, et al. Effects of cement particle size distribution on performance properties of portland cement-based materials. Cem Concr Res. 1999;29:1663–1671.
- Vogt C, Ultrafine particles in concrete: Doctoral thesis. Royal Inst of Technology, Stockholm; 2010.
- Cavenago BC, Pereira TC, Duarte MA, et al. Influence of powder-to-water ratio on radiopacity, setting time, pH, calcium ion release and a micro-CT volumetric solubility of white mineral trioxide aggregate. Int Endod J. 2014;47:120–126.