
ABSTRACT
Water is one of the most important natural resources without which humans cannot survive. Although efforts have been geared toward ensuring an adequate water supply, potable water shortages continue to persist. This paper, therefore, analyses water demand at a local scale to enhance policymakers’ ability to make informed decisions on water demand management. The paper specifically probes the influence of demographic and socio-economic factors on household water demand in Ngamiland District of Botswana. Informed by neo-classical economic theory of supply and demand, a cross-sectional survey of 497 households was undertaken in Maun and Gumare villages. Household survey data collection was done using interview schedules and key informant interviews. The results revealed that gender showed a positive association with household’s monthly water demand, (X2 = 14.961; ρ < 0.05). The result of Spearman’s rank correlation test showed that household income and household size were the significant determinants of water demand. Household size was found to be the most variable influencing demand at a significant but moderate positive correlation with monthly water demand, rs = 0.422 and ρ < 0.05. The paper argues that policymakers might take into consideration the socio-economic parameters, which have a significant influence on water use and demand to implement proper demand management strategies.
Introduction
Freshwater is a vital resource in sustaining humanity, functioning of the ecosystems, and supporting economic development (Connor, Citation2015; Salam, Citation2020). Developing countries face notable challenges in managing increasing water demand due to industrialization, population growth, urbanization, and climate change (Gleick et al., Citation2002; Kenway et al., Citation2015; Kusangaya, Warburton, Van Garderen, & Jewitt, Citation2014; Zhang et al., Citation2021). The growing water demand has led governments and private water utilities to implement Integrated Water Resource Management (IWRM) through which demand-side options are employed in combination with supply solutions to address water shortages (Inman & Jeffrey, Citation2006; Mersha, Masih, De Fraiture, Wenninger, & Alamirew, Citation2018).
The Sustainable Development Goals (SDGs) aimed at being fully achieved by 2030 comprise 17 SDGs and 169 targets. Specifically, SDG 6, which aims to “ensure availability and sustainable management of water and sanitation for all,” calls for clean water and sanitation for all people (United Nations-Water, Citation2018). Despite efforts to lessen demand and improve access to water, 784 million people around the world are without access to clean water (World Water Day, Citation2021). Sub-Saharan Africa’s population is estimated to increase from 1.1 billion in 2020 to 2.1 billion in 2050 (Kaneda, Falk, & Patierno, Citation2021). The rapid population increase will exacerbate domestic water demand.
Botswana is equally faced with increased water demand due to population growth. With its current annual growth rate of 1.94%, Botswana’s population has increased from 650 832 people in 1968 to almost 2.4 million in 2021 (World Population Review, Citation2021). In addition to population growth, the country’s mining, agricultural and tourism sectors contribute to high water demand (Botswana National Water Master Plan Review, Citation2006; Molokwane, Citation2018). As the pressure for water demand and supply increases, the recognition of factors influencing household water demand attracts more attention as this might assist policymakers in formulating and implementing policies that aim at addressing the imbalance between water demand and supply. Several studies on water resources management and other water-related issues have been conducted in Ngamiland District and surrounding areas (Mogomotsi, Mogomotsi, & Mosepele, Citation2020; Murray-Hudson, Wolski, & Ringrose, Citation2006; Setlhogile & Harvey, Citation2015; Swatuk & Motsholapheko, Citation2008). However, there is a dearth of understanding of research on the influence of household-related factors on residential water demand in Ngamiland District, Botswana. This paper, therefore, seeks to determine the influence of demographic and socio-economic factors on household water demand in Ngamiland District, Botswana.
Theoretical framework
This paper is premised on the neo-classical economic theory of supply and demand as envisaged by Alfred Marshall in Citation1890. The key tenet of the supply and demand theory is on the effects of perception of the usefulness of products on market forces, that is, supply and demand. On the one hand, Marshall’s (Citation1892) opines that at high prices, producers tend to supply more with a decrease in consumers’ demand. On the other hand, low prices lead to an increase in consumers’ demand thus, producers reduce supply. Based on Marshall (Citation1892) the theory has five assumptions. The first assumption talks about choices on economic issues having always have made rationally, based on complete information about a product or service; the second one alludes to consumers comparing goods and making a final decision based on the perceived utility. The third imagines a consumer who capitalizes on the satisfaction using the product, whereas the producer aims at maximizing profits, the market equilibrium is attained when both the customer and producers achieve their respective goals of consumer satisfaction and profit maximization (Dutt, Citation2006; Gowdy, Citation2020; Kaufman, Citation2007; List, Citation2004).
In the context of this paper and all things being equal, water demand decreases when suppliers increase the price. Water customers in response reduce water use and change unnecessary water use behaviors. At lower prices of water, people tend to buy and use water in large quantities, but there is a limit on how much water anybody can use. The world population and standard of living continue to increase, as a result, this may lead to water shortages to meet various purposes. Therefore, charging prices that reduce consumption assist in water resource sustainability, and upholds the Principle 4 that water is an economic good as stated in the Dublin Principles.
Residential water involves both indoor and outdoor water uses (Daw, Ali, & Toriman, Citation2021; Wentz & Gober, Citation2007). Two principal categories of variables that influence demand are utility-controlled, and non-utility controlled (environmental) variables (Daw et al., Citation2021; Gegax, McGuckin, & Michelsen, Citation1998). Utility-controlled variables comprise water price, rate structures, conservation programs, such as water restrictions and public education (González-Gómez & García-Rubio, Citation2018). Non-utility-controlled variables involve climate factors (rainfall and temperature), socio-economic (household income and size, dwelling type of households, home technologies, and other factors), and demographic factors (age, gender, etc.) (Abu-Bakar, Williams, & Hallett, Citation2021; Kenney, Goemans, Klein, Lowrey, & Reidy, Citation2008; Willis, Stewart, Panuwatwanich, Williams, & Hollingsworth, Citation2011). This study narrowly focuses on the non-utility-controlled factors comprising demographic and socio-economic factors of residential water demand.
Methodology
Description of the study area
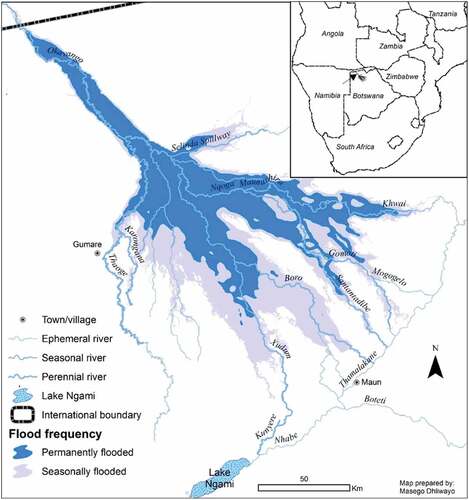
The study was conducted in Ngamiland District, which is situated in the north-western part of Botswana (). The district covers an area of 109, 130 km2 and has a population of 158, 104 (Statistics Botswana, Citation2014). Ngamiland District is under the administration of the North-West District Council. It is divided into two sub-district authorities, Maun sub-District Authority and Okavango sub-District Authority, administered from Maun and Gumare, respectively. Maun village is the district headquarters and has a population of 58, 877 (Statistics Botswana, Citation2014). Tourism and livestock rearing are some of the main sectors in the district (Motsholapheko, Kgathi, & Vanderpost, Citation2011; Motsholapheko & Ngwenya, Citation2020). The Okavango River and its ecosystem resources are vital sources of livelihood for local people (Kgathi et al., Citation2006; Motsholapheko & Ngwenya, Citation2020). People in Ngamiland District also rely on both aquatic and terrestrial resources for transportation, fishing, handicraft materials, reeds, employment, etc. (Kgomotso & Swatuk, Citation2006). The study focuses on Maun in the southern (distal) part of the Okavango Delta and Gumare in the north-western part (). Both villages were selected as study sites because they are among the areas experiencing high water demand in the country.
Figure 1. Map showing the study sites (Source: Okavango Research Institute, University of Botswana).
Study design
This paper adopted the cross-sectional design and mixed-method approaches. The cross-sectional design provides a snapshot of the scenarios and characteristics associated with the population being studied at a specific point in time (Levin, Citation2006; Spector, Citation2019). A mixed-method approach overcomes the limitations of the single-method approach and provides more comprehensive and stronger results (Spector, Citation2019). Based on Punch (2014) mixed-method approach is a combination of qualitative and quantitative and it provides a more understanding of the research problem. The quantitative approach entails the collection of close-ended data that can be analyzed statistically (Creswell, Klassen, Plano Clark, & Smith, Citation2011; Spector, Citation2019). Therefore, in this paper quantitative data were collected using a household interview schedule structured to draw links between the dependent and independent variables comprising the household’s monthly water demand and demographic and socio-economic variables, respectively. In Creswell (Citation2009) opinion a qualitative approach is the collection of open-ended data that focus on realities that are interpreted by the researcher (Creswell, Citation2009; Guest, Namey, & Chen, Citation2020). Hence, qualitative data were collected using household interview schedules and key informant interview guides, which were designed to explore the subject matter. The use of a qualitative research approach helps to understand the reasons and values that influence people’s perceptions about water use and everyday activities (Kolawole, Citation2010).
Sampling and sample size
This paper used both probability and non-probability sampling techniques. A multistage sampling procedure was used to select respondents in the study. Firstly, Ngamiland District was purposively selected because it is one of the areas affected by high water demand in Botswana (Botswana Water Statistics, Citation2009; Gondo, Kolawole, Mbaiwa, & Motsholapheko, Citation2020; Kujinga, Vanderpost, Mmopelwa, & Wolski, Citation2014; Moffat, Motlaleng, & Thukuza, Citation2011). Maun and Gumare were selected because they are the major villages in the district and the most affected by water demand. Sample size was determined at a confidence level of 95% and a margin of error of plus/minus five (±5).
A total sample of 497 households comprising 262 and 235 households for Maun and Gumare, respectively, was derived. A list of 26 wards in Maun and 7 wards in Gumare was obtained from the administration authorities of both settlements. The wards were stratified into two categories, namely, serviced land mainly constituting government and parastatal staff housing and non-serviced land, which comprised private housing. Notably, there are water supply, sewage lines, and storm water drainage systems in areas designated as ‘serviced land’, while such infrastructures are lacking in non-serviced land.
While three of the 26 wards are situated in serviced lands, 23 of them are in the non-serviced area. Gumare has a total of seven wards. While three of the wards are in the serviced area, four of them are located in the non-serviced area. One ward was randomly selected from the serviced wards in both settlements. Non-serviced wards were further stratified into three categories of ‘small,’ ‘medium,’ and ‘large’ based on the land coverage and population of the wards. One ward was selected randomly from each category using a research randomizer giving a total of three non-serviced wards selected in each of the two villages. In all, four wards were selected for sampling in each village. A household listing was conducted in the study areas and households interviewed were randomly selected. A sampling of households was done proportional to the number of households in each ward.
Data collection
The survey was conducted with an aim to obtain exclusive data on the household attributes, such as demographic variables (gender, age, education level, etc.) and socio-economic variables (employment status, household income, household size, household ownership, etc.), which influence water demand. Information on the household’s monthly water demand (which was measured as the total quantity of monthly water consumption by the household) was also collected. A detailed household interview schedule and the key informant interview guide were prepared in both English and Setswana languages. The target respondents were the household heads or adults above 18 years of age who were familiar with household water practices.
The study ascribed 20 liters of water as the standard measurement of household water consumption per individual household member per day. The use of meters was not considered for this study because some of the meters were inefficient and some of the respondents did not know how to read meters nor calculate monthly bills from the data extracted from their meters. A household with water system connections from piped water networks was the selection criterion used to interview households. Households using sources other than the piped network as their main source of water were excluded from the sample. A household interview schedule was administered in 497 randomly selected households from January to February 2020. A total of 497 households were, therefore, interviewed.
Data analysis
Descriptive statistics (such as frequency, percentage, mean, and standard deviation) were used to summarize the data. The normality test was undertaken using the Shapiro–Wilk test and it indicated that the data was not normally distributed. Therefore, non-parametric statistical tools (such as the Chi-square test of independence and Spearman’s correlation test) were used to test the associations and relationships between independent variables (demographics and socioeconomics), and dependent variable Y (households’ monthly water demand). During the statistical data analysis, outliers were dealt with using the square root transformations. This was done to normalize skewed distribution of the data.
Results and discussion
Demographic attributes of respondents and water demand
Most of the household heads (75.7%) were females (). The results are supported by the Statistics Botswana (Citation2014), which estimates 92.3 males per 100 females countrywide. Sex ratios of Ngamiland East and Ngamiland West were also estimated at 88.8 and 80.2 males per 100 females, respectively (Statistics Botswana, Citation2014).
Table 1. Gender and age group of the respondents (n = 497)
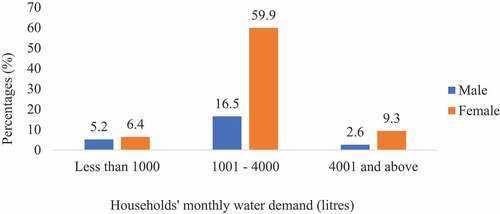
shows the percentage distribution of gender and households’ monthly water demand. Results revealed that most of the females (60%) used between 1001 and 4000 liters of water per month. In contrast, 16.5% of the males used the same quantities within the same period. Also, 9.3% of the females and 2.6% of the males stated that they used 4001 liters and above per month. Overall, the results revealed that females used more water as compared to their male counterparts. This is probably because females carry out most of the household water-related activities as they are the caretakers or homemakers. Pearson Chi-Square (X2) test of independence was used to determine the association between the households’ monthly water demand and gender of the household head. Results revealed that there is a significant association between the gender of the respondents and households’ monthly water demand (X2 = 14.961; ρ < 0.05). This result buttresses previous studies, which have shown that the gender has a significant association with household water demand (Fielding, Russell, Spinks, & Mankad, Citation2012; Jordán-Cuebas et al., Citation2018; Joshi, Citation2020; Makki, Abd-El-Khalick, & BouJaoude, Citation2003; van Koppen, Citation2001). For example, a study by Makki et al. (Citation2003) showed that females are likely to take long baths compared to males because they tend to consume more water than their male counterparts as they are responsible for carrying out most household water-related chores. Similarly, Weng and Nitivattananon (Citation2007) observed that Malaysian women are the main water managers in homes, having a great influence on water conservation strategies.
Figure 2. Gender of the respondents and households’ monthly water demand.
Results of the study also indicated that the average age of the household heads was 41.6 years (SD = ±14.5) (). Results indicated that 32.6% of the respondents aged 30–40 years. This analysis showed that most of the household heads were still youths. Only a few (13.1%) of the household heads aged 63 years and above. shows the distribution of respondents’ age group and households’ monthly water demand. The results showed that 3.4% of those who demanded less than 1000 liters were less than 29 years. Almost 30% of the respondents demanded between 1001 and 4000 liters of water aged between 30 and 39 years. However, results suggested that most household heads were aged between 30 and 39 years demanded more water than any other age group (). Results showed that most of the households (76.5%) demanded between 1000 and 4000 liters of water per month.
Figure 3. Age of the respondents and households’ monthly water demand.
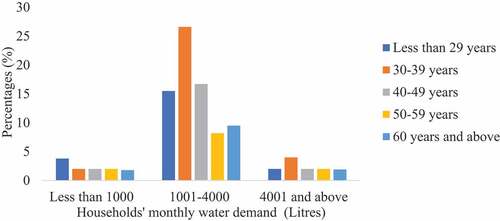
A Spearman’s correlation test was performed to analyze the relationship between households’ monthly water demand and a household heads’ age groupings. Although previous studies showed that age had a significant relationship with water demand (Abu-Bakar et al., Citation2021; Dale et al., Citation2009; Kenney et al., Citation2008), the test revealed that there was a very weak but positive relationship between the age groups and households’ monthly water demand (rs = 0.045 and ρ > 0.05). For example, findings by Balling, Gober, and Jones (Citation2008) and Schleich and Hillenbrand (Citation2009) revealed that although older people are more careful when using water compared to children who tend to play with water, the former use more water as compared to other age groups because they spend most of their time at home. Gondo and Kolawole (Citation2019) also showed that age influenced rural households’ water management decisions in the Okavango Delta. The results of this study differ from other studies’ because most of the households consisted of respondents who were between 30 and 39 years (a combination of youth and adults).
Results indicated that the average number of years spent in school by household heads was 10 (SD = ± 4.8) (). The majority (44.1%) of the household heads had secondary education at Junior Certificate (JC) or Botswana General Certificate of Secondary Education (BGCSE) level. The survey results also show that 27.2% of the respondents had tertiary education (certificate, diploma, bachelor’s degree, and master’s degree). While about 18% of the respondents had primary qualifications, 2.2% attended non-formal education. Nonetheless, 8.9% of them did not attend any form of education at all. Generally, most (88.9%) household heads in the study area acquired formal education. In this study, 27.2% of the respondents in both Maun and Gumare had tertiary education qualifications.
Table 2a. Socio-economic attributes of the respondents (n = 497)
presents the relationship between education level of the respondents and monthly household water demand. Results showed that 1.4 and 8.2% of the households with non-formal the education demanded less than 1000 liters and 1000–4000 liters, respectively. Five percent of the respondents with secondary education demanded less than 1000 liters, 33.4% demanded 1001–4000 liters and 5.6% demanded 4001 and above liters. Two percent of the respondents with tertiary education demanded less than 1000 liters, 22.5% demanded 1001–4000 liters, and only 2.6% demanded 4001 and more liters of water. Generally, the respondents with secondary education demanded more quantities of water.
Figure 4. Education level of the respondents and households’ monthly water demand.
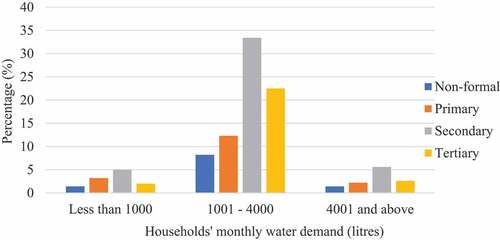
Chi-Square test of independence showed no significant association between households’ water demand and education level of the household heads, (X2 = 10.069; ρ > 0.05). The result of Spearman’s correlation test indicated that there is a very weak but positive correlation (rs = 0.032 and ρ > 0 .05) between households’ monthly water demand and education levels of household heads. This result supports that of Dagnew (Citation2012), which found that education level of household heads did not have significant effects on water demand in Northwestern Ethiopia. Similarly, Salman, Al-Karablieh, and Haddadin (Citation2008) discovered that the impact of education level on household water demand is insignificant, although the per capita model showed a slight decrease as education level improves. In contrast to these findings, Wolters (Citation2014) reports that higher education levels correlate with more water demands. Higher. Moreover, some studies have shown that higher education level is often associated with improvement in an individual’s lifestyle (Abu-Bakar et al., Citation2021; Babel, Gupta, & Pradhan, Citation2007; Nauges & Whittington, Citation2010).
Socio-economic characteristics of respondents and water demand
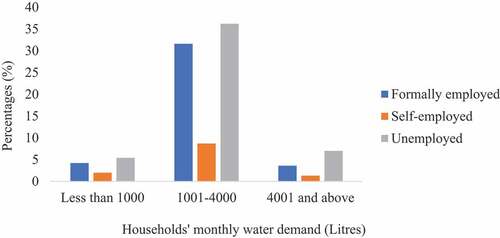
This subsection presents the socioeconomic attributes of household heads and their influence on water demand (). The results revealed that 39.2% percent of the household heads had formal employment. Approximately, 11.5% of them were self-employed. Most (49.3%) of the household heads were unemployed. Among household heads who demanded less than 1000 liters, 5.4% of them were unemployed while 4.2 and 2% were formally employed and self-employed, respectively (). The majority (76.5%) of the respondents demanded between 1001 and 4000 liters of water. Chi-Square test revealed that there was no significant association between employment status and households’ monthly water demand, (X2 = 4.656; ρ > 0.05).
Figure 5. Employment status of the respondents and households’ monthly water demand.
Analysis shows that the average monthly income of respondents is BWP2, 357.70Footnote1 (SD = ± 4,758.9). About 39.3% of the employed household heads earned BWP5, 001.00 and above per month (). The large value of the standard deviation may have been influenced by the large variation between the minimum and maximum monthly income of household heads. The results of the Spearman’s correlation test indicated that there is a very weak positive but correlation (rs = 0.096 and ρ < 0.05) between monthly water demand and the level of income of the household heads. This implies that an increase in a household’s monthly income might engender an increase in the volume of water demanded by the households because they are probably able to afford the use of high-income water-consuming facilities, such as water closets and showers. These findings are similar to other past studies elsewhere (Arbues & Villanua, Citation2006; Gaudin, Citation2006; Gondo et al., Citation2020; Schleich & Hillenbrand, Citation2009).
Even though efficient water-consuming facilities could be purchased, households may still fail to control their water misuse behaviors (Grafton, Kompas, To, & Ward, Citation2009; Murwirapachena, Citation2021). In contrast, low-income households are less likely to purchase efficient facilities but may possess money-saving habits. A study conducted in Australia by Willis et al. (Citation2011) found that households with a higher level of income have a higher water demand compared to households with low income. Likewise, Balling and Gober (Citation2007) show that in southern Arizona, a 10% increase in the average household income results in a 3% increase in water use.
Household size and water demand
This subsection analyses the relationships between household size and their influence on water demand ( b). The results showed that the average household size is 5.5 (SD = ± 3.8). This is bigger than Botswana’s average household size of 3.3 persons per household (Statistics Botswana, Citation2014). Analysis indicates that 63% of the households had between 1 and 5 members. While about 26% of them had 6–10 people, 11.3% had 11 members and above ( b).
Table 3 Socio-economic attributes of the respondents (n = 497)
As illustrated in , 9.9% of the households comprising 1–5 people used approximately less than 1000 liters of water. Almost half (49.7%) of the households demanded between 1001 and 4000 liters. The results, however, suggest that households, which demanded above 4000 liters of water, had the highest number of members (11 and above) demanded more water compared to other household sizes. Generally, most of the households demanded between 1001 and 4000 liters. Nevertheless, a study conducted in Germany by Schleich and Hillenbrand (Citation2009) found that household size had a negative impact on per capita demand of water demand.
Figure 6. Household size of the respondents and monthly water demand.
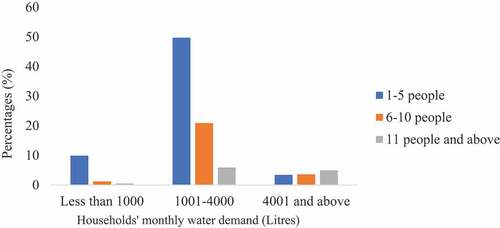
Chi-Square results indicate a significant association between household size and households’ monthly water demand (X2 = 75.465; ρ < 0.05). The results of Spearman’s correlation test indicated that there is a moderate positive and significant correlation between households’ monthly water demand and different household size groups in Ngamiland District (rs = 0.422 and ρ < 0.05). These results suggested that larger households tend to demand more water as compared to smaller size households because they require large volumes of water for activities, such as bathing, cooking, laundry, and others. This finding is supported by Arbués, Villanúa, and Barberán (Citation2010) who indicated that a larger household size implies higher water consumption. Nonetheless, a study in the Okavango Delta found that water consumption was relatively higher in small households than in large ones (Gondo et al., Citation2020). This corresponds with the observation of Sarabia-Sánchez and Rodríguez-Sánchez (Citation2013) who found that large household size implies great consumption, though consumption per capita is not proportional to the number of people since there are economies of scale at work.
Household ownership and water demand
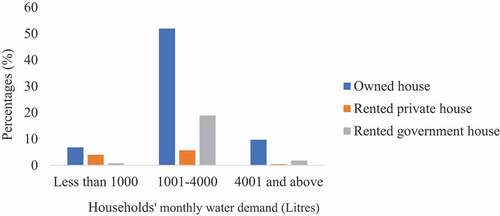
The results revealed that the majority (68.4%) of the respondents owned their personal houses, while 21.5% rented government houses (Table b). The distribution of households in terms of house ownership and households’ monthly water demand are shown in . The results reveal that 6.8% of the respondents who demanded less than 1000 liters of water lived in their personal houses, whereas 4% of those renting private houses demanded the same liters of water. The findings showed that 76.5% of the respondents demanded 1001–4000 liters of water while 51.9% of the respondents in this category owned houses, 18.9 percent of them rented government apartments. Only 5.7% of the household heads rented private apartments. This implies that house owners demanded more water as compared to those who lived in rented apartments (whether private or institutional houses). The results of Spearman’s correlation test indicated that there is a negative and no significant correlation between house ownership and monthly water demand (rs = 0.422 and ρ > 0.05) in the two study locations. This finding, however, contradicts Troy and Randolph (Citation2006) which indicates that there is a positive correlation between house ownership and monthly water demand.
Figure 7. Household ownership of the respondents and monthly water demand.
Conclusion
Rooted in the supply and demand theory, the paper analyzed the influence of demographic and socio-economic factors on household water demand in Ngamiland District, Botswana. Results indicated that about 76% of the respondents were females and that women used more water compared to their male counterparts. Although this finding is consistent with that of other studies as indicated in this paper, it buttresses the importance of women in water use and demand. Policies aimed at reducing demand need to acknowledge the role of women at household level, and aim to balance between the emphasis on pricing, and sensitization of households, particularly those headed women, on the importance of water reuse and recycling to achieve water use efficiency.
Most household heads (44%) were aged between 30 and 39 years, and the results indicated that this age group demanded more water than other groups. This finding differs from other previous studies, and it shows that youth and adults demand for more water, therefore there is need for the government to implement water conservation strategies to curb unnecessary use of water.
The results revealed that the average household size is 5.5 (SD = ± 3.8). The results also suggested that larger households tend to demand more water as compared to smaller size households. This means that a large household in Ngamiland District uses a significant amount of water compared to a small household. The results suggested that household size was the most influencing variable on monthly water demand compared to other independent variables. Therefore, it is imperative for policymakers to consider the variable when formulating water policy and devising conservation strategies. More importantly, results showed that gender, household income, and household size significantly influenced households’ monthly water demand.
Based on the findings, policymakers need to take into consideration the socio-economic parameters, which significantly influence water demand and use in the study area. As this study shows that water pricing reduces water consumption, the government need to promote the implementation of water demand management strategies comprising rainwater harvesting, wastewater re-use, inter alia to reduce household water demand. Such strategies could be reinforced to reduce pressure on water sources. It is also imperative for the government to work hand in hand with all relevant stakeholders most especially communities in devising pragmatic strategies for enhancing water demand management.
Acknowledgments
Authors acknowledge the Regional Initiative in Science Education (RISE) and University of Botswana’s Office of Research and Development for the grant and funding for this study.
Disclosure statement
No potential conflict of interest was reported by the author(s).
Additional information
Funding
Notes
1 US$ 1 is equivalent to BWP 11.08 as at the time of writing this paper.
References
- Online document: https://www.prb.org/understanding-and-comparing-population-projections-in-sub-saharan-africa/ ( Accessed on 18 May 2021).
- Abu-Bakar, H., Williams, L., & Hallett, S. H. (2021). A review of household water demand management and consumption measurement. Journal of Cleaner Production, 292, 125872. doi:10.1016/j.jclepro.2021.125872
- Arbues, F., & Villanua, I. (2006). Potential for pricing policies in water resource management: Estimation of urban residential water demand in Zaragoza, Spain. Urban Studies, 43(13), 2421–2442. doi:10.1080/23570008.2021.1897741
- Arbués, F., Villanúa, I., & Barberán, R. (2010). Household size and residential water demand: An empirical approach. Australian Journal of Agricultural and Resource Economics, 54(1), 61–80. doi:10.1111/j.1467-8489.2009.00479.x
- Babel, M. S., Gupta, A. D., & Pradhan, P. (2007). A multivariate econometric approach for domestic water demand modeling: An application to Kathmandu, Nepal. Water Resources Management, 21(3), 573–589. doi:10.1007/s11269-006-9030-6
- Balling, R. C., & Gober, P. (2007). Climate variability and residential water use in the city of Phoenix, Arizona. Journal of Applied Meteorology and Climatology, 46(7), 1130–1137. doi:10.1175/JAM2518.1
- Balling, R. C., Jr, Gober, P., & Jones, N. (2008). Sensitivity of residential water consumption to variations in climate: An intraurban analysis of phoenix, Arizona. Water Resources Research, 44(10). doi:10.1029/2007WR006722
- Botswana National Water Master Plan Review. (2006). Government of Botswana, ministry of minerals, energy & water resources, department of water affairs. Online document. https://www.worldcat.org/title/national-water-master-plan-review/oclc/75148932. (Accessed on 14th February 2019).
- Botswana Water Statistics. (2009). Botswana water statistics. Gaborone Botswana.
- Connor, R. (2015). The United Nations world water development report 2015: Water for a sustainable world (Vol. 1). UNESCO publishing.
- Creswell, J. W. (2009). Mapping the field of mixed methods research. Journal of Mixed Methods Research, 3(2), 95–108. doi:10.1177/1558689808330883
- Creswell, J. W., Klassen, A. C., Plano Clark, V. L., & Smith, K. C. (2011). Best practices for mixed methods research in the health sciences. In Bethesda (Vol. 2013, 541–545). (Maryland): National Institutes of Health. doi:10.1177/1473325013493540a
- Dagnew, D. C. (2012). Factors determining residential water demand in Northwestern Ethiopia, the case of Merawi (Doctoral dissertation, Cornell University). http://soilandwater.bee.cornell.edu/Research/international/docs/Dessalegn_Chanie_Dagnew-MPS_Project_Paper.pdf
- Dale, L., Fujita, K. S., Vasquez, F., Moezzi, M., Hanemann, M., Guerrero, S., & Lutzenhiser, L. (2009). Price impact on the demand for water and energy in California Residences. California Climate Change Center.
- Daw, M. M., Ali, E. R., & Toriman, M. E. (2021). Determinants of urban residential water demand in Libya. International Journal of Innovation and Sustainable Development, 15(3), 261–279. doi:10.1504/IJISD.2021.115963
- Dutt, A. K. (2006). Aggregate demand, aggregate supply and economic growth. International Review of Applied Economics, 20(3), 319–336. doi:10.1080/02692170600736094
- Fielding, K. S., Russell, S., Spinks, A., & Mankad, A. (2012). Determinants of household water conservation: The role of demographic, infrastructure, behavior, and psychosocial variables. Water Resources Research, 48(10). doi:10.1029/2012WR012398
- Gaudin, S. (2006). Effect of price information on residential water demand. Applied Economics, 38(4), 383–393. doi:10.1080/00036840500397499
- Gegax, D., McGuckin, T., & Michelsen, A. (1998). Effectiveness of conservation policies on New Mexico residential water demand. New Mexico Journal of Science, 38 104–126.
- Giddings, F. H. (1890). Principles of Economics. By Alfred Marshall, Professor of Political Economy in the University of Cambridge. MacMillan & Co., London and New York, 1890. Vol. I, xxviii, pp. 754. The ANNALS of the American Academy of Political Science, I, xxviii(2), 754.
- Gleick, P. H., Burns, W. C. G., Chalecki, E. L., Cohen, M., Cushing, K. K., Mann, A., & Wong, A. K. (2002). The world’s water: the biennial report on freshwater resources 2002-2003. The world’s water: The biennial report on freshwater resources 2002-2003.
- Gondo, R., & Kolawole, O. D. (2019). Sustainable water resources management: Issues and principles of water governance in the Okavango Delta, Botswana. International Journal of Rural Management, 15(2), 198–217. doi:10.1177/0973005219865369
- Gondo, R., Kolawole, O. D., Mbaiwa, J. E., & Motsholapheko, M. R. (2020). Demographic and socio-economic factors influencing water governance in the Okavango Delta, Botswana. Scientific African, 10. doi:10.1016/j.sciaf.2020.e00602
- González-Gómez, F., & García-Rubio, M. A. (2018). Prices and ownership in the water urban supply: A critical review. Urban Water Journal, 15(3), 259–268. doi:10.1080/1573062X.2018.1436187
- Gowdy, J. (2020). Economic theory for environmentalists. CRC Press.
- Grafton, R. Q., Kompas, T., To, H., & Ward, M. B. (2009). Residential water consumption: A cross country analysis. No. 448-2016-33928. doi:10.22004/ag.econ.94823
- Guest, G., Namey, E., & Chen, M. (2020). A simple method to assess and report thematic saturation in qualitative research. PLoS One, 15(5), e0232076. doi:10.1371/journal.pone.0232076
- Inman, D., & Jeffrey, P. (2006). A review of residential water conservation tool performance and influences on implementation effectiveness. Urban Water Journal, 3(3), 127–143. doi:10.1080/15730620600961288
- Jordán-Cuebas, F., Krogmann, U., Andrews, C. J., Senick, J. A., Hewitt, E. L., Wener, R. E., & Plotnik, D. (2018). Understanding apartment end-use water consumption in two green residential multistory buildings. Journal of Water Resources Planning and Management, 144(4), 04018009. doi:10.1061/(ASCE)WR.1943-5452.0000911
- Joshi, D. (2020). Misunderstanding gender in water: Addressing or reproducing exclusion. In Gender, water and development (pp. 135–153). Routledge.
- Kaneda, T., Falk, M., & Patierno, K. (2021). Understanding and comparing population projections in sub-Saharan Africa.
- Kaufman, B. E. (2007). The institutional economics of John R. Commons: Complement and substitute for neoclassical economic theory. Socio-Economic Review, 5(1), 3–45. doi:10.1093/ser/mwl016
- Kenney, D. S., Goemans, C., Klein, R., Lowrey, J., & Reidy, K. (2008). Residential water demand management: Lessons from Aurora, Colorado 1. JAWRA Journal of the American Water Resources Association, 44(1), 192–207. doi:10.1111/j.1752-1688.2007.00147.x
- Kenway, S. J., Binks, A., Lane, J., Lant, P. A., Lam, K. L., & Simms, A. (2015). A systemic framework and analysis of urban water energy. Environmental Modelling and Software, 73, 272–285. doi:10.1016/j.envsoft.2015.08.009
- Kgathi, D. L., Kniveton, D., Ringrose, S., Turton, A. R., Vanderpost, C. H. M., Lundqvist, J., & Seely, M. (2006). The Okavango; a river supporting its people, environment and economic development. Journal of Hydrology, 331(1–2), 3–17. doi:10.1016/j.jhydrol.2006.04.048
- Kgomotso, P. K., & Swatuk, L. A. (2006). Access to water and related resources in Ngamiland, Botswana: Toward a more critical perspective and sustainable approach. Physics and Chemistry of the Earth, Parts A/B/C, 31(15–16), 659–668. doi:10.1016/j.pce.2006.07.004
- Kolawole, O. D. (2010). Inter-disciplinarily, development studies, and development practice. Development in Practice, 20(2), 227–239. doi:10.1080/09614520903564223
- Kujinga, K., Vanderpost, C., Mmopelwa, G., & Wolski, P. (2014). An analysis of factors contributing to household water security problems and threats in different settlement categories of Ngamiland, Botswana. Physics and Chemistry of the Earth, Parts A/B/C, 67-69, 187–201. doi:10.1016/j.pce.2013.09.012
- Kusangaya, S., Warburton, M. L., Van Garderen, E. A., & Jewitt, G. P. (2014). Impacts of climate change on water resources in Southern Africa: A review. Physics and Chemistry of the Earth, Parts A/B/C, 67-69, 47–54. doi:10.1016/j.pce.2013.09.014
- Levin, K. A. (2006). Study design III: Cross-sectional studies. Evidence-based Dentistry, 7(1), 24–25. doi:10.1038/sj.ebd.6400375
- List, J. A. (2004). Testing neoclassical competitive theory in multilateral decentralized markets. Journal of Political Economy, 112(5), 1131–1156.
- Makki, M. H., Abd-El-Khalick, F., & BouJaoude, S. (2003). Lebanese secondary school students’ environmental knowledge and attitudes. Environmental Education Research, 9(1), 21–33. doi:10.1080/13504620303468
- Marshall, A. (1892). Elements of economics of industry (Vol. 1). Macmillan.
- Mersha, A. N., Masih, I., De Fraiture, C., Wenninger, J., & Alamirew, T. (2018). Evaluating the impacts of IWRM policy actions on demand satisfaction and downstream water availability in the upper Awash Basin, Ethiopia. Water, 10(7), 892. doi:10.3390/w10070892
- Moffat, B., Motlaleng, G. R., & Thukuza, A. (2011). Households’ willingness to pay for improved water quality and reliability of supply in Chobe ward, Maun. Botswana Journal of Economics, 8(12), 45–61.
- Mogomotsi, G. E., Mogomotsi, P. K., & Mosepele, K. (2020). Legal aspects of transboundary water management: An analysis of the intergovernmental institutional arrangements in the Okavango River Basin. Leiden Journal of International Law, 33(2), 391–408. doi:10.1017/S0922156519000736
- Molokwane, T. (2018). Assessing the demand for public private partnerships in Botswana’s Water Utilities Corporation: The case of Lobatse Management Centre. International Conference on Public Administration and Development Alternatives 04-06 July 2018, Stellenbosch University, Saldahna Bay, South Africa. http://hdl.handle.net/10386/2472
- Motsholapheko, M. R., Kgathi, D. L., & Vanderpost, C. (2011). Rural livelihoods and household adaptation to extreme flooding in the Okavango Delta, Botswana. Physics and Chemistry of the Earth, Parts A/B/C, 36(14–15), 984–995. doi:10.1016/j.pce.2011.08.004
- Motsholapheko, M. R., & Ngwenya, B. N. (2020). Access to water resources and household vulnerability to malaria in the Okavango Delta, Botswana. African Handbook of Climate Change Adaptation, 1–20. doi:10.1007/978-3-030-42091-8_165-1
- Murray-Hudson, M., Wolski, P., & Ringrose, S. (2006). Scenarios of the impact of local and upstream changes in climate and water use on hydro-ecology in the Okavango Delta, Botswana. Journal of Hydrology, 331(1–2), 73–84. doi:10.1016/j.jhydrol.2006.04.041
- Murwirapachena, G. (2021). Understanding household water-use behaviour in the city of Johannesburg, South Africa. Water Policy, 23(5), 1266–1283. doi:10.2166/wp.2021.157
- Nauges, C., & Whittington, D. (2010). Estimation of water demand in developing countries: An overview. The World Bank Research Observer, 25(2), 263–294. doi:10.1093/wbro/lkp016
- Salam, A. (2020). Internet of things for water sustainability. In Internet of things for sustainable community development (pp. 113–145). Cham: Springer.
- Salman, A., Al-Karablieh, E., & Haddadin, M. (2008). Limits of pricing policy in curtailing household water consumption under scarcity conditions. Water Policy, 10(3), 295–304. doi:10.2166/wp.2008.040
- Sarabia-Sánchez, F. J., & Rodríguez-Sánchez, C. (2013). Attitudes towards saving water, household structural characteristics and water consumption. Psychology, 4(2), 115–137. doi:10.1080/21711976.2013.10773869
- Schleich, J., & Hillenbrand, T. (2009). Determinants of residential water demand in Germany. Ecological Economics, 68(6), 1756–1769. doi:10.1016/j.ecolecon.2008.11.012
- Setlhogile, T., & Harvey, R. (2015). Water governance in Botswana, policy briefing 144. Governance of Africa’s Resources Programme, SAIIA.https: www.cigionline.org/. Accessed 16 May 2021).
- Spector, P. E. (2019). Do not cross me: Optimizing the use of cross-sectional designs. Journal of Business and Psychology, 34(2), 125–137. doi:10.1007/s10869-018-09613-8
- Statistics Botswana. (2014). Population and housing census 2011 analytical report. Government: Statistics Botswana.
- Swatuk, L. A., & Motsholapheko, M. (2008). Communicating integrated water resources management: From global discourse to local practice–chronicling an experience from the Boteti River sub-basin, Botswana. Physics and Chemistry of the Earth, Parts A/B/C, 33(8–13), 881–888. doi:10.1016/j.pce.2008.06.037
- Troy, P. N., & Randolph, W. (2006). Water consumption and the built environment: A social and behavioral analysis. Sydney, New South Wales, Australia: City Futures Research Centre.
- United Nations-Water (2018). Sustainable development goal 6: synthesis report on water and sanitation. Online document: https://sustainabledevelopment.un.org/content/documents/19901SDG6_SR2018_web_3.pdf (Accessed 20 April 2019)
- van Koppen, B. (2001). Gender in integrated water management: An analysis of variation. In Natural Resources Forum (Vol. 25, 4, pp. 299–312). Oxford, UK: Blackwell Publishing Ltd.
- Weng, C. N., & Nitivattananon, V. (2007). The role of gender in domestic water conservation in Malaysia. Malaysian J Environ Manage, 8, 109–129. http://www.ems-malaysia.org/mjem/index.html
- Wentz, E. A., & Gober, P. (2007). Determinants of small-area water consumption for the city of Phoenix, Arizona. Water Resources Management, 21(11), 1849–1863. doi:10.1007/s11269-006-9133-0
- Willis, R. M., Stewart, R. A., Panuwatwanich, K., Williams, P. R., & Hollingsworth, A. L. (2011). Quantifying the influence of environmental and water conservation attitudes on household end use water consumption. Journal of Environmental Management, 92(8), 1996–2009. doi:10.1016/j.jenvman.2011.03.023
- Wolters, E. A. (2014). Attitude–behavior consistency in household water consumption. The Social Science Journal, 51(3), 455–463. doi:10.1016/j.soscij.2013.10.003
- World Population Review (2021). 2021 world population by country. World Population Review. Online document: https://worldpopulationreview.com/ (Accessed on 10 May 2021).
- World Water Day (2021). 10 facts about the water crisis. Online document: https://lifewater.org/blog/world-water-day-2021/#:~:text=A%20staggering%20784%20million%20people,world%2C%20and%20make%20a%20difference (Accessed on 18 May 2021)
- Zhang, D., Sial, M. S., Ahmad, N., Filipe, A. J., Thu, P. A., Zia-Ud-Din, M., & Caleiro, A. B. (2021). Water scarcity and sustainability in an emerging economy: A management perspective for future. Sustainability, 13(1), 144. doi:10.3390/su13010144