
ABSTRACT
Ponds are known to have greater biodiversity of species. They are the habitats of many aquatic animals and plants. The purpose of the study is to compare the water quality of the Temple Pond to give a reference for conservation management for this aquatic species and help improve water quality and aquatic biodiversity. Temple Pond is located opposite Bara Talab near Main Road of Lohardaga town of Jharkhand. It is a habitat of fishes – mostly carp. For the study of physicochemical parameters of the pond, water samples were collected for three periods of the year, i.e. pre-monsoon (May), monsoon (August), and post-monsoon (November) for two consecutive years (2015–2016). Samples were stored according to the preservation procedure followed by AS/NZS 5667.1:1998, and analysis was done using standard procedure. Major water parameters such as pH (7.20–7.40), Total Hardness (35.60–61.20), Nitrate (mg/L) (1.10–2.40), Chloride (mg/L) (22.00–33.00), Fluoride (mg/L) (0.02–0.04) were recorded low value; however, Dissolved oxygen (D.O) (mg/L) (4.10–6.90) and Biochemical oxygen demand (B.O.D) (mg/L) (2.50–4.20) were little higher than Standard Tolerance limit per classified use of water class depending on various uses of water (ISI-IS: 2296–1982), revealed that the pond is suitable for outdoor bathing (Class-B) and D – Fish culture and aquatic life propagation.
Introduction
India with multifarious ecology has a huge number of freshwater rivers, lakes, wetlands, and ponds in different parts of the country. Water resources and quality of freshwater are the foremost basic need of flourishing ecological diversity and sustainable development. Nowadays, freshwater has become a scarce commodity due to over exploitation, population growth, and also pollution (Arivoli, Dhinamala, Persis, Meeran, & Pandeeswari, Citation2018). Industrial effluents, domestic sewage, and municipal wastes are being continuously added to the freshwater reservoirs affecting the water and changing its physicochemical quality and making it unfit for its uses and fish production (Kupoluyi, Alarape, & Adeyemo, Citation2018; Mushtaq, Singh, Bhat, Dervash, & Hameed, Citation2020; Saha et al., Citation2021).
The chemical, physical, biological, and radiological aspects of water are referred to as water quality (WQ) (Khan et al., Citation2017). Water quality (WQ) studies of any aquatic ecosystem are fundamental to understanding the water resource, and one of the essential features of the water body is how they interact with the surrounding (Pfumbidzai, Citation2014). Nature’s and man’s actions have a significant impact on WQ (Khatri & Tyagi, Citation2015) and are measured concerning the needs of one or more biotic species and any human need or purpose (Johnson et al., Citation1997). Biological activity of soil biota and climate influence litter decomposition (Kumar & Saikia, Citation2021), which influence WQ, mainly B.O.D and D.O. Human health and disease are thought to be influenced by WQ (Salomova, Citation2021). Contrarily, the consumption of polluted water causes several health hazards to mankind (Cabral-Pinto et al., Citation2020; Engwa, Ferdinand, Nwalo, & Unachukwu, Citation2019). Approximately 80% of human population in India suffers from water-borne diseases, resulting in the annual death of about 600,000 persons from diarrhea (Trombadore, Nandi, & Shah, Citation2020). The loss of life and huge pressure on ecology due to polluted and insufficient water have alarmed for the grim situation and warrant immediate actions and strategy for conservation and rejuvenation of water resources (Kumar, Mishra, Taxak, Pandey, & Yu, Citation2020). The degrading WQ challenge infiltration of rainwater and abstraction of surface and groundwater in excess and thereby disturbing the hydrological cycle. Indiscriminate usage of natural resources has caused an imbalance to the environment.
Ponds are tiny, shallow standing water bodies that are part of an ecosystem (Hawes, Howard-Williams, & Sorrell, Citation2014). The maintenance of healthy pond is dependent on the physicochemical properties and biological, and it fluctuates due to a variety of factors such as the source of water, the type of pollution, seasonal fluctuations, and nearby human intervention, all of which affect its quality and, as a result, its suitability for the distribution and production of fish and other aquatic animals (Saha, Mandal, & Sahoo, Citation2017). Aquatic life depends on the water’s physicochemical properties for survival and growth (Dixit, Citation2015). There must be sufficient dissolved oxygen (DO), an optimal pH, and an optimal ion concentration in the pond’s water (Ntengwe & Edema, Citation2008) for successful fish farming. The water in a fishpond should provide the best conditions for the existence of fish and other aquatic organisms (Ngugi, Bowman, & Omolo, Citation2007). The interactions of both the physical and chemical properties of water play a significant role in composition, distribution, abundance, movements, and diversity of aquatic organisms. The biotic component of the pond is made up of a variety of aquatic plants, animals, and microorganisms (Anton-Pardo, Hlaváč, Bauer, & Adámek, Citation2020).
There are many fishponds in Lohardaga. One such fishpond is the Temple Pond, also called the Bouli Talab. The pond is known for fish culture – mainly Catla (Catla catla) Rohu (Labeo rohita) Mrigal (Cirrhinus cirrhosis), silver carps (Hypophthalmichthys molitrix), and common carps. A good WQ leads to healthy ecosystems; thereby improving human well-being, while poor WQ adversely affects both environments and human well-being (Kumara, Sharmab, & Raic, Citation2017). In recent years, the inland water bodies in the Lohardaga city have been subjected to alteration of ecological condition. Moreover, uncontrolled discharge of domestic waste water into the ponds has resulted in the eutrophication of ponds (Sarkar, Ghosh, & Mondal, Citation2020). The entry of the pollutants in the pond enhancement of oxygen demand and nutrient load in the water promoting toxic algal blooms and leading to destabilized aquatic ecosystem (Othman, Dumitrescu, Andreescu, & Andreescu, Citation2018). The concentration of WQ parameters in a pond varies with time due to the differential in anthropogenic activities and natural hindrances (Kumar, Taxak, Mishra, & Pandey, Citation2021). Moreover, the untreated waste water containing organic and inorganic compounds is generated from the domestic households, industries, agricultural runoffs, and are being discharged in the surrounding water bodies (Cao et al., Citation2020) resulting in deterioration of water quality (WQ).
Monitoring of the physicochemical water quality parameters plays a pivotal role in assessing the water environment, ecosystem, hydrochemistry, and ecology, and restoring water quality (Bhat & Pandit, Citation2020; Islam, Nakagawa, Abdullah-Al-Mamun, Siddique, & Berndtsson, Citation2022; Whitehead et al., Citation2018). The current work helps to monitor the water quality of the pond, which will help to improve the biodiversity and its conservation values. Conservation value contributes significantly to regional biodiversity and ecosystem services (Kumar & Saikia, Citation2020) such as maintaining water table, temperature, drinking purposes, domestic and irrigation demand for the city. Favorable water quality maintains the primary production with appropriate levels of secondary and tertiary production (Liu, Yang, & Jiang, Citation2020), which helps in maintaining the balance. The urban pond is an integral part of the city’s environment and growth (Hassall, Citation2014). Due to increasing urbanization, pollutant loads in inland surface water bodies in metropolitan areas have increased dramatically (Kumari, Chowdhury, & Maiti, Citation2018).
Various scientific evaluations have been made during recent years to evaluate the quality of pond water around world globe (Ansari, Gadhia, & Ujjania, Citation2015; Dey, Botta, Kallam, Angadala, & Andugala, Citation2021; Khan et al., Citation2017; Perumal & Gopalsamy, Citation2020); however, no such type of work has been conducted on Bulia Talab (Pond). There is a dearth of information about suitability of pond water for the production of fish, use of water for various purposes in Boulia Talab, Lohardaga. It is therefore important to know about WQ parameters and their management, which have influence on growth and survival of aquatic organisms, suitability of water of the present investigation was to provide data on water chemistry and biological characteristics of the freshwater ponds of in Lohardaga city, Jharkhand, India. Therefore, work on this pond was conducted and the objective of the paper was – “investigate various chemical parameters and compare the water quality of ponds premonsoon (May), monsoon (August), and post-monsoon (November) for two consecutive years – 2015 and 2016. Secondly, the Classification of water class is based on suitability of water uses.
Materials and methods
Study area
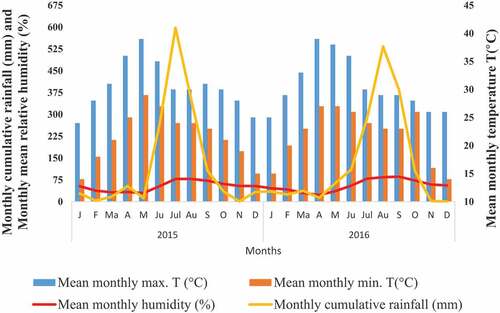
The study area is Bouli Talab located at the heart of the Lohardaga city of Jharkhand. It is situated between 23°26ʹ17.70” N to 23°26ʹ15.63” N latitude and 84°40ʹ58.58” E to 84°40ʹ56.42” E longitude, and the altitude is 200 m above mean sea level (AMSL) (). Water samples (0.5 L) were collected from two different points, the extensive bathing area and another from the other non-disturbed area at a depth of 5–10 cm below the “Bouli Talab” (Temple pond). Lohardaga experiences a warm, humid climate with three well-defined seasons, i.e. summer, winter, and monsoon. The Monsoon sets in by the middle of June and continues till the middle of October. The mean monthly maximum temperature of the city varies from 24.°C to 39°C, while the mean monthly minimum varies from 14.°C to 27°C during the study period (2015–16) (). Lohardaga experienced maximum precipitation of 597.91 mm in July (2015) and 533.32 mm in August (2016).
Figure 1. Map of study area (a) India map (b) District map of Jharkhand showing Lohardaga (c) Bouli Talab situated at Lohardaga and (d) Satellite map (Google earth map) of Bouli Talab.
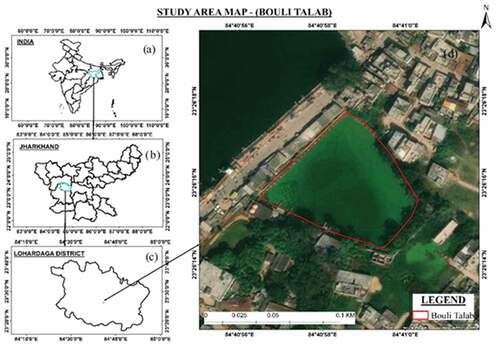
Figure 2. Cumulative monthly rainfall, mean relative humidity and mean maximum and mean minimum temperature of Lohardaga during 2015 − 2016.
Water sampling and analysis
The samples were collected during three periods of a year, i.e. premonsoon (May), monsoon (August), and post-monsoon (November) for two consecutive years; 2015 and 2016. All the samples were stored in sampling kits maintained at 4°C and brought to the laboratory for physicochemical analysis. Samples were stored according to the preservation procedure following AS/NZS 5667.1:1998. Plastic bottles were used for the collection of the samples. The parameters, such as D.O, which could have changed in due course of time, were fixed by adding a series of reagents at the time of sampling. Samples were preserved as indicated by Trivedi, Khatavkar, and Goel (Citation1986) for laboratory analysis. Several water quality parameters (Temperature, pH, Total suspended solids (T.S.S.), Dissolved Oxygen (D.O), Biochemical oxygen demand (B.O.D), heavy metals, mainly iron, zinc, etc.) were analyzed at Environmental Sciences Laboratory, CMPDI, and Ranchi. The analysis was done by the standard methods given by the National Environmental Engineering Research Institute (NEERI, Citation1986) and American Public Health Association’s (APHA, Citation1986).
Results
Physicochemical parameters are considered as one of the essential features to influence the pond environment and have shown temporal differences. All the physicochemical parameters showed clear seasonal patterns, which are very typical of the tropical pond environment. Physicochemical parameters of the pond water displayed different characteristics with seasons (Pre-monsoon, Monsoon, and Post monsoon). The constitution of pond water changes continuously, relying on climatic and seasonal changes and how a pond is used. The air and water temperature were maximum during the premonsoon (summer) and lowest during the post-monsoon (winter). The transparency showed its peak value in the premonsoon period of 2015. More seasonal fluctuations in transparency (21.24–28.47 cm), total hardness (35.60–61.20 ppm), Magnesium Hardness (7.60–31.50), and T.S.S (31.00–43.00 mg/L) were recorded in the pond. However, very few changes were observed in the case of Iron (0.15–0.22 mg/L), Zinc (0.001–0.002 mg/L), and Fluorides (0.02–0.04 mg/L) during seasonal change. Determine the seasonal variation of physicochemical properties of the Temple pond (Bouli Talab); the water sample was analyzed, and the value of these parameters of monsoon, pre-monsoon, and post-monsoon is shown in . The obtained results were compared as per ISI-IS: 2296–1982 tolerance limits. All the water parameters were recorded within the tolerance limits except D.O, which had a little higher value (6.10 and 6.06 mg/L) in premonsoon in 2015 and 2016 (). The B.O.D value was also observed to be a little higher than the tolerance limit in the premonsoon (4.20, 3.60 mg/L) and monsoon (3.10, 3.10 mg/L) period in both studied years. The fluoride concentration was within the permissible limit (1.5 mg/L) as suggested by ISI-IS: 2296–1982. Sulfate (34.00–43.00 mg/L) and silicate (0.92–1.32 mg/L) concentration was high during the rainy season (43, 42, and 1.25, 1.25 mg/L) during the studied period but within the tolerance limit. The premonsoon chloride concentration was higher (31 and 33 mg/L) than in the other two periods.
Figure 3. Seasonal changes in D.O (Figure 3(a), & B.O.D (Figure 3b) during pre- monsoon, monsoon and post- monsoon for 2015–2016 of temple pond (Bouli Talab), Lohardaga.
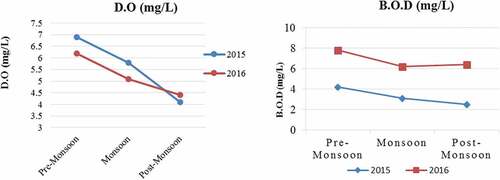
Table 1. Seasonal variation of physicochemical properties of the temple pond (Bouli Talab), Lohardaga.
Based on the tolerance limits, the classifications of water are given as following Class, A – Drinking water source without conventional treatment, after disinfection, B – Outdoor bathing, C – Drinking water source with conventional treatment followed by disinfection, D – Fish culture and wildlife propagation, and Class E – Irrigation, industrial cooling, or controlled waste disposal . Based on the analysis of data and compared with the Standard Tolerance limit of water parameters given by Indian Standard; it was recommended for fish culture in Bouli pond.
Table 2. Standard tolerance limit of water parameters as per classified use of water class A, B, C, D, E depending on various uses of water (Source: Indian standard; ISI-IS: 2296–1982).
Discussion
The present investigation indicated that the mean values of air (34.50; 33.50) and water temperature (33 and 32.50), C.O.D (mg/L) (9.06 and 8); chloride (mg/L) (31 and 33); total hardness (ppm) (59.20 and 61.20) in 2015–16 are higher in pre-monsoon period compare to monsoon and post-monsoon (). Similar trends were observed by Dey et al. (Citation2021), Kumari, Khan, & Lal Thakur (Citation2019) and Harney, Dhamani, and Andrew (Citation2013) in Gudlavalleru engineering college pond, Krishna district, Andhra Pradesh, Motia Lake Reservoir (Himachal Pradesh), and Pindavani Pond of Central India, respectively. However, contrary, the highest mean values of B.O.D (4.59 ppm), C.O.D (86.67 ppm) were observed during monsoon, whereas the lowest values of oxbow lake water transparency (27.00 cm), pH (7.84), D.O (3.63 ppm), and NO2–N (0.01 ppm) contents found during monsoon when jute retting process intensified in the oxbow lake. In the present investigation, the value B.O.D (2.50–4.20) and D.O (4.10–6.90) was high compared to tolerance limit prescribed by the Indian Standard, ISI-IS: 2296–1982. A similar investigation was reported for fish culture in freshwater fishponds in Panchobh village (Darbhanga district) by Rani (Citation2019). The observations of the present study suggest that the fish culture in the freshwater ponds in Bouli Talab is good to take up fish culture practices.
Temperature
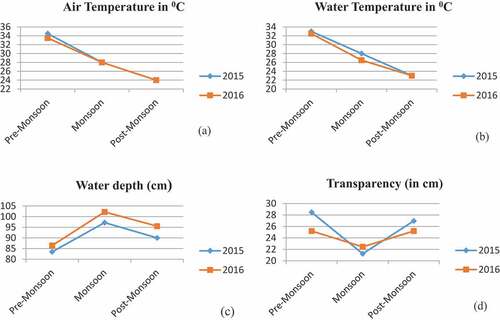
The minimum air temperature (24.00 °C) was observed during post-monsoon in 2015 and 2016; however, the maximum was registered during premonsoon May 2015 (). The observed water temperature values ranged between 23 and 33 and were highest during Premonsoon 2015 (. The maximum water depth was observed during July–August 2016 (Monsoon) ( and maximum transparency (28.47 cm) during premonsoon in 2015 (). In reaction to climate drivers, notably air temperature increasing, surface water temperatures rise worldwide (Kraemer et al., Citation2015). Geographic heterogeneity in surface warming implies that local or regional factors contribute to diversity in lake thermal structure trends (O’Reilly et al., Citation2015). This is because temperature affects the rate of O2 consumption by biota as well as how soluble O2 is in water (warmer water holds less O2 than cooler water). It can strike fish and shrimp metabolism, feeding rates, and the degree of ammonia toxicity. Although the temperature in a pond cannot be controlled, aquatic species adapt their body temperature to the environment and are sensitive to sudden temperature changes. Depending on the species, there is a wide variety of temperatures that might be encountered. When moving fish and shrimp from a tank to a pond, it is necessary to gradually acclimate them to the new environment.
Figure 4. Seasonal climatic variations data of temple pond (Bouli Talab), Lohardaga during 2015–2016 a. (Air Temperature (0C) b. Water Temperature (0C) c. Water depth (cm) and d. Transparency (cm).
pH
pH measures acidity (hydrogen ions) or alkalinity of the water and ranges from 7.20 to 7.60 during monsoon 2016. Variations of pH values in pre-monsoon and post-monsoon are shown in (). Fish with increased mucus on their gill surfaces, odd swimming behavior, fin fraying, damage to the eye lens, and poor phytoplankton and zooplankton development are some of the signs of low pH (Awofolaju, Ogbeide, & Adebayo, Citation2019). Optimal pH levels in the pond should be in the range of 7.5 to 8.5. The pond’s water was found to be neutral during the two years. However, very little high pH value (7.60) was observed during the monsoon season due to the dilution of ions due to rain. pH ranging between 5.0 and 8.5 is best for planktonic growth (Dixit, Citation2015).
Figure 5. Seasonal change of pH (Figure 5.a) and Nitrate concentration (Figure 5.b) during pre monsoon, monsoon and post monsoon for 2015–2016 of Temple pond (Bouli Talab), Lohardaga.
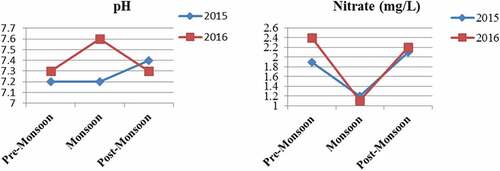
Nitrite (NO2−)
The concentration of nitrate was highest during the summer. Nitrate (mg/L) concentration dramatically changed during the study year (Fig.) Additionally, nitrite (NO2−) kind of nitrogenous substance and intermediate product that arises from feeding and transforming ammonia into nitrate by bacterial activity, can be hazardous to shrimp and fish, as well (Valencia-Castañeda et al., Citation2018). Ingested nitrate diminished hemoglobin oxygen-carrying capacity. An increase in CO2 may decrease the pH to a value below 6.5, which can lead to the toxicity of nitrite through the formation of nitrous acid (HNO2) (Halim et al., Citation2018). Nitrites were poisonous (harmful or deadly) to many fish and shrimp at two ppm and above (Halim et al., Citation2018).
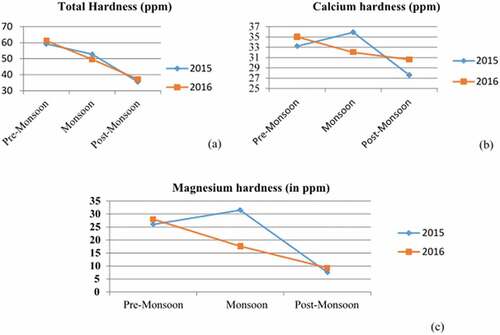
Hardness of water
The quantity of calcium and magnesium in water determines its hardness. Heavy metals like zinc and copper, poisonous to fish and shrimp, can be buffered by hard waters (Alam, Citation2017). Thus, it is an essential factor in keeping pond balance. Variation in hardness in terms of total, (a) in terms of calcium, ) and magnesium, ) shows the minor deviation. The total hardness was found to be high (59.20 and 61.20 ppm) in premonsoon for two consecutive years (2015–2016). The calcium (35.90 ppm) and magnesium (31.50) hardness showed their top value during the 2015 monsoon period. The T.S.S had its maximum value (43.00 mg/L) during the monsoon period in 2016.
Figure 6. Changes in total hardness (Figure 6a), Calcium hardness (Figure 6b) and magnesium hardness (Figure 6c) during pre monsoon, monsoon and post monsoon for 2015–2016 of Temple pond (Bouli Talab), Lohardaga.
Total suspended solids (T.S.S.)
Total suspended solids (T.S.S.) solids in water can be trapped by a filter (Surapati & Mizwar, Citation2020). T.S.S. include silt, rotting plant, and animal debris, as well as industrial waste and sewage (Gangwar, Singh, Singh, & Singh, Citation2013). High quantities of suspended particles can harm stream health and aquatic life in various ways (Crosa, Castelli, Gentili, & Espa, Citation2010). Total suspended solids (T.S.S.) were found to be highest in Monsoon 2016 (43.00 mg/L) and minimum in pre-monsoon 2015 (31.00 mg/L), respectively. The amount of total solids, suspended solids, and dissolved solids present in the pond water is also depending upon the amount of domestic waste water are discharged into the pond (Dey et al., Citation2021).
Dissolved oxygen (D.O)
Dissolved oxygen (D.O) in water is one of the most significant characteristics in aquaculture, along with temperature and pH. Since oxygen (O2) has a direct impact on feed intake, disease resistance, and metabolism, maintaining adequate D.O levels in the water is crucial for optimal production of fish (Begum, Mondal, Ferdous, Zafar, & Ali, Citation2014). A sub-optimal level was very traumatic for fish and shrimp (Qian et al., Citation2012), therefore, essential to keep D.O at optimum levels of above 4.0 ppm. In the present investigation, D.O was recorded as adequate (above 4.0) which is suitable for fish culture as a similar study reported in Panchobh village, Darbhanga district (Rani, Citation2019). Aquatic plants and microscopic algae (phytoplankton) were the principal oxygen producers in ponds. Temperatures were high during the premonsoon season (May), allowing plants to synthesize oxygen through photosynthesis and release it into the pond’s water. Because of phytoplankton photosynthesis and respiration, the dynamic oxygen cycle of ponds has a higher D.O during the day (Baxa et al., Citation2021). As a result of increased energy expenditure when feeding fish and shrimp, the oxygen demand increases (also known as specific dynamic action) (McGaw & Whiteley, Citation2012).
Biochemical oxygen demand (B.O.D)
The pond’s biochemical oxygen demand (B.O.D) might alter the oxygen cycle and the oxygen balance. In order to verify compliance with government-issued water quality permits and earn farm certification, BOD5 may be necessary. Effluents from pond aquaculture usually have a BOD5 of between 5 and 20 mg/L (Mayer, Citation2012). Oxygen depletion increases with B.O.D; hence, the B.O.D was determined to be lowest during this period.
Chemical oxygen demand (C.O.D)
C.O.D is a good indicator of pond health (Ni, Yuan, Liu, & Gu, Citation2018) varies from 6.00 to 9.06. C.O.D was very low in pond water, depicting that there were no soluble organic compounds that come from residual food waste from bottles and cans; antifreeze, emulsified oils were most likely absent in pond water, which might be contributing to escalated C.O.D concentrations. However, the C.O.D was lowest during the monsoon period of 2016. In general, C.O.D is usually higher than B.O.D because more organic compounds can be chemically oxidized than biologically oxidized, as observed in all studied seasons ().
Phosphate
Ponds with high phosphate levels suffer from green water and blanket weed. If phosphate levels are kept low, algae growth in a pond will be restricted (Goldsmith, Citation2018). In the present study, it ranged from 0.17 to 0.25 mg/L. Phosphate levels over 0.4 mg/L and over 1.5 mg/L in fishpond water in Israel were not useful in increasing the productivity of fishponds (Hepher & Pruginin, Citation1981).
Sulfate
The concentration of sulfate in the ponds in the present study varied from 34.00 − 42.00 mg/L, which is higher than the value recorded (0.66–1.09 mg/L) in the pond of Okada (Ehiagbonare & Ogunrinde, Citation2010), however lower than the value recorded(42.46–57.36 mg/L) than Mishra (Citation1991). Threshold concentrations of sulfate in drinking-water 250–500 mg/L (median 350 mg/L) for sodium sulfate, 250–1000 mg/L (median 525 mg/L) for calcium sulfate and 400–600 mg/L (median 525 mg/L) for magnesium sulfate (N.A.S, Citation1977). Fish tolerate a wide range of sulfate concentrations, and levels of sulfate above 500 mg/L are a concern only if the water is used for other purposes, such as watering cattle (Bhatnagar & Devi, Citation2013). The low value of sulfate in the pond might be the absence of detergent and soap used by a neighbor who got into it. The presence of phosphate, nitrate and total hardness promoted the growth of diatoms, while silicate is a regulating nutrient in phytoplankton competition (Ansari et al., Citation2015).
Chloride
Chloride is a common component of most waters and is beneficial to fish in maintaining their osmotic balance (Pal & Chakraborty, Citation2017). The Chloride range fluctuated between 22.00 and 33 mg/L (), which is under the tolerance limit. A similar type of observation has been reported, i.e. 10–25 mg/L (Trivery & Khatavker, Citation1986) 7.1–28.4 mg/L (Ehiagbonare & Ogunrinde, Citation2010), however very high value of 54–486 mg/L in pre-monsoon and 67–526 mg/L in post-monsoon were recorded Temple Ponds in Kanchipuram (Perumal & Gopalsamy, Citation2020). Similarly, Sarkar et al. (Citation2020) reported its range between 35.20 and 58.94 mg/L in two urban ponds of Chandannagar, West Bengal, higher than the present study. High chloride levels (above 70 mg/L) were concerned only if the water was also used to irrigate sensitive land-based crops (Stone, Shelton, Haggard, & Thomforde, Citation2013).
Iron (Fe)
In 2016, during the monsoon period, the iron concentration was the highest (0.32. mg/L) but under the tolerance limit. Due to oxygen, iron-rich water can turn rusty brown when exposed to oxygen (Stone et al., Citation2013). Water high in these elements can be utilized as-is for outdoor cultivation ponds in the normal course of things. In order to speed up the oxidation process and make the water safe for fish, aeration can be added to the pond after it has been filled (Ehiagbonare & Ogunrinde, Citation2010). For hatchery water, ferric iron was preferred at 0.1 mg/L for fry and less than 1.0 mg/L for most fishes, but no ferrous iron was recommended (Zweig, Morton, & Stewart, Citation1999). The presence of ferrous iron in pond water is permissible if it is limited to the area surrounding where the water enters the pond. Before using iron-rich water in a fish hatchery, it should be treated. Present values (0.15–0.32 mg/L) reveal that the pond is suitable for pisciculture, wildlife propagation, and outdoor bathing.
Zinc (Zn)
The concentration of zinc, a type of heavy metal, did not show much variation during the two studied years, and very little change was observed during premonsoon, monsoon, and post-monsoon (0.001–0.002 mg/L). Depending on its concentration in the environment, zinc can be an essential bio-element for developing living organisms or a toxic heavy metal (Siwek, Wlodarczyk, & Gibczyñska, Citation2012).
Fluoride
Fluoride is a trace element typically present in water at levels of 0.1 to 1.5 mg/L, and it was within the permissible range. It may be added to water as a measure to prevent tooth decay in humans (0.7 to 1.2 mg/L). Levels at or above 3 mg/L are reported to cause losses of some fish species, depending upon complex water conditions (Kumari et al., Citation2021).
Conclusion
Careful monitoring of water quality parameters is important to understand the interactions between parameters and effects on shrimp and fish feeding, their growth, and health. Each water parameter alone may not tell much, but several parameters together can reveal dynamic processes taking place in the pond. Water quality records will allow farmers to note changes and make decisions fast to take corrective actions quickly. In the present study, pH noted during pre-monsoon, monsoon, and post-monsoon were within the tolerance limits (6.5 to 8.5) depending on various water uses (ISI-IS: 2296–1982). As per ISI-IS: 2296–1982, all the water parameters except D.O, and B.O.D showed little bid higher values. This higher D.O value in pre-monsoon is due to a rise in temperature by the improved rate of photosynthesis, causing greater carbon dioxide consumption. The most excellent value of the D.O is helpful for fish growth. The results indicate organic pollution (High B.O.D & C.O.D). Climatic variation cannot cause major changes in the pond water. The temple pond water was appropriate in the fish culture, irrigation, etc. To tolerate the ecosystem and aquatic life in the pond water, there should be awareness programs related to the protection of the pond so that aquatic life is saved in the future.
Acknowledgments
I thank all authors for their expertise and assistance throughout all aspects of our study and for their help in writing the manuscript. P.K. conducted the data analysis and created the tables and figures. SKG provided his laboratory expertise for water analysis. R.K. provided a factual review and helped edit the manuscript.
Disclosure statement
No potential conflict of interest was reported by the author(s).
Additional information
Funding
References
- Alam, M. A. (2017). Water quality requirements & its management in aquaculture. Website: https://www.academia. Edu/32366828/Water Quality requirements and its Management in Aquaculture March, 31, 2020.
- Ansari, E., Gadhia, M., & Ujjania, N. C. (2015). Phytoplankton diversity and water quality assessment of ONGC pond, Hazira. International Journal of Research in Environmental Science, 1(1), 1–5.
- Anton-Pardo, M., Hlaváč, D., Bauer, C., & Adámek, Z. (2020). Environmental and biotic variables in carp (Cyprinus carpio) ponds: Organic vs. conventional management. Aquaculture International, 28(4), 1621–1637. doi:10.1007/s10499-020-00547-8
- APHA. (1986). Standard methods for the examination of water and waste water. APHA, AWWA, WPCF, New York.
- Arivoli, S., Dhinamala, K., Persis, D., Meeran, M., & Pandeeswari, M. (2018). Analysis of physicochemical water quality parameters of Buckingham Canal, Chennai, Tamil Nadu, India. International Journal of Zoology Studies, 3(1), 226–231.
- Awofolaju, T. T., Ogbeide, K., & Adebayo, S. (2019). Smart automation of precision fish farming using internet of things (IoT). International Journal of Innovation and Applied Studies, 27(2), 499–507.
- Baxa, M., Musil, M., Kummel, M., Hanzlík, P., Tesařová, B., & Pechar, L. (2021). Dissolved oxygen deficits in a shallow eutrophic aquatic ecosystem (fishpond)–Sediment oxygen demand and water column respiration alternately drive the oxygen regime. Science of the Total Environment, 766, 142647. doi:10.1016/j.scitotenv.2020.142647
- Begum, A., Mondal, S., Ferdous, Z., Zafar, M. A., & Ali, M. M. (2014). Impact of water quality parameters on monosex tilapia (Oreochromis niloticus) production under pond condition. International Journal Animal Fish Science, 2(1), 14–21.
- Bhatnagar, A., & Devi, P. (2013). Water quality guidelines for the management of pond fish culture. International Journal of Environmental Sciences, 3(6), 1980–2009.
- Bhat, S. U., & Pandit, A. K. (2020). Water quality assessment and monitoring of Kashmir Himalayan freshwater springs-A case study. Aquatic Ecosystem Health & Management, 23(3), 274–287. doi:10.1080/14634988.2020.1816771
- Cabral-Pinto, M., Inácio, M., Neves, O., Almeida, A. A., Pinto, E., Oliveiros, B., & Ferreira da Silva, E. A. (2020). Human health risk assessment due to agricultural activities and crop consumption in the surroundings of an industrial area. Exposure and Health, 12(4), 629–640. doi:10.1007/s12403-019-00323-x
- Cao, J., Sun, Q., Zhao, D., Xu, M., Shen, Q., Wang, D., & Ding, S. (2020). A critical review of the appearance of black-odorous waterbodies in China and treatment methods. Journal of Hazardous Materials, 385, 121511. doi:10.1016/j.jhazmat.2019.121511
- Crosa, G., Castelli, E., Gentili, G., & Espa, P. (2010). Effects of suspended sediments from reservoir flushing on fish and macroinvertebrates in an alpine stream. Aquatic Sciences, 72(1), 85–95.
- Dey, S., Botta, S., Kallam, R., Angadala, R., & Andugala, J. (2021). Seasonal variation in water quality parameters of Gudlavalleru Engineering College pond. Current Research in Green and Sustainable Chemistry, 4, 100058. doi:10.1016/j.crgsc.2021.100058
- Dixit, A. K. (2015). Study of physico-chemical parameters of different pond water of Bilaspur district, Chhattisgarh, India. Environmental Skeptics and Critics, 4(3), 89.
- Ehiagbonare, J. E., & Ogunrinde, Y. O. (2010). Physico-chemical analysis of fish pond water in Okada and its environs, Nigeria. African Journal of Biotechnology, 9(36).
- Engwa, G. A., Ferdinand, P. U., Nwalo, F. N., & Unachukwu, M. N. (2019). Mechanism and health effects of heavy metal toxicity in humans. Poisoning in the Modern world-new Tricks for an Old Dog, 10.
- Gangwar, R. K., Singh, J., Singh, A. P., & Singh, D. P. (2013). Assessment of water quality index: A case study of river ramganga at Bareilly UP India. International Journal of Scientific & Engineering Research-IJSER, 4(9), 2325–2329.
- Goldsmith, B. (2018). Wandsworth lakes: Annual report on lake monitoring and management 2017.
- Halim, A., Sharmin, S., Rahman, H., Haque, M., Rahman, S., & Islam, S. (2018). Assessment of water quality parameters in baor environment, Bangladesh: A review. International Journal of Fisheries and Aquatic Studies, 6(2), 269.
- Harney, N. V., Dhamani, A. A., & Andrew, R. J. (2013). Seasonal variations in the physico-chemical parameters of pindavani pond of central India. Weekly Science, 1(6), 1–8.
- Hassall, C. (2014). The ecology and biodiversity of urban ponds. Wiley Interdisciplinary Reviews: Water, 1(2), 187–206. doi:10.1002/wat2.1014
- Hawes, I., Howard-Williams, C., & Sorrell, B. (2014). Decadal timescale variability in ecosystem properties in the ponds of the McMurdo Ice Shelf, southern Victoria Land, Antarctica. Antarctic Science, 26(3), 219–230. doi:10.1017/S0954102013000576
- Hepher, B., & Pruginin, Y. (1981). Commercial fish farming: With special reference to fish culture in Israel. Wiley.
- Islam, M. S., Nakagawa, K., Abdullah-Al-Mamun, M., Siddique, M. A. B., & Berndtsson, R. (2022). Is road-side fishpond water in Bangladesh safe for human use? An assessment using water quality indices. Environmental Challenges, 6, 100434. doi:10.1016/j.envc.2021.100434
- Johnson, D. L., Ambrose, S. H., Bassett, T. J., Bowen, M. L., Crummey, D. E., Isaacson, J. S., & Winter‐Nelson, A. E. (1997). Meanings of environmental terms. Journal of Environmental Quality, 26(3), 581–589. doi:10.2134/jeq1997.00472425002600030002x
- Khan, A. A., Nabi, N. G., Dar, S. H., Rashid, A., Teli, A. R., & Bashir, M. (2017). Seasonal variations of physico-chemical parameters in lower lake of Bhopal. The Pharma Innovation Journal, 6(11), 710–714.
- Khatri, N., & Tyagi, S. (2015). Influences of natural and anthropogenic factors on surface and groundwater quality in rural and urban areas. Frontiers in Life Science, 8(1), 23–39. doi:10.1080/21553769.2014.933716
- Kraemer, B. M., Anneville, O., Chandra, S., Dix, M., Kuusisto, E., Livingstone, D. M., & McIntyre, P. B. (2015). Morphometry and average temperature affect lake stratification responses to climate change. Geophysical Research Letters, 42(12), 4981–4988. doi:10.1002/2015GL064097
- Kumara, A., Sharmab, M. P., & Raic, S. P. (2017). A novel approach for river health assessment of Chambal using fuzzy modeling, India. Desalination Publications, 58(2017), 72–79.
- Kumari, P., Chowdhury, A., & Maiti, S. K. (2018). Assessment of heavy metal in the water, sediment, and two edible fish species of Jamshedpur Urban Agglomeration, India with special emphasis on human health risk. Human and Ecological Risk Assessment: An International Journal, 24(6), 1477–1500. doi:10.1080/10807039.2017.1415131
- Kumari, S., Khan, J. A., & Lal Thakur, M. S. (2019). Study of physico-chemical characteristics of water and soil in relations to fish production in Motia lake reservoir. Journal of Atmospheric & Earth Sciences, 2(6), 1–9.
- Kumari, P., & Maiti, S. K. (2021). Bioaccessibilities and health risk assessment of heavy and trace elements in fish from an urban city, India. Human and Ecological Risk Assessment: An International Journal, 27(1), 50–70. doi:10.1080/10807039.2019.1691501
- Kumar, A., Mishra, S., Taxak, A. K., Pandey, R., & Yu, Z. G. (2020). Nature rejuvenation: Long-term (1989–2016) vs short-term memory approach based appraisal of water quality of the upper part of Ganga river, India. Environmental Technology & Innovation, 20, 101164. doi:10.1016/j.eti.2020.101164
- Kumar, R., & Saikia, P. (2020). Floristic analysis and dominance pattern of sal (Shorea robusta) forests in Ranchi, Jharkhand, eastern India. Journal of Forestry Research, 31(2), 415–427. doi:10.1007/s11676-018-0829-9
- Kumar, R., & Saikia, P. (2021). Spatio-temporal soil nutrient dynamics and plant species diversity in selected Sal forests of Ranchi, Eastern India. Vegetos, 34(1), 235–248. doi:10.1007/s42535-020-00173-y
- Kumar, A., Taxak, A. K., Mishra, S., & Pandey, R. (2021). Long term trend analysis and suitability of water quality of river Ganga at Himalayan hills of Uttarakhand, India. Environmental Technology & Innovation, 22, 101405. doi:10.1016/j.eti.2021.101405
- Kupoluyi, A. Y., Alarape, S. A., & Adeyemo, O. K. (2018). Impact of industrial effluents on Alaro river in Oluyole industrial estate, Ibadan and its suitability for aquatic life. Sokoto Journal of Veterinary Sciences, 16(1), 38–44. doi:10.4314/sokjvs.v16i1.6
- Liu, Y., Yang, L., & Jiang, W. (2020). Coupling coordination and spatiotemporal dynamic evolution between social economy and water environmental quality–A case study from Nansi Lake catchment, China. Ecological Indicators, 119, 106870. doi:10.1016/j.ecolind.2020.106870
- Mayer, E. (2012). Monitoring pond water quality to improve production. Biomin, June, 15, 2012. https://thefishsite.com/articles/monitoring-pond-water-quality-to-improve-production.
- McGaw, I. J., & Whiteley, N. M. (2012). Effects of acclimation and acute temperature change on specific dynamic action and gastric processing in the green shore crab, Carcinus maenas. Journal of Thermal Biology, 37(8), 570–578. doi:10.1016/j.jtherbio.2012.07.003
- Mishra, K. D. (1991). Impact of sewage and industrial pollution on physicochemical characteristics of water in river Betwa at Vidisha, Madhya Pradesh. Indian Journal of Environmental Health, 25, 288–299.
- Mushtaq, N., Singh, D. V., Bhat, R. A., Dervash, M. A., & Hameed, O. B. (2020). Freshwater contamination: Sources and hazards to aquatic biota. In Fresh water pollution dynamics and remediation (pp. 27–50). Singapore: Springer.
- N.A.S. (1977). Drinking water and health. Washington, DC: National Research Council, National Academy of Sciences.
- NEERI. (1986). Manual on water and waste water analysis (pp. –340). Nagpur: National Environmental Engineering Research Institute.
- Ngugi, C. C., Bowman, J. R., & Omolo, B. (2007). A new guide to fish farming in Kenya.
- Ni, M., Yuan, J. L., Liu, M., & Gu, Z. M. (2018). Assessment of water quality and phytoplankton community of Limpenaeus vannamei pond in intertidal zone of Hangzhou Bay, China. Aquaculture Reports, 11, 53–58. doi:10.1016/j.aqrep.2018.06.002
- Ntengwe, F. W., & Edema, M. O. (2008). Physico-chemical and microbiological characteristics of water for fish production using small ponds. Physics and Chemistry of the Earth, Parts A/B/C, 33(8–13), 701–707. doi:10.1016/j.pce.2008.06.032
- O’Reilly, C. M., Sharma, S., Gray, D. K., Hampton, S. E., Read, J. S., Rowley, R. J., & Zhang, G. (2015). Rapid and highly variable warming of lake surface waters around the globe. Geophysical Research Letters, 42(24), 10–773.
- Othman, A., Dumitrescu, E., Andreescu, D., & Andreescu, S. (2018). Nanoporous sorbents for the removal and recovery of phosphorus from eutrophic waters: Sustainability challenges and solutions. ACS Sustainable Chemistry & Engineering, 6(10), 12542–12561. doi:10.1021/acssuschemeng.8b01809
- Pal, S., & Chakraborty, K. (2017). Different aspects of chloride in freshwater: A review. International Journal of Current Trends in Science and Technology, 7(8), 20295–20303.
- Perumal, M., & Gopalsamy, S. (2020). Climatic variation water quality assessment of selected temple ponds In Kanchipuram. Executive Editor, 11(7), 530.
- Pfumbidzai, R. (2014). An Assessment of environmental impact assessment for water quality monitoring in Shamva district: A Case of Shamva and Canterbury Gold Mine projects in Shamva district, Zimbabwe (Doctoral dissertation, BUSE).
- Qian, Z., Liu, X., Wang, L., Wang, X., Li, Y., Xiang, J., & Wang, P. (2012). Gene expression profiles of four heat shock proteins in response to different acute stresses in shrimp, Litopenaeus vannamei. Comparative Biochemistry and Physiology Part C: Toxicology & Pharmacology, 156(3–4), 211–220.
- Rani, S. (2019). Physico-chemical properties of fresh water fish pond in relation to fish farming in Darbhanga district. Journal of Emerging Technologies and Innovative Research, 6(6), 541–544.
- Saha, S., Mandal, A., & Sahoo, D. (2017). Study of physico-chemical parameters of three different urban pond water of Nadia district, West-Bengal, India. International Journal of Fisheries and Aquatic Studies, 5(6), 23–27.
- Saha, A., Ramya, V. L., Jesna, P. K., Mol, S. S., Panikkar, P., Vijaykumar, M. E., & Das, B. K. (2021). Evaluation of spatio-temporal changes in surface water quality and their suitability for designated uses, Mettur reservoir, India. Natural Resources Research, 30(2), 1367–1394. doi:10.1007/s11053-020-09790-5
- Salomova, K. Y. (2021). Appearance of quality, quantity and norm categories in the medical thoughts of Avicenna. Academic Research in Educational Sciences, 2(1).
- Sarkar, R., Ghosh, A. R., & Mondal, N. K. (2020). Comparative study on physicochemical status and diversity of macrophytes and zooplanktons of two urban ponds of Chandannagar, WB, India. Applied Water Science, 10(2), 1–8. doi:10.1007/s13201-020-1146-y
- Siwek, H., Wlodarczyk, M., & Gibczyñska, M. (2012). Concentration of zinc in water and bottom sediments in small water reservoirs located in rural areas. Journal of Elementology, 17(4).
- Stone, N. M., Shelton, J. L., Haggard, B. E., & Thomforde, H. K. (2013). Interpretation of water analysis reports for fish culture. In SRAC Publication (Vol. 4606, ppp.1–12). Stoneville, Mississippi: Southern Regional Aquaculture Center.
- Surapati, H. U., & Mizwar, A. (2020, March). Cerucuk filter modified (C.F.M.) Design as sediment traps to reduce total suspended solids (T.S.S.) concentration in the drainage mine reclamation area: an field experiment. Earth and Environmental Science, 448(1), 012048.
- Trivedi, R. K., Khatavkar, S. B., & Goel, P. K. (1986). Characterization, treatment and disposal of waste water in a textile industry. Journal of Industrial Pollution Control, 2(1), 1–12.
- Trivery, R. K., & Khatavker, S. D. (1986). Phytoplankton ecology of the river Krishna in Maharashtra with reference to bio-indicators of pollution. Asian Journal of Environmental Science, 31–42.
- Trombadore, O., Nandi, I., & Shah, K. (2020). Effective data convergence, mapping, and pollution categorization of ghats at Ganga river front in Varanasi. Environmental Science and Pollution Research, 27(13), 15912–15924. doi:10.1007/s11356-019-06526-8
- Valencia-Castañeda, G., Vanegas-Pérez, R. C., Frías-Espericueta, M. G., Chávez-Sánchez, M. C., Ramírez-Rochín, J., & Páez-Osuna, F. (2018). Comparison of four treatments to evaluate acute toxicity of nitrite in shrimp Litopenaeus vannamei postlarvae: Influence of feeding and the renewal water. Aquaculture, 491, 375–380. doi:10.1016/j.aquaculture.2017.12.037
- Whitehead, P., Bussi, G., Hossain, M. A., Dolk, M., Das, P., Comber, S., & Hossain, M. S. (2018). Restoring water quality in the polluted Turag-Tongi-Balu river system, Dhaka: Modelling nutrient and total coliform intervention strategies. Science of the Total Environment, 631, 223–232. doi:10.1016/j.scitotenv.2018.03.038
- Zweig, R. D., Morton, J. D., & Stewart, M. M. (1999). Source water quality for aquaculture: A guide for assessment. Washington, D.C: The World Bank.