
 ?Mathematical formulae have been encoded as MathML and are displayed in this HTML version using MathJax in order to improve their display. Uncheck the box to turn MathJax off. This feature requires Javascript. Click on a formula to zoom.
ABSTRACT
Groundwater assessment is based on the hydrochemical parameters of the study area. The objective of this study is to determine the number of hydrochemical parameters to assess the groundwater quality of Nashik. Water samples were collected from the three tehsils in Nashik viz., Deola, Satana, and Malegaon with the total study area of around 3819.441. From each tehsil sixteen water samples were collected having ten well and six bore well samples. All forty-eight samples were analyzed for hydrochemical parameters such as pH, temperature, electrical conductivity, solids in water, dissolved oxygen, turbidity, alkalinity (CaCO3), carbonate and bicarbonate, chloride, sulfate (SO4), fluoride (F), total hardness (CaCO3), sodium, potassium, nitrate, nitrite, ammonia, orthophosphate, total phosphate, boron, aluminum, iron, manganese, and silica concentrations and observations were recorded. The concentration levels of hydrochemical parameters indicated the quality of groundwater. The overall statistical assessment of groundwater revealed all groundwater samples may be suitable for drinking and irrigation since the values of hydrochemical parameters do not cross the permissible limit. But the mean pH of the bore well water sample exceeds the permissible limit given in Table 3. Hence, by using t-test the comparison between bore well and open well sample analysis revealed that at 95% confidence we can say that open well water is better for drinking and irrigation than bore well water.
Introduction
Groundwater is a daily existence supporting asset that has a focal impact on farming and the strength of numerous biological systems. Be that as it may, non-sustainable depletion of groundwater has been archived on both local and worldwide scales (Rodell, Velicogna, and Famiglietti (Citation2009); Gleeson, Wada, Bierkens, and Van Beek (Citation2012); MacDonald et al. (Citation2016)). The concentration of ions in the groundwater was decreased by lowering the water table. In simple words, the ionic concentration of water is increased with an increase in the water table (Kumar (Citation2016)). Groundwater is an entirely significant natural asset for the financial development and secure arrangement of the consumable water budget in both urban and rural climate (Foster, Hirata, Gomes, D’Elia, and Paris (Citation2009); Wakode, Baier, Jha, Ahmed, and Azzam (Citation2014)). Recent day’s groundwater contamination has gotten one of the most major issues all over the world. Urbanization, industrialization, farming activities, and rural action influencing groundwater amount and quality (Jat, Khare, and Garg (Citation2009); Tiwari, Singh, Singh, and Singh (Citation2017); Rubia, Jhariya, and Singh (Citation2015); Khan and Jhariya (Citation2016)). The nature of groundwater is similarly essential to its amount attributable to the appropriateness of water for different purposes (Kumar, Rammohan, Sahayam, and Jeevanandam (Citation2009); Subramani, Elango, and Damodarasamy (Citation2005)). Groundwater quality relies upon a few factors; for example, revive water quality, geography, evaluation of compound enduring of the diverse stone types, and water-rock interface (Aly (Citation2015); Emenike et al. (Citation2017)). For viability, the administration and evaluation of groundwater assets need a comprehension of hydrogeochemical and hydrogeological highlights of the groundwater aquifer (Azhar, Aris, Yusoff, Ramli, and Juahir (Citation2015)). Water contamination dangers human wellbeing, monetary turn of events, and social achievement (Milovanovic (Citation2007); Wakode et al. (Citation2014); Tiwari et al. (Citation2015)). In recent years it has been perceived that the nature of groundwater is of almost equivalent significance as the amount (Khan and Jhariya (Citation2017)). As of late, escalated farming activities, household and mechanical releases, over-misuse, uncertainty in precipitation, and bungle of groundwater have raised genuine concern concerning groundwater sullying (Jain, Bandyopadhyay, and Bhadra (Citation2010); Salifu, Yidana, Osae, and Armah (Citation2013); Fianko, Nartey, and Donkor (Citation2010)). The World Health Organization reports that consistently more than 3.4 million individuals pass on because of water-related illnesses and the main source of death around the globe. Reasonableness of groundwater for household and water system objects is dictated by its groundwater geochemistry because each groundwater framework has a unique hydrochemical composition and any change relies upon a few factors, for example, rock–water cooperation, mineral disintegration, soil–water connection, collaboration time, temperature and man-made activities (Back and Hanshaw (Citation1965); Drever (Citation1980); Stallard and Edmond (Citation1983)). To forestall water-borne maladies, harm to crop yields, and soil wellbeing, groundwater quality measures should be guaranteed (Sarkar and Hassan (Citation2006); Bauder, Cardon, Waskam, and Davis (Citation2004); Little, Kalischuk, Gross, and Sheedy (Citation2010)). India is an immense nation with an exceptionally broadened hydro geologic set-up.
The groundwater conduct in the Indian sub-mainland is exceptionally complicated because of the event of expanded geographical developments with extensive lithological and sequential varieties, complex structural system, climatologically dissimilarities, and different hydrochemical conditions. Natures of water are expecting incredible significance with the rising pressure on farming and ascend in way of life (Wijnen, Augeard, Hiller, Ward, and Huntjens (Citation2012); Wani, Mir, Tanveer, Jehangir, and Yousuf (Citation2014)). The nature of water is a significant thought in any evaluation of saltiness or soluble base conditions in an inundated, agricultural, and irrigated region. All water system water contains a few salts, yet the concentration and nature of salts fluctuate. The nature of water system water relies fundamentally upon the aggregate sum of salt present and the extent of Na+ to other cation and certain different parameters (Kant, Singh, Jat, Meena, and Singh (Citation2015)). However, in recent years, because of the appearance of mechanical development, enormous scope in use of manufactured synthetic fertilizers for farming production and utilization of pesticides and insecticides for production has caused genuine concern for the helplessness of groundwater pollution. Keeping in view the above realities, the present investigation is embraced to survey the groundwater nature of Deola, Satana, and Malegaon in Nashik, Maharashtra, for the water system and drinking purposes through various groundwater quality parameters with the assistance of a statistical approach.
Geography and climate of the study area
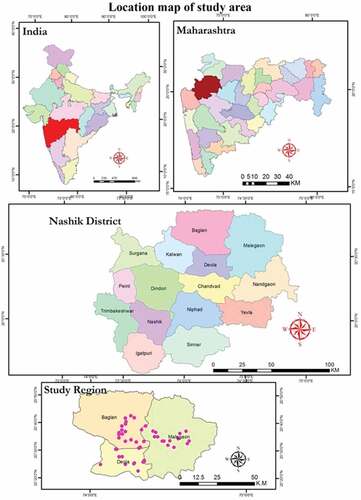
In Maharashtra, the third-largest city is Nashik after Pune and Mumbai. Nashik is situated in the north part of Maharashtra state which is 700 meters from the mean sea level (MSL) results in temperature and meteorological variations in the winter season. Nashik has lush mountain terrains from its MSL distance. The Godavari River, Mosam, Girna are flowing through Nashik, Deola, Satana, and Malegaon tehsils. Thus, the Nashik district forms a part of the Western Ghats and Deccan plateau covering an area 3619.44 km2. Geographically Nashik comprises varied topography.
Location map of our study area is represented in . Malegaon, Satana, and Deola are at the junction of the Girna and Mosam River, at an elevation of 438 meters (1437 feet) at 18.42° N 77.53 ° E. April and May are the most blazing month with the mean day by day greatest temperature at 40.6 0C at Malegaon and 37.4 0C at Nashik. Climate is classified as tropical. The summer is much rainier than the winters in Nashik. The average annual temperature of Nashik is 24.7°C and About 812 mm of precipitation falls annually. Agriculture is the main occupation of people in the Nashik region.
Figure 1. Location map of study area.
Hydrogeology of study area
The area of the Nashik district is underlain by the elementary lava flows of top Cretaceous to lower the Eocene epoch. The shallow alluvial formation of recent age also occurs as a narrow stretch along the banks of the Godavari, Mosam, and Girna River flowing in Nashik. Basaltic lava flows occupy about 85% of the area of the district. These flows are normally horizontally disposed over a wide stretch and give rise to tableland type of topography also known a plateau. These flows occur in layered sequences and are represented by a massive unit at the bottom and a vesicular unit at the top of the flow. These flows are separated from each other by a marker bed known as ‘bole bed.’ The groundwater in Deccan Trap Basalt occurs mostly in the upper weathered and fractured parts down to 20–25 m depth. At places, potential zones are encountered at deeper levels in the form of fractures and inter-flow zones. The top weathered and fractured parts form subterranean aquifer and groundwater occurs under water table (unconfined) conditions. At more limitless levels, the groundwater occurs under semi-confined to confined conditions.
Methodology for analysis
Forty-eight groundwater samples were collected from thirty wells and eighteen bore wells during the pre-monsoon season from different villages in Deola, Satana, and Malegaon tehsil in pre-cleaned polyethylene containers of two-liter capacity, and their hydrochemical parameters were analyzed. These field samples were analyzed immediately for the water quality parameters given in .
Table 1. Water quality parameters and their methods of analysis.
Evaluation of the hydrochemical parameters has been done statistically by calculating mean, standard deviation, and confidence interval for the mean. The confidence interval for the mean for each hydrochemical parameter is compared with standards of water quality given by WHO and BIS 10500: 2012 which is given in .
Table 2. Statistical analysis of bore well and well samples.
From , it is observed that the average pH level for open well and bore well sample is 7.77 with the variation 0.47 and it ranges from 7.10 to 8.70. The 95% confidence interval for the pH Level is (7.64, 7.91) which is within the permissible limit. Whereas, the average EC is 504.23 having a standard deviation 184.18 with a minimum EC 258.30 and maximum EC is 780.20 The 95% confidence interval for the EC level is (452.67,555.79) which is also within the permissible limit. Thus, we found that all hydrochemical parameters within the respective permissible limits.
To compare bore well water with well water, a t-test for comparing two means assuming equal variances was performed for each hydro chemical parameter. This test is used to test the difference between average of hydrochemical parameters for well and borewell sample. The related test for comparing two means assuming equal variances was performed for each hydro chemical parameter. The related test statistics and its associated -value is given in . The
-value with asterisk (*) shows that there is a significant difference between the average of hydrochemical parameters for well and borewell samples. A
-value is used to measure and validate a statistical hypothesis for the collected data. It is the maximum probability of rejecting the null hypothesis. We assume alpha (level of significance) as 5% (0.05) which is the minimum probability of rejecting the null hypothesis. Hence, lower the
-value, greater the statistical significance of the observed difference between average of hydrochemical parameters. From it is observed that, there is significant difference between average of pH, EC, TDS, DO, alkalinity (CaCO3), carbonate and bicarbonate, chloride, fluoride (F), sodium, ammonia, aluminum, iron, manganese and chloride for well and borewell samples.
Table 3. Statistical Comparison between Well and Bore well samples.
From the , it can be observed that temperature, turbidity, sulfate, calcium, potassium, nitrate, nitrite, orthophosphate, total phosphate, total hardness, boron, and silica are not differing significantly (statistically). The other remaining parameters such as pH, EC, TDS, CO32−, HCO3−, DO, Alkalinity, fluoride, Sodium, Ammonia, Aluminum, Iron, Manganese, chloride differ significantly.
Cluster analysis for well and bore well samples
Cluster analysis is performed to find the internal relationships and different characteristics of the water samples. By performing cluster analysis, a set of objects partitioned mentioned into groups known as clusters where similar objects belong to unique clusters. Here six clusters re-obtained. The cluster analysis method was used to identify similarity groups among the 48 samples. Here six distinct groups were identified with distinct hydrochemical parameters.
To perform cluster analysis, Statistical Package for Social Sciences (SPSS) is used. The results are given in .
Table 4. Cluster analyses for well and bore well samples.
EC- Eelectrical conductivity; TDS-Total dissolved solids; CO32− – Carbonate; HCO3− – Bicarbonate: DO-dissolved Oxygen. (All parameters in mg/l except EC (µS/cm), Turbidity (NTU), temperature (0C), pH)
By performing a cluster analysis, six clusters are obtained. Since all twenty-six parameters for six clusters are within the permissible limits there is no need to do anything for improving the quality of water. The major principle of water quality assessment is to obtain quantitative data on the physical and chemical characteristics of water using a statistical approach. Also, to identify the quality of groundwater in the study area for irrigation and drinking purpose. Groundwater assessment helps effective irrigation management for agricultural production and discusses ways of protecting groundwater from contamination. Groundwater assessment also suggests planning, strategies, and management actions to control contamination and improve water quality. In the future, if anyone of the parameters goes beyond the permissible limit then focus that particular parameter regarding the six clusters.
Results and discussion
In this study twenty-six hydrochemical parameters viz. pH, temperature, electrical conductivity, solids in water, dissolved oxygen, turbidity, alkalinity (CaCO3), carbonate, bicarbonate, chloride, sulfate (SO4), fluoride (as F), total hardness as CaCO3, sodium, potassium, nitrate, nitrite, ammonia, orthophosphate, total phosphate, boron, aluminum, iron, manganese, and silica were analyzed. The statistical measure such as minimum value, maximum value, means, and standard deviation for bore well and open well (combined study) sample values are calculated and is given in . The samples were collected in the pre-monsoon season in 2020. Also, the major parameters such as pH, EC, TDS, CO32−, HCO3 −, DO, Turbidity, Fluoride, Nitrate, Nitrite, Aluminum, Chloride, Total hardness (CaCO3), Alkalinity (CaCO3), and Sodium in the study area are within the permissible limits as prescribed by WHO and BIS 10500:2012. this is because, the agriculture sector in the study area used organic farming techniques which minimize the role of inorganic fertilizers, pesticides, and insecticides. Leaching of inorganic fertilizers, pesticides, insecticides residue contaminates the groundwater aquifer. Hence the organic farming ideas reduce groundwater contamination in the study area. In 2011 at some places in Satana tehsil the EC of some groundwater was above 2000 m mhos/cm at 25°C (Government of India Ministry of Water Resources Central Ground Water Board, Ground Water Information Nashik District Maharashtra). As 2011 had drought condition and the groundwater level was also deep. In 2019–20, due to high rainfall, the groundwater level increased, which lead to dilution of hydrochemical parameters resulting in the low concentration of these parameters in groundwater.
In , statistical comparison between Well and bore well sample has been done by performing t-test. Since, -value is less than 0.05 for all hydrochemical parameters except temperature, turbidity, sulfate, calcium, potassium, nitrate, nitrite, orthophosphate, total phosphate, total hardness, boron, and silica, we can say that the difference between bore well and open well samples is statistically significant. The comparison between well water sample with bore well water sample shows the mean value of bore well sample of some parameters like pH, EC, CO32−, HCO3 −, Alkalinity as (CaCO3), sulfate, fluoride, calcium, total hardness (CaCO3), sodium, potassium, nitrate, ammonia, orthophosphate, total phosphate, aluminum, manganese, iron, and chloride is higher than well water and they do not exceed the permissible limit. But the mean pH value of the bore well sample is 8.51 exceeds the permissible limit.
Because the borehole water has a higher depth than the well and it contains bacteria, viruses, heavy metals like arsenic, fluoride, lead, etc. and leaching of nutrients into groundwater. In simple words, borehole water gets hardness from dissolved calcium and magnesium salts in borehole water. CaCO3 dissolution in water decreases the pH and increases the pH due to the absorption of CO2. The other possible explanation for increases the pH is the anaerobic degradation i.e. Sulfate reduction reactions and denitrification processes. H+ ion consumes by these processes, which means that pH reduces and alkalinity increases (Kotti, Zacharioudaki, Kokinou, and Stavroulakis (Citation2018)). The normal pH value ranges from 6.5 to 8.5. Hence, we can’t say surely the bore well water is safe for drinking and irrigation purposes. Rather than the open well sample parameters like temperature, DO, turbidity, nitrate, boron, silica are maximum than bore well water but they are within the permissible limit. Some times in well water the leaching of Nutrients, soil particles, type of rock, affect the quality of well water. But well water doesn’t have maximum depth and the amount of dissolved calcium and magnesium salts is less than bore well water. Ultimately, we can say that well water is may be suitable for drinking and irrigation purposes. In , t-test for comparing two means assuming equal variances was performed for each hydro chemical parameter of the water sample in the study area. The related test statistic and its associated -value are given. A
-value is statistically significant. It indicates that strong evidence against the null hypothesis, as there is less than a 5% probability null is correct. In , the parameters of the open well and bore well samples such as pH, EC, TDS, CO32−, HCO3−, DO, Alkalinity, fluoride, Sodium, Ammonia, Aluminum, Iron, Manganese, chloride differ significantly at 5% level of significance. Then the
-value is > 0.05 is not statistically significant and indicates strong evidence for the null hypothesis. Also, in , the open well and bore well sample parameters such as temperature, turbidity, sulfate, calcium, potassium, nitrate, nitrite, orthophosphate, total phosphate, total hardness, boron, and silica not differ significantly (statistically) at 5% level of significance. The hydrochemical parameter has differed significantly because the depth of the well and bore well is different, the bedrock type (carbonate rock and siliciclastic rock) and land use land cover factors, topographic position, leaching of nutrients, mineral composition, type of soil weathering of rocks, etc. factors affect the quality of groundwater.
pH hazard
The quality and nature of groundwater in some regions of the state, particularly shallow and deep groundwater, are changing due to anthropogenic activities. In the study area, the bore well water shows maximum pH value i.e. 8.5. It exceeds the permissible limit. Water is a universal solvent and it also contaminates due to the weathering of rocks and minerals. Dissolved mineral matter can be hazardous to flora and fauna in maximum length. The maximum concentration of Na+ in water may be harmful to human health who suffers from heart problems. The maximum pH of water causes skin diseases, hair fall, etc. Water that contains a maximum amount of calcium and magnesium is said to be hard water which shows a high pH value. Domestic, industrial, and mechanical wastes and inorganic fertilizers, herbicides, and pesticides not properly contained have entered the soil infiltrated in groundwater and it reduces the quality of groundwater. Staining, etching, or scaling produces due to water with pH value is higher than 8.5 also the reverse osmosis process treats the hard water and helps to maintain the pH of water.
Conclusions
The present study provides an assessment of the open well and bore well water quality in Deola, Satana, and Malegaon tehsil in Nashik. The groundwater is the most important source for drinking and irrigation in rural areas in Nashik. The results obtained by analyzing open well and bore well samples revealed that all hydrochemical parameters of a good sample in the study area are within the permissible limit. From , it is observed that the average pH for the bore well sample is 8.51, which is higher than the permissible limit compared with WHO and BIS 10500: 2012. We compared hydrochemical parameters of the well and bore well sample using a t-test. Thus, with 95 % confidence, we can say that open well water is better for drinking and irrigation than bore well water.
Acknowledgments
This study has been supported by the Laboratory of Department of Environmental Science, K.T.H.M. College, Nashik, Laboratory of Soil and Water Analysis in K.D.S.P. College of Agriculture, Nashik and GIS laboratory, Department of Geography, K.T.H.M. College Nashik. We gratefully acknowledge Dr. V.B. Gaikwad, Principal, K.T.H.M College Nashik and Dr. I.B. Chavan, Principal, K.D.S.P. College of Agriculture Nashik.
Disclosure statement
No potential conflict of interest was reported by the author(s).
Additional information
Funding
References
- Aly, A. A. (2015). Hydrochemical characteristics of Egypt western desert oases groundwater. Arabian Journal of Geosciences, 8(9), 7551–7564. doi:10.1007/s12517-014-1680-8
- Azhar, S. C., Aris, A. Z., Yusoff, M. K., Ramli, M. F., & Juahir, H. (2015). Classification of river water quality using multivariate analysis. Procedia Environmental Sciences, 30, 79–84. doi:10.1016/j.proenv.2015.10.014
- Back, W., & Hanshaw, B. (1965). Chemical geohydrology advances in hydroscience. New York, USA: Academic Press.
- Bauder, T. A., Cardon, G. E., Waskam, R. M., & Davis, J. G. (2004). Irrigation water quality cooperative extension agriculture 506. Colorado: Colorado State University.
- Drever, R. R. (1980). The geochemistry of natural waters. Englewood Cliffs, 388, 790–798.
- Emenike, C. P., Tenebe, I. T., Omole, D. O., Ngene, B. U., Oniemayin, B. I., Maxwell, O., & Onoka, B. I. (2017). Accessing safe drinking water in sub-Saharan Africa: issues and challenges in south–west Nigeria. Sustainable Cities and Society, 30, 263–272. doi:10.1016/j.scs.2017.01.005
- Fianko, J. R., Nartey, V. K., & Donkor, A. (2010). The hydrochemistry of groundwater in rural communities within the Tema District, Ghana. Environmental Monitoring and Assessment, 168(1–4), 441–449. doi:10.1007/s10661-009-1125-0
- Foster, S., Hirata, R., Gomes, D., D’Elia, M., & Paris, M. (2009). Protecting the quality of public water-supply sources: A guide for water utilities, municipal authorities, and environmental agencies.
- Gleeson, T., Wada, Y., Bierkens, M. F., & Van Beek, L. P. (2012). Water balance of global aquifers revealed by groundwater footprint. Nature, 488(7410), 197–200. doi:10.1038/nature11295
- Jain, C. K., Bandyopadhyay, A., & Bhadra, A. (2010). Assessment of ground water quality for drinking purpose, District Nainital, Uttarakhand, India. Environmental Monitoring and Assessment, 166(1), 663–676. doi:10.1007/s10661-009-1031-5
- Jat, M. K., Khare, D., & Garg, P. K. (2009). Urbanization and its impact on groundwater: A remote sensing and GIS-based assessment approach. The Environmentalist, 29(1), 17–32. doi:10.1007/s10669-008-9176-2
- Kant, S., Singh, Y. V., Jat, L. K., Meena, R., & Singh, S. N. (2015). Assessment of ground water quality of lahar block, Bhind district in Madhya Pradesh. International Journal of Advanced Geosciences, 3(2), 38–41. doi:10.14419/ijag.v3i2.4949
- Khan, R., & Jhariya, D. C. (2016). Land use land cover change detection using remote sensing and geographic information system in Raipur municipal corporation area, Chhattisgarh. SSARSC International Journal of Geoinformatics, 3(1), 1–4.
- Khan, R., & Jhariya, D. C. (2017). Groundwater quality assessment for drinking purpose in Raipur city, Chhattisgarh using water quality index and geographic information system. Journal of the Geological Society of India, 90(1), 69–76. doi:10.1007/s12594-017-0665-0
- Kotti, M., Zacharioudaki, D. E., Kokinou, E., & Stavroulakis, G. (2018). Characterization of water quality of Almiros river (Northeastern Crete, Greece): Physicochemical parameters, polycyclic aromatic hydrocarbons and anionic detergents. Modeling Earth Systems and Environment, 4(4), 1285–1296. doi:10.1007/s40808-018-0504-3
- Kumar, S. K., Rammohan, V., Sahayam, J. D., & Jeevanandam, M. (2009). Assessment of groundwater quality and hydrogeochemistry of Manimuktha river basin, Tamil Nadu, India. Environmental Monitoring and Assessment, 159(1), 341–351. doi:10.1007/s10661-008-0633-7
- Kumar, P. S., Singh, A., & Shrestha, D. P. (2016). Influence of water level fluctuation on groundwater solute content in a tropical south Indian region: A geochemical modelling approach. Modeling Earth Systems and Environment, 2(4), 1–9. doi:10.1007/s40808-016-0249-9
- Little, J., Kalischuk, A., Gross, D., & Sheedy, C. (2010). Assessment of water quality in Alberta’s irrigation districts. In Alberta agriculture and rural development. Alberta, Canada.
- MacDonald, A. M., Bonsor, H. C., Ahmed, K. M., Burgess, W. G., Basharat, M., Calow, R. C., & Yadav, S. K. (2016). Groundwater quality and depletion in the Indo-Gangetic Basin mapped from in situ observations. Nature Geoscience, 9(10), 762–766. doi:10.1038/ngeo2791
- Milovanovic, M. (2007). Water quality assessment and determination of pollution sources along the Axios/Vardar river, Southeastern Europe. Desalination, 213(1–3), 159–173. doi:10.1016/j.desal.2006.06.022
- Rodell, M., Velicogna, I., & Famiglietti, J. S. (2009). Satellite-based estimates of groundwater depletion in India. Nature, 460(7258), 999–1002. doi:10.1038/nature08238
- Rubia, K., Jhariya, D. C., & Singh, V. K. (2015). Urbanization and its impact on ground water: An overview. In Workshop on Groundwater issues and challenges in Chhattisgarh state with special references to its conversations, security and quality, Central Groundwater Board, NCCR Raipur Chhattisgarh.
- Salifu, M., Yidana, S. M., Osae, S., & Armah, Y. S. (2013). The influence of the unsaturated zone on the high fluoride contents in groundwater in the middle voltaian aquifers—the Gushegu District, Northern region of Ghana. Journal of Hydrogeology and Hydrologic Engineering, 2(2), 0–45.
- Sarkar, A. A., & Hassan, A. A. (2006). Water quality assessment of a groundwater basin in Bangladesh for irrigation use.
- Stallard, R. F., & Edmond, J. M. (1983). Geochemistry of the Amazon: 2. The influence of geology and weathering environment on the dissolved load. Journal of Geophysical Research: Oceans, 88(C14), 9671–9688. doi:10.1029/JC088iC14p09671
- Subramani, T., Elango, L., & Damodarasamy, S. R. (2005). Groundwater quality and its suitability for drinking and agricultural use in Chithar river Basin, Tamil Nadu, India. Environmental Geology, 47(8), 1099–1110. doi:10.1007/s00254-005-1243-0
- Tiwari, A. K., De Maio, M., Singh, P. K., & Mahato, M. K. (2015). Evaluation of surface water quality by using GIS and a heavy metal pollution index (HPI) model in a coal mining area, India. Bulletin of Environmental Contamination and Toxicology, 95(3), 304–310.
- Tiwari, A. K., Singh, A. K., Singh, A. K., & Singh, M. P. (2017). Hydrogeochemical analysis and evaluation of surface water quality of Pratapgarh district, Uttar Pradesh, India. Applied Water Science, 7(4), 1609–1623. doi:10.1007/s13201-015-0313-z
- Wakode, H. B., Baier, K., Jha, R., Ahmed, S., & Azzam, R. (2014). Assessment of impact of urbanization on groundwater resources using Gis techniques-case study of Hyderabad, India. International Journal of Environmental Research, 8(4), 1145–1158.
- Wani, R. A., Mir, A. H., Tanveer, A., Jehangir, A., & Yousuf, A. R. (2014). Preliminary study on irrigational quality of some ground water sources of Kashmir, India. International Journal of Scientific & Engineering Research, 5(2), 318–323.
- Wijnen, M., Augeard, B., Hiller, B., Ward, C., & Huntjens, P. (2012). Managing the invisible: Understanding and improving groundwater governance.