?Mathematical formulae have been encoded as MathML and are displayed in this HTML version using MathJax in order to improve their display. Uncheck the box to turn MathJax off. This feature requires Javascript. Click on a formula to zoom.
ABSTRACT
This paper aims to develop a computational model to assess and evaluate the annual water level fluctuation (WLF) impacts and their trends along any open channel (river, canal or lake) and provide reliable information that may help handle their implications. The impacts are related to water recession, flood plain areas, uncovered river bars and islands, locations of navigation bottle necks, and dredging works. The model is developed using Excel Spreadsheet VBA Coding. It computes the horizontal and inclined recession distances that govern water in take construction. It also computes the uncovered flood plain areas along the river reach to avoid encroachments and human interventions. In addition, it identifies the number of bar sand islands that emerge at low water levels to protect them against infringements. It also determines the locations of navigation bottle necks and computes the dredge volumes required. It can handle long river reaches quickly. Moreover, it is open-accessed where no hard locks or license renewals are required. It is run on Microsoft Excel which is an available and familiar environment to engineers. Therefore, the model can be a quick and powerful tool to support the decision-making process for projects related to such impacts, especially at the prefeasibility study stages. Reach '1' of River Nile in Egypt was taken as a case study to apply the model and show its capabilities in assessing the WLF impacts. This could help compute and analyze the size of the impacts and conceive their trends. Finally, the model could provide information about the impacts in concrete figures which can support decision making in coping properly with the impacts.
Introduction
In unregulated water basins, WLF occurs naturally in response to climatic and hydrological forcing (Zohary & Ostrovsky, Citation2011). As for open-regulated channels (rivers, canals, and lakes), WLF is defined as the variation of water stages between low and high over a certain period of time according to water discharges released and consumption. In rivers that provide water for drinking, agricultural irrigation, cooling for power plants, tourist cruising, hydropower, cargo transport, and many other services, WLF should be controlled to ensure minimum water waste. Wang, Wang, Gao, and Han (Citation2020) stated that WLF is a key factor that regulates the allocation of water resources in river basins. Hiatta et al. (Citation2019) also stated that it varies significantly across temporal and spatial scales and is subject to influences from river flow, tides, vegetation, atmospheric forcing, climate change, and anthropogenic activities. Hydraulic structures (such as dams, barrages, weirs, and locks) are, therefore, built across natural streams and rivers to control water flows and manage fluctuated water levels (Chanson & Felder, Citation2018). In short, WLF is an important process that enables an open channel to accomplish its duties with minimum water waste.
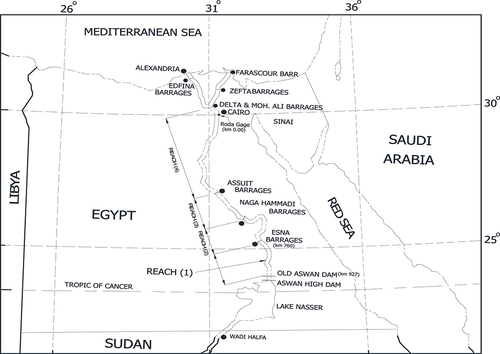
According to an NWRP Project (Citation2005) and Encyclopedia Britannica (Citation2022), the water flowing into River Nile from south (upper Egypt) to north (Lower Egypt) is controlled by a system of transversely constructed hydraulic structures (). This system comprises Aswan High Dam (AHD) in the south which detains, impounds, and controls the water coming into Egypt from the Nile basin countries. Also, the system includes a number of barrages dividing the main river stream which extends for about 950 km from Aswan to Cairo into four reaches. These barrages are New Esna, New Naga Hammadi, New Assuit, and Delta, respectively, as you go down the river until Cairo. Then, the river is divided into two main branches (Damietta and Rosetta) about 20 km downstream Cairo. Damietta has three barrages (Delta, Zefta, and Farascour), whereas Rosetta has two (Delta and Edfina). Under certain operation rules, AHD controls the annual flow rates released into the river channel according to the country's basic water requirements in order to minimize water waste. Also, the barrages provide each reach of the river with its necessary water needs. This process is called the annual water cycle of the river. During this cycle, the released discharges downstream AHD, the barrages, and the corresponding water levels along the river reaches fluctuate from minimum to maximum causing impacts on some river-related crucial activities which will be evaluated in this study. Apart from the unavoidable riverbed morphological changes that occur, the maximum drop in water level, for instance, causes maximum reduction in depth which results in creating navigation bottlenecks that, in turn, lead to disruption of river navigation and cargo transport. Also, this drop uncovers large areas of river floodplains, bars, and islands which entice all kinds of encroachments. According to Smith and Ward (Citation1998), nearby river residents are always tempted to occupy uncovered floodplains and islands. Moreover, the drop causes the river shoreline to recede offshore (Hekal, Citation2015). This informs about how long riverside water intake extraction pipes should be extended into the river channel. Consequently, it gives a preliminary conception of the cost of the construction.
Figure 1. A map of Egypt showing AHD and the Barrage system that controls water distribution along the Nile (Source: NWRP Project, Citation2005).
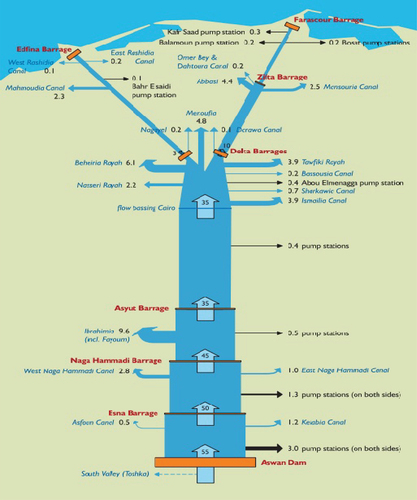
Water distribution along the Nile (Source: NWRP Project, Citation2005)
The aim of this study is to develop a model by Excel Spreadsheet Coding that helps assess the above mentioned impacts resulting from the annual WLF cycle along River Nile in Egypt. The model is basically intended to compute the maximum water surface recession distance expected at any cross section throughout a river reach during the annual water cycle. This influences the construction cost of a bridge carrying water abstraction pipes to a riverside water intake. Also, it computes the uncovered floodplain areas on both sides of the river channel and determines the numbers and widths of uncovered river bars and islands at any water level. This helps to identify the floodplain areas and river bars and islands that emerge during a certain water level and might be encroached. Recognizing the uncovered floodplain areas may help officials to set the best regulation rules and practices to benefit from these lands. Moreover, the model locates the bottlenecks along the navigational route and computes the areas and volumes of bed material to be dredged. In this way, the model can be used as a quick warning and powerful tool during prefeasibility study stages of river engineering projects related to the impacts resulting from the annual WLF. Accordingly, it helps support the right decision-making process and gives a general conception of the project area before implementation.
Materials and methods
Microsoft excel as a platform for developing engineering models
It is known that Microsoft Excel under Windows Office Environment (MERG “Microsoft Excel Reference Guide,” Citation2022) and the versions before are used for developing spreadsheets that can be used for handling multiple purposes of civil engineering concepts. Oke (Citation2004) stated that spreadsheets became a popular computational tool and a powerful platform for performing engineering calculations. Spreadsheets are a scientific tool that facilitates the tedious and repetitive computational tasks that may be performed manually. For instance, thousands of computations could be carried out and automated in a way that gives precise and timely results and a good opportunity for high-quality presentations (Cuttle, Young, & Heath, Citation1995; Di Antonio, Citation1986; Gianini, Nash, & Quon, Citation1995; Hendry & Green, Citation1994; Nash & Quon, Citation1996; Walkenbach, Citation1999).
Spreadsheets first appeared on personal computers in 1979 in the form of VisiCalc, an application developed to help with accounting tasks (Barker & Sugden, Citation2003; Zaneldin & Ashur, Citation2008). Since then, the spreadsheet program diverse applications have been re-appearing in scientific journals. Spreadsheets are, therefore, among the earliest software innovations that had influenced the use of personal computers so widely. Among the strong features of spreadsheets are their intuitive cell-based structure and the simple interface that is easy to use, even for first-time users (Hegazy & Ersahin, Citation2001a and Hegazy et al. Hegazy & Ersahin, Citation2001b). There are many examples of models developed by Excel spreadsheets in the literature. Ickert and Hutson (Citation2005) developed a spreadsheet to analyze multiple solutions for engineering problems and produce graphs that convey the solution to the end users. Thiriez (Citation2001) developed spreadsheets to be used as educational tools for students. One example is to use the drawing capabilities of Excel to represent decision trees and where window switching and macros allow the educator to animate his presentation. Another example presented by Thiriez (Citation2001) is the use of Excel in dynamic (deterministic or stochastic) programming, where Excel functions facilitate the development of specialized models.
Model development
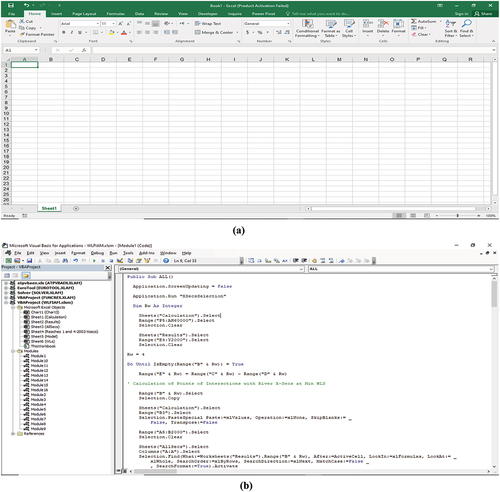
The model used in this paper is developed using Excel Spreadsheet Visual Basic for Application (VBA) Coding. Program Excel has two interfaces as shown in ; one is a spreadsheet with columns and rows intersecting at rectangular cells where you can store data, establish data bases, and run mathematical operations. The other shows some VBA coding. In this interface page, you can insert and/or edit subroutines and modules, establish user-forms with VBA Coding, and link between the cells in the first interface and do more sophisticated mathematical operations, Do … Loops, IF Statements, and others. Also, you can simply switch between the two interfaces by pressing “Alt + F11" simultaneously.
Figure 2. a: Interface “1” showing columns and rows with rectangular cells ready for doing mathematical calculations. b: Interface “2” showing part of VBA Coding.
The model developed for the work of this research used the two interfaces to do the mathematical operations needed. It consists of two “Excel” files or workbooks as follows:
Workbook “1”
It is called “WLFIAM” which stands for (Water Level Fluctuation Impact Assessment Model). It computes and returns information necessary for decision-making support. The information can be conceptualized as shown in . It is as follows:
Figure 3. A definition diagram showing the information obtained by WLFIAM throughout a certain short river reach.
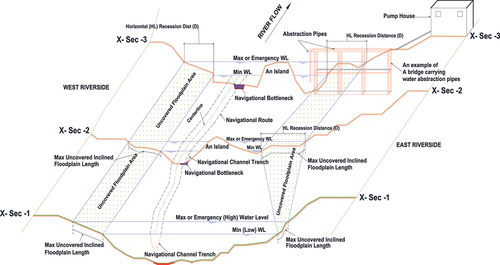
(1) Horizontal water recession distance between two high and low water levels on west (left) and east (right) river sides at each x-section of the river reach under study. This helps identify the minimum distances with which a water abstraction pipe-carrying bridge could be extended out offshore to reach the river water;
(2) Inclined uncovered floodplain lengths at both river sides due to water level drop. The lengths at two consecutive x-sections help compute the uncovered area between the two sections by taking the arithmetic mean for the two lengths and multiplying it by the distance between the two cross sections;
(3) Uncovered floodplain area between each two consecutive x-sections on both river sides due to water level drop. This helps obtain the maximum uncovered floodplain areas for a certain river reach on both sides;
(4) Points of intersections of Water Levels with each x-sections. This helps identify the number and locations of river bars and islands that appear at a certain water level.
WLFIAM consists of six worksheets as shown in and can be described as follows:
Figure 4. a: Sheet “model” showing model interface. b: sheet “results” showing final model results on the river west bank C: Sheet “AllSecs” showing x-secs data representing the river reach under study. d: Sheet “WLs” showing high and low WLs at x-secs. e: Sheet “Calculation” showing how the number of points of intersections at each WL are obtained at each x-sec. f: Sheet “Chart1” showing a chart for an optional x-sec with high and low WLs and points of intersections.
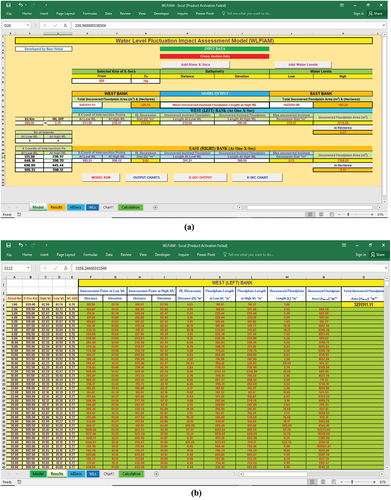
Figure 4. (Contined).
Sheet “Model” is the interface of the model where you can set the number/kilometers of the x-sections of the river reach under study and run the model. Then, you can choose the kind of information (as mentioned above) you want to obtain.
Sheet “Results” is the place where the model output is placed and the information needed is tabulated for each x-section.
Sheet “AllSecs” is an input data sheet where the data of each x-section is entered. The x-section kilometer is edited in column “A.” then, data is entered in the form of “Distance” and “Elevation” in columns “B” and “C,” respectively.
Sheet “WLs” is also an input data sheet where the high and low water levels at each x-section are entered. Column “A” has the kilometers of the x-sections, whereas columns “B” and “C” have data of high and low water levels, respectively.
Sheet “Calculation” is the place where mathematical calculations are done with the help of the subroutines (macros) edited in the Visual Basic for Application Coding. The sheet also contains some outputs such as the number of points of intersections of the high and low WLs with each x-section. These points are used for identifying the number of bars and islands. It is worth mentioning that the number of islands is equal to ((the number of points −2)/2).
Sheet “Chart” displays any kind of the information mentioned above. It also displays any selected x-section with the intersection points with the high and low water levels.
It is worth mentioning that these sheets work by macros (subroutines) written in VBA Coding. Only a short part of this coding is shown, as an example, in Appendix “A” because the whole coding is too long to be displayed in this paper.
Workbook “2”
It is called “WLFIAM-Dredge-V.” In this workbook, x-sections with navigation bottlenecks are determined. Also, areas to be dredged at each x-section throughout the navigation route are computed. Finally, the total dredge volume for the whole reach under study is computed (see Appendix B for the solution concept of dredging area computation). It is worth mentioning that computing channel dredging volume is critical for estimation of project cost (Zhengjian, Mingchao, & Denghua, Citation2012). Many methods have been presented in the literature (Weixiang, Xuhui, & Deyan, Citation2007), such as the section method (Zhensheng & Hanshun, Citation2007), contour method, square grid method (Kalmár, Papp, & Szabó, Citation1995), and digital elevation model (DEM) method (Yu Songbin, Citation2009). Each method has its individual features, applicable conditions, and different accuracies. However, none of these methods was programmed in Excel Spreadsheets VBA Coding. In this paper, the section method is used for calculating dredging volume by VBA. It is a traditional 2D approach. According to (Zhengjian, Mingchao, & Denghua, Citation2012), it is more suitable for complex terrain with large fluctuations, especially for narrow and long terrain.
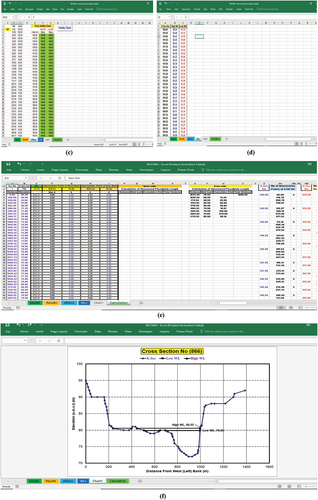
Workbook WLFIAM-Dredge-V consists of eight worksheets as shown in , and as described below:
Figure 5. a: Sheet “XYZ-SECTIONS” showing x-secs data (E, N, Elevation). b: Sheet “NavRoutedata” showing navigational route and x-section end point coordinates (E, N, Elevation) c: Sheet “Intersection-Points” showing computed final intersection points between x-secs and navigational route lines (E, N, Elevation). d: Sheet “Dredge Area” showing data of a x-sec and these of a navigational channel ditch (trapezoid) e: Sheet “Dredging Volume” where the different areas to be dredged are computed and the total dredge volume is obtained. f: Sheet “NavChpoints” showing the coordinates of the final points representing the area to be dredged and the x-sec data to be plotted on a chart. g: Sheet “Chart” where a chart for a selected x-sec is plotted showing the area to be dredged. h: Sheet “Sheet1” where the calculation of the area to be dredged is done.
Sheet “XYZ-SECTIONS” is a data entry sheet where x-sections representing the study reach are stored in the form of “Easting,” “Northing, and “Elevation” in columns “B,” “C,” and “D,” respectively. As for the kilometer of each x-section, it is entered in column “A” beside the first row of each x-section;
Sheet “NavRouteData” is a data entry sheet where coordinates “Easting” and “Northing” of the points connected to mark the sides and centerline of the navigational route are entered. Also, coordinates “Easting” and “Northing” of the end points of Each x-section are entered;
Sheet “Intersection-Points” is the sheet where the intersection points of each x-section with the three lines (West, Center, and East) representing the navigation route are computed and tabulated;
Sheet “Dredge Area” is the sheet where the data of the navigational channel ditch such as the side slopes and depth under the minimum water level are entered. Also, the minimum water level is entered. In addition, the channel navigational ditch base width and the distance of the centerline of the ditch from the start point of the x-section at the west are automatically computed from the intersection points computed in sheet “Intersection-Points” and entered in the table. Finally, the area to be dredged is computed at each x-section;
Sheet “Dredge Volume” is the sheet where the total dredge volume along the study reach is computed. In this sheet, the kilometer of each x-section, the corresponding minimum water levels, and the previously computed intersection points between the navigation route lines and x-sections are all entered;
Sheet “NavChPoints” is the sheet where the coordinates of the final points representing the area to be dredged are computed and tabulated for each x-section. Also, the navigational channel ditch coordinates at each x-section are computed and tabulated. Moreover, the x-section and water level data are prepared for each selected x-section to plot a chart.
Sheet “Chart” displays an x-section and the area to be dredged together with the navigational channel ditch and minimum water levels; and
Sheet “Sheet1” is where the calculation of the area to be dredged is done.
Model verification
In order to verify the results given by the model, AutoCAD was used. Some x-sections were selected and drawn in AutoCAD with Min and Max water levels. The horizontal and inclined uncovered recession distances were computed at both riversides as well as the uncovered floodplain areas. Also, dredging areas inside the navigational route channel ditch (trapezoid) at each x-section were computed. All the results were found identical with those given by the model.
Study area
River Nile Reach (1) as shown in was selected as a case study to apply the model. It extends for 167 km. It starts downstream Old Aswan Dam (OAD) at km (927) upstream “Roda” gage in Cairo and ends down at the new Esna Barrages, km (760) upstream “Roda.” Roda gage is taken as the start point of chainage (reference) along the River Nile within Egypt.
Figure 6. Map of Egypt showing the study area (Reach 1).
Data collection
Bathymetric data
To represent the study reach in the model, a number of 321 ×-sections (between km 920 and 760) throughout the reach with a spacing of 0.50 km were taken out (using software “SURFER”) from the most recent available topo-hydrographic survey maps of 2006 that were produced for the River Nile by the Nile Research Institute (NRI), the Survey Authority (SA), and the Remote Sensing Authority (RSA). Each cross section was obtained in the form of a set of points of three coordinates (Easting, Northing, and Elevation). The Easting and Northing coordinates are based on the Survey Reference System (Datum) of Egypt 1907, Map Projection Type (Egyptian Transverse Mercator “ETM”), Red belt zone, with which the maps were developed.
Hydrologic data
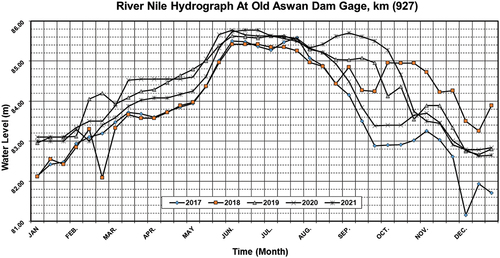
According to Nile Research Institute (NRI) database system (Citation2022), the annual WLF cycle indicates that the period of low discharges and water levels throughout the study reach occurs during winter season in months December, January, and February, whereas the high discharges and water levels take place during summer in months June, July, and August at OAD gage station, the beginning of the study reach. shows a water level hydrograph of 10-day average during the last 5 years (2017, 2018, 2019, 2020, and 2021).
Figure 7. A 10-day average water level hydrograph at OAD Gage.
Throughout Reach (1), there are 16 water level gage stations (graduated marble staffs). displays these gages and their corresponding kilometers upstream Roda gage. The daily records of water levels at these gages for previous 5 years were used to obtain the water levels at the 321 ×-sections selected to represent the study reach by interpolation using a spreadsheet macro developed by (Hekal, Citation2003). The water levels, shown in , represent the maximum water surface profile (WSP) when the study reach receives the maximum discharge released downstream OAD and the minimum WSP when the reach receives the minimum discharge. There are also four WSPs between the maximum and minimum WSPs with a 20% drop in water levels each.
Figure 8. Water Level Profiles throughout the study reach between OAD and Esna Barrages.
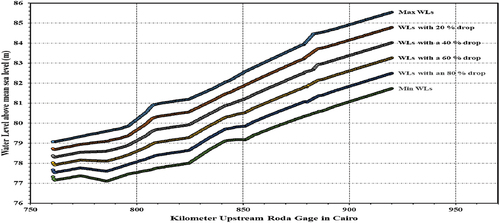
Table 1. Water Level Profiles throughout the study reach between OAD and Esna Barrages.
: Gage stations along reach (1) and their kilometers
Final model output and analyses
The model results revealed useful information that can help and support officials and decision makers and takers in river-related projects. The information is about the following:
Water recession distances
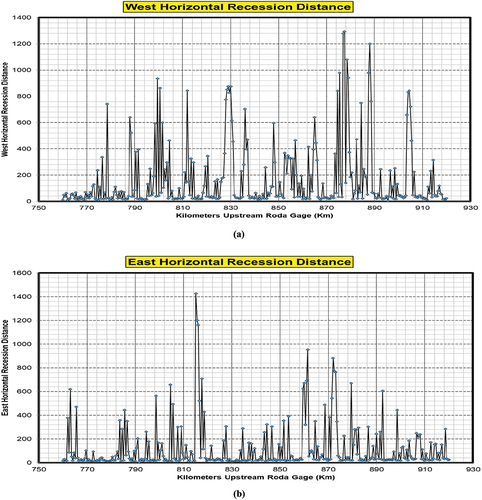
Horizontal water recession distances on both river sides (west and east) at every x-section were computed for the case when the river water surface level recedes from maximum to minimum. shows these distances along the study reach. It can be noted that the distances are not systematic and have no specific pattern or trend. They differ from x-section to x-section. It is worth mentioning that the distances influence the construction cost of the intake bridge that carries the abstraction pipes to reach out to water. The intake bridge is widely used in Egypt because of the water recession that takes place due to WLF. The longer the distances, the longer the bridge extension, the higher the construction cost. Finally, identifying these distances along the river supports the decision-maker at the pre-feasibility stage of any water intake project.
Figure 9. (a).Horizontal recession distance at river West side. (b).Horizontal recession distance at river East side.
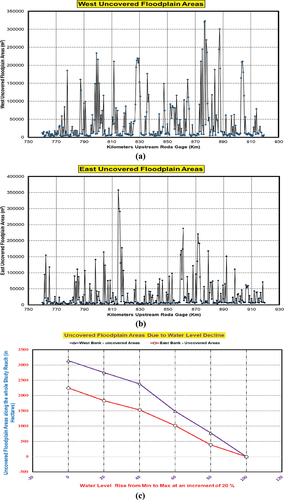
Uncovered floodplain areas
Due to WLF along the study reach, large floodplain areas get uncovered during winter season when water levels drop to minimum. shows these areas on both river sides. Also, reveals that the total uncovered areas on the west side are larger than those on the east side along the annual water cycle. The model was run several times during which the high water level was reduced by 20% until it reached the minimum values. Recognizing these areas helps decision makers in advance to set strategies to make best use of these lands, especially in seasonal agriculture and protect them from encroachments by nearby residents. Of course, more attention should be given to the river west bank because the uncovered floodplain areas are larger.
Figure 10. a: West uncovered floodplain areas at river West bank during minimum water levels. b: East uncovered floodplain areas at river East bank during minimum water levels. c: Total uncovered floodplain areas at river west bank are larger than those at the east bank during WLF over the water year.
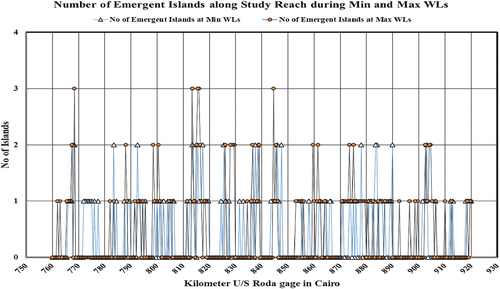
River Islands
The model can identify the number of islands at any x-section that emerge during any water level. Therefore, the model revealed these islands at min & max water levels as it was run for these two levels. shows the number of these islands. It is important to recognize the river islands that get uncovered during any water level in order to protect them from squatters and occupiers on the one hand and to use them in beneficial agricultural or any other activities on the other.
Figure 11. Number of emergent islands at each x-section along the study reach during Min & Max WLs.
Navigation bottleneck determination
The model can locate the bottlenecks throughout the navigational route and compute the areas and volumes of bed material to be dredged. It is known that the bottleneck is an obstacle for inland navigation that could be found along the navigational route. It occurs due to riverbed aggradation resulting from WLF and human activities and interventions in the river (El-Hazek, Badway, Elsersawy, & Rezk, Citation2020). Running the model, it could locate the bottlenecks (the areas to be dredged) at 98 different x-sections representing the study reach. shows the locations and areas to be dredged at each x-section. It is worth mentioning that the navigational route ditch is 100 m wide with side slopes of scale 1-unit vertical to 5-unit horizontal and 2.30 m depth under minimum water level. shows the model output for the areas to be dredged at every x-section along the study reach and the total dredge volume.
Figure 12. Locations of navigational bottlenecks and the areas to be dredged.
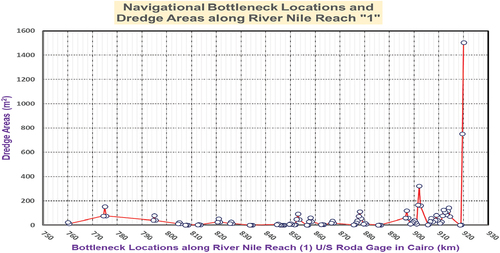
Table 2. Part of the model output table that displays the areas to be dredged at each x-section and the total dredge volume required along the study reach.
Conclusion
Successful management of river long reaches requires powerful tools to process bathymetric and hydrologic data and return feedback information that supports decision makers on river engineering projects. Computational models are among the tools that can process and analyze data efficiently and quickly. Over the past four decades, Microsoft Excel has proven to be a good platform to develop computational models using VBA. It can facilitate and expedite data processing and provide reliable information. In this paper, a model for assessing WLF impacts along River Nile has been developed. It has managed to analyze the bathymetric and hydrologic data of River Nile Reach (1), prepare and provide important information about the trends of the maximum recession distances, uncovered floodplain areas, river islands, and navigational bottlenecks throughout the whole reach. This huge information has been deemed indispensable for supporting the decision-making process on river-related engineering projects such as water intake bridge construction, dredging works, and floodplain management strategies, especially at the pre-feasibility study stages.
Recommendation
The developed model should be used to assess all WLF impacts on other River Nile reaches. It can be also applied on rivers, lakes and canals anywhere worldwide.
Disclosure statement
No potential conflict of interest was reported by the authors.
References
- Barker, J., & Sugden, S. (2003). Spreadsheets in education– the first 25 years. SIE Journal, 1(1), 18–43.
- Chanson, H., & Felder, S. (2018). Chapter 2, “Hydraulics of selected hydraulic structures”, australian research council. In Open channel hydraulics: River hydraulic structures and fluvial geomorphology (pp. 25–46). Grants DP0878922 & DP120100481.
- Cuttle, M. L., Young, C. P. L., & Heath, S. B. (1995). A practical introduction to creating courseware with Microsoft Excel. Scotland, UK: CTI CLUES, University of Aberdeen.
- Di Antonio, A. E. (1986). Spreadsheet Applications. Prentice-Hall.
- El-Hazek, A. N., Badway, N. A., Elsersawy, H. M., & Rezk, E. (2020). Evaluating the morphological changes and navigation bottlenecks for the fourth reach of the Nile river. Journal of Scientific and Engineering Research, 7(10), 106–120. Available online at. www.jsaer.com
- Encyclopedia Britannica, (2022). https://www.britannica.com/place/Nile-River/Dams-and-reservoirs. (accessed on May 13, 2022).
- Gianini, J., Nash, J. C., & Quon, T. K. (1995). Statistical issues in spreadsheet software, 1994. In Proc. Statistical education section (pp. 238–241). American Statistical Association, Arlington VA.
- Hegazy, T., & Ersahin, T. (2001a). Simplified spreadsheet solutions. I: Subcontractor information system. Journal of Construction Engineering and Management ASCE, 127(6), 461–468. https://doi.org/10.1061/(ASCE)0733-9364(2001)127:6(461)
- Hegazy, T., & Ersahin, T. (2001b). Simplified spreadsheet solutions. II: Overall schedule optimization. Journal of Construction Engineering and Management ASCE, 127(6), 469–475. https://doi.org/10.1061/(ASCE)0733-9364(2001)127:6(469)
- Hekal, N., (2003). “Evaluation of Nile Flood Effects Downstream Flood Control Structures in Egypt”, Ph.D. Thesis, Ain Shams Univ. Egypt, Dec.
- Hekal, N. (2015, December). Effect of water surface recession on bridge-type intakes proposed along the river nile. International Water Technology Journal (IWTJ), 5(4).
- Hendry, D. G., & Green, T. R. G. (1994, June). Creating, comprehending, and explaining spreadsheets: A cognitive interpretation of what discretionary users think of the spreadsheet model. International Journal of Human Computer Studies, 40(6), 1033–1065. https://doi.org/10.1006/ijhc.1994.1047
- Hiatta, M., Snedden, G., Day, J. W., Rohlia, R. V., Andrew Nymanc, J., Lane, R., & Anne Sharp, L. (2019). Drivers and impacts of water level fluctuations in the mississippi river delta: Implications for delta restoration. Estuarine, Coastal and Shelf Science Journal, 224, 117–137. August 31, 2019. https://doi.org/10.1016/j.ecss.2019.04.020
- Ickert, R., & Hutson, A., (2005). Hydraulic modeling of transmission systems using spreadsheets. The 2005 Pipeline Division Specialty Conference. August 21–24, 2005, Houston, Texas, USA.
- Kalmár, J., Papp, G., & Szabó, T. (1995). DTM-based surface and volume approximation: Geophysical applications. Computers & Geosciences, 21(2), 245–257. https://doi.org/10.1016/0098-3004(94)00069-7
- MERG “Microsoft Excel Reference Guide”. (2022). Redmond (Wash): Microsoft Corp.
- Nash, J. C., & Quon, T. K. (1996). Issues in teaching statistical thinking with spreadsheets. Journal of Statistics Education, 4(1), 1996. https://doi.org/10.1080/10691898.1996.11910503
- Nile Research Institute. (2022). NRI library, database system, national water research center, ministry of water resources and irrigation. Cairo, Egypt: El-Qanater El Khiaria.
- NWRP Project. (2005, January). A report on the national water resources plan for egypt – 2017. Ministry of water resources and irrigation. Cairo.
- Oke, S. A. (2004). Spreadsheet applications in engineering education: A review. International Journal of Engineering Education, 20(6), 893–901.
- Smith, K., & Ward, R. (1998). FLOODS, physical processes and human impacts. Wiley. ISBN.
- Thiriez, H. (2001). Improved or education through the use of spreadsheet models. European Journal of Operational Research, 135(3), 461–476. https://doi.org/10.1016/S0377-2217(01)00099-6
- Walkenbach, J. (1999). Microsoft excel 2000 power programming with VBA, IDG books. Foster City (CA).
- Wang, G., Wang, L., Gao, Y., & Han, R., (2020). “Water level fluctuation of rivers and lakes: An important approach for ecological regulation of river basins”, Project: Response Mechanism of Submerged Macrophytes to Water Level Fluctuation in Eutrophic Shallow Lakes (NSFC_41971043), Nanjing Normal University, School of Environment, Article published in July 2020. ( accessed on Research Gate on May 12, 2022).
- Weixiang, Q., Xuhui, X., & Deyan, Z. (2007). Discussion on earthwork calculation method for land leveling up in Zixi industrial area. Surveying and Mapping of Geology and Mineral Resources, 23(4), 11–13. in Chinese.
- Yu Songbin. (2009). Application of 3D design software in channel construction quantity calculation. GX Water Resources and Hydropower Engineering, 2009(6), 64–67. (in Chinese).
- Zaneldin, E., & Ashur, S., (2008). Using spreadsheets as a tool in teaching construction management concepts and applications. The 2008 American Society of Engineering Education (ASEE) Annual Conference. June 22-25, 2008, Pittsburgh, PA, USA.
- Zhengjian, M. I. A. O., Mingchao, L. I., & Denghua, Z. H. O. N. G. (2012). Numerical calculation of channel dredging volume using 3d digital stratum model. In Transactions of Tianjin University Berlin Heidelberg: Tianjin University and Springer-Verlag . Vol.18, Issue No.2, 2012, China. https://doi.org/10.1007/s12209-012-1714-9
- Zhensheng, Q., & Hanshun, W. (2007). On a calculation and plotting program of earth and stone quantity based on the AutoCAD profile method. Geology of Fujian, 26(2), 117–125(in. Chinese.
- Zohary, T., & Ostrovsky, I. (2011). Ecological impacts of excessive water level fluctuations in stratified freshwater lakes. Journal of Inland Waters, 1(1), 47–59. https://doi.org/10.5268/IW-1.1.406
Appendix A:
Part of WLFIAM Coding in VBA
Appendix B:
Solution Concept of Dredging Area/volume Computation
Suppose there is a river x-section made up of 30 points intersecting the proposed navigational route trapezoid (ABCD) as shown in . It is required to compute the area of the two hatched regions or closed polygons whose vertices are (E,9,10,11, F,12, G, B) and (H,16,17,18, I,19,20, J, C), respectively. These regions lie within the boundaries of the navigational route x-section and need to be dredged. The procedure applied in the Model simply deals with the trapezoidal x-section as if it were made up of three parts, namely the triangular left part (ABK), the rectangular middle part (KBCL), and the triangular right part (LCD) as shown in .
Middle Part The model starts with the middle part where it searches for all the points above the trapezoid lower base and belongs to the x-section points. Also, it computes the coordinates of the intersection points of the x-section and the trapezoid lower base which are (G) and (H) in this case. Moreover, it finds the coordinates of the intersection points of the x-section and the two verticals (BK) and (CL), respectively. It uses the intersection equation of two straight lines.
Left PartAs shown in , the model task here is to find the coordinates of the points contained between the two verticals (AX) and (BK) and the sloped line (AB) and belong to the x-section points. To find the points, the model searches for the points which theoretically make with point “A” imaginary lines (see dashed lines) whose slopes are bigger than or equal to that of line (AB) and subject to the above containment conditions. It should be remembered that the slope increases in the anti-clockwise direction according to the Cartesian coordinate system shown. Also, the model computes the coordinates of the intersection points of the x-section and line (AB) such as point “E” in this example.
Right PartThe same concept applied in the left part is followed here. The Model searches for the points contained between the two verticals (DX) and (CL) and the sloped line (CD) and belonging to the surveyed x-section dataset. In this case, the slopes of the lines made of these points and point “D” must be smaller than or equal to that of line (CD). Also, the Model computes the coordinates of the intersection points of the x-section and line (CD) such as point “J.” Finally, the coordinates of the obtained points together with the coordinates of the corners of the navigational channel x-section that lie under the x-section line are arranged in a manner that helps draw a closed polygon. Then, using the equation of the closed polygon area mentioned below, the area to be dredged is computed. Again, the model uses a Do … Loop to apply the same procedure to all the x-sections covering the navigational route under study.
Where -“i” indicates the number of point in the arranged order; “n” indicates the total number of points; and X & Y are the point coordinates. Once the areas to be dredged at each x-section are computed, the total dredge volume is obtained by multiplying the average area between every two consecutive x-sections ((A1 +A2)/2) by the distance between the two sections along the centerline of the navigational route.
Figure A1. (A ~ c): Solution concept of dredging area computation.