
 ?Mathematical formulae have been encoded as MathML and are displayed in this HTML version using MathJax in order to improve their display. Uncheck the box to turn MathJax off. This feature requires Javascript. Click on a formula to zoom.
ABSTRACT
It is essential to identify the spatial distribution and use of water resources for developing appropriate strategies for their use. Therefore, this work aimed to estimate the spatial distribution of economic and ecological Water Use Profit (WUP) and relate it to the Normalized Differential Water Index (NDWI) and evapotranspiration in the San Luis Potosí state, México. When calculating or obtaining the NDWI, this indicator is associated with values of evapotranspiration concentrations that are obtained spatially in the various portions of the territory, since in SLP territory the climate and soil moisture vary from one region to another, as there are 4 different regions. The methodology in this study involved a multitemporal analysis of the WUP in the State corresponding to 1990, 2000, 2010, and 2015, since it is an indicator that measures the uses and water exploitation in a region obtained over time, which is why it is called multitemporal, since we are talking about a 25-year period of analysis and the result is different from one place to another in San Luis Potosi territory. This study was realized through the application of economic and ecological indicators which were evaluated, considering the economic and ecological activities that use water in the region; therefore, the behavior of ETR depends on the area and the economic and/or ecological activities that have been carried out in the period. Also, for understanding the behavior of water reservoirs in the basins in the study area, the NDWI was obtained from Landsat 8 imagery. The results of NDWI showed that, from 1990 to 2015, there was a decrease in moisture content, becoming more evident in 2000. This study found that secondary and tertiary activities significantly influence yearly economic value. From 1990 to 2000, the Gross Domestic Product (GDP) value doubled, while from 2000 to 2010 tripled, and for 2015 the increase was nearly 25% compared to 2010. The WUPeconomic’s and WUPecological’s highest values were obtained in the most important urban areas of the state because secondary and tertiary activities are mainly developed. It is precisely with this reasoning that the behavior of relationship between ETR and WUP is vital for the understanding of water consumption generated. Finally, the ETR’s highest values are in the Huasteca region of the state.
Introduction
At present, the problem of water management is an international phenomenon, which requires the development of global strategies to solve this situation (Cervera & Rubio, Citation2003). Likewise, for integrated water management, it is necessary to consider aspects of water security, managing strategies, or adequate mechanisms (Hoekstra, Buurman, & van Ginkel, Citation2018). According to international policies, proper water use should be standardized since it involves a necessary resource for human life, economic development, and ecological diversity (Polasky et al., Citation2019). Due to the inherent qualities of water resources (availability, quality, vulnerability, constant temperature, properties, etc.), water supply in urban and rural areas in developed and developing countries (Omarova, Tussupova, Hjorth, Kalishev, & Dosmagambetova, Citation2019) remains a demographic problem and requires deep scientific analysis. The water use profit (WUP) is an index that measures the benefits of ecological, economic, or social systems from water consumption. Following the profit, this index is classified as environmental, commercial, or social (Huang, Jiang, Zhuang, Zhu, & Fu, Citation2014). The indicator of economic water use profit (WUPeconomic) is an index based on an annual economic census; namely, it is the relationship between the Gross Domestic Product (GDP) and Real Evapotranspiration (ETR) of a region (Lu & Zhuang, Citation2010). At the same time, the Ecological Water Use Profit Index (WUPecological) refers to living organisms that derive from the ecosystem functions that maintain the life system on Earth. In both cases, evapotranspiration is essential since it is considered total water consumption on a regional scale, just as it relates to water availability in a determined area.
Recently, it has increased the interest in the comprehension of the water use profit as a concept associated with productivity, that is, the demonstrated efficiency in the results or benefits obtained (Horne et al., Citation2018). Productivity is the relationship between the supply and resulting units (Linna, Pekkola, Ukko, & Melkas, Citation2010). In this case, water productivity indicates the quantity or product value over the volume or water value consumed (Upadhyaya & Alok, Citation2016).
So, the benefits gained from water use are getting more and more attention from governments, scientists, environmental scholars, and those in charge of its management (Cosgrove & Loucks, Citation2015). Besides, Randall (Citation1981); Hajkowicz and Higgins (Citation2008); Smajgl, Larson, Hug, and De Freitas (Citation2010), have pointed out that water resources are fundamental to social and economic well-being.
Luo (Citation2003) suggests that the water use index has become an essential tool for the sustainable management of water resources. On the other hand, Huang, Vause, Ma, and Yu (Citation2013), consider the social benefit of water consumption as an attribute of public welfare. However, there is no universal method to calculate this benefit. Often it is difficult to apply research results to management strategies because, most of the time, the hydrological research is carried out in specific areas (Miljković et al., Citation2018). Moreover, the studies carried out are applied to urban areas, so it is challenging to implement them at regional scales. Assessment and management of water resources are inherently geographical activities that require integrating and analyzing spatial data (Yu et al., Citation2019).
Currently, global warming and biodiversity loss have increased the alterations in the ecosystems in the world (Sintayehu, Citation2018). Both phenomena have increased exponentially due to urban and industrial development (Fagbohunka, Citation2015; Naudé, Citation2011). The impacts on the water cycle and the change in land use affect the amount of stored water, which alters the rates of infiltration and evapotranspiration rates (Martínez-Retureta et al., Citation2020). Therefore, it is necessary to evaluate the possible effects on the water (Kazama & Oki, Citation2006). Thus, the emerging alternatives to study the problem should focus on establishing management plans to distribute the spatial indicators of water and climatic effects (Meyer & Priess, Citation2014).
This work aimed to estimate the spatial distribution of the economic and ecological WUP in the State of San Luis Potosí.
This analysis used Geographic Information Systems (GIS), Geostatistics, and Remote Sensing techniques.
Materials and methods
The methodology in this study involved a multitemporal analysis of the WUP in the State of San Luis Potosí corresponding to 1990, 2000, 2010, and 2015. This research was realized through the application of economic and ecological indicators that involve variables that explain how water resources are used, for which the methodologies proposed by Huang, Jiang, Zhuang, Zhu, and Fu (Citation2014); Smajgl, Larson, Hug, and De Freitas (Citation2010), were modified, identifying the problem and adapting the strategy to the conditions geographical of San Luis Potosí.
The state GDP’s value was determined and classified to associate with the different regions’ industrial and economic development, allowing us to consider the water requirement associated with the GDP’s development in the last three decades. Moreover, the state regions were classified according to concentrations of biodiversity, accumulated levels of humidity, and evapotranspiration. The last two variables were obtained from the processing of satellite images. These processes were generated to state scale and periods of droughts and rains. Next, a spatial analysis of these parameters was performed. Also, geostatistical indicators were determined using information of biodiversity concentrations, moisture, evapotranspiration, and elements of the expense associated with the water requirement, which agrees with the GDP recorded in different analysis periods in the state regions.
Study area
The San Luis Potosí state is located in North-Central Mexico, between the coordinates 21° 09’30“and 24° 33’ 09’“north latitude and 98° 19” 52” and 102 ° 17’51’’ west longitude (). It has an area of 61 138 km2, representing 3.2% of the country’s surface. The state’s population is 2,762,818, according to the population and housing census 2010, derived from the National Institute of Statistic and Geography (INEGI). The average annual temperature of the state is 21 ° C. While the average yearly rainfall is 950 mm, occurring from June to September, and reports that the climate is dry and semi-dry.
Figure 1. Location of the study area.
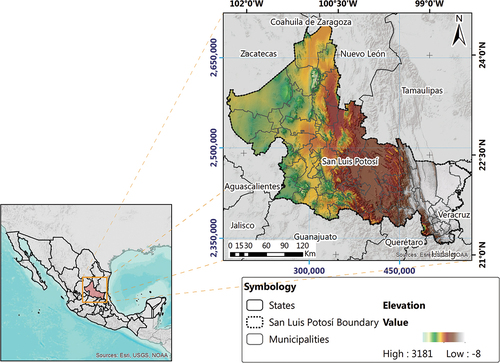
San Luis Potosí is bordered by eight Mexican states: Coahuila, Nuevo León, Tamaulipas, and Zacatecas to the north; Guanajuato, Hidalgo, and Querétaro to the south; Veracruz to the east, and Jalisco and part of the state of Zacatecas, to the west.
San Luis Potosí is a territory with differentiated geography; its heights vary between 20 and 2,680 meters above level sea. Hence, it is divided into four natural areas, with 58 municipalities. These regions are (I) The Center region, being the primary industrial entity of the state. It brings 81.4% to the regional GDP, harboring 49% of the regional population and employing 79% of the workers. (II) The Potosi Altiplano region, with some industrial activity, and an important strategic center of the United States market, producing 5.4% of GDP and harboring 12.9% of the population; (III) The Media region, without industrial zones, but with a considerable number of small and medium enterprises, produces 4% of GDP and concentrates 10.6% of the population. Moreover, (IV) The Huasteca region, located in the plain, brings 9.2% of the GDP and 27.8% of the population.
Data acquisition
For this study, economic data, land use, meteorologic information (temperature and precipitation), and imagery of Landsat 5 TM (1990, 2000, and 2010) and Landsat 8 OLI (2015) sensors were used.
Calculation of normalized differential water index (NDWI)
First, the Normalized Differential Water Index (NDWI) was calculated to estimate liquid water in the vegetation. Gao (Citation1996), defined this index as:
Where ρ represents the radiance in units of reflectance
Thus, NDWI is sensitive to changes in liquid water in vegetation (Serrano, Shahidian, & Marques, Citation2019). The calculation of evapotranspiration (ET) at the leaf level is mainly affected by stomatal conductivity, which is regulated by the intensity of the radiation, vapor pressure, water content in the soil, and CO2 concentrations. In comparison, the estimation of regional evapotranspiration is related to the vegetation canopy structure, soil moisture, and energy at the top of the vegetation canopy and soil surface. Therefore, the NDWI provides us with useful information for calculating ET. Besides, water availability in a region is closely related to evapotranspiration (Lu & Zhuang, Citation2010).
Calculation of real evapotranspiration (ETR)
The evapotranspiration was estimated through The Turc method (Sudheer, Viswanadh, & Ramana, Citation2017) for the seasons of drought and rainfall. This method relates the precipitation and the temperature for obtaining real evapotranspiration (ETR). The calculation of the ETR is oriented by the real conditions principle and considering that the vegetation cover is not always complete. In this study, ETR is associated with total water consumption generated in one region. Therefore, the ETR is calculated as:
Where ETR corresponds to the Evapotranspiration calculation, P is equal to the recorded rainfall (mm/year), and the parameter L depends on the annual average temperature (° C) T and is calculated as L = 300 + 25T + 0.05T3.
Spatial distribution for determining GDP
GDP is the monetary value of final goods and services produced by an economy in a determined period. This indicator measures the growth or decreases in the production of goods and services of companies in each country. Likewise, each state in the country has its indicator. In San Luis Potosí, the value was estimated in millions of pesos and distributed according to the economic activities defined by INEGI, considering the economic activities made in each region of San Luis Potosí and the percentage contribution to the state indicator. The GDP’s spatial distribution was calculated using the following equation:
Where GDPannual is the economy’s spatial distribution, GDPpri is the spatial distribution of the primary activities in the state, GDPsec is the spatial distribution of the secondary activities in the state, and GDPter indicates the spatial distribution of the tertiary activities.
Finally, the GDP’s spatial distribution was compared to the type of land use in the state using the equation (Huang, Jiang, Zhuang, Zhu, & Fu, Citation2014):
Where GDP is the result of multiplying the economic GDP by the land use area Aus (Km2).
Spatial distribution of the environmental service
The Environmental Service Value (ESV) corresponds to the benefits that living organisms bring, which help maintain the life system on Earth. In this case, the ESV is described as the quantity of federal water destined for the different types of activities that require their consumption. This indicator was defined as (Huang, Jiang, Zhuang, Zhu, & Fu, Citation2014):
Where ESV is the Environmental Service Value, Aus corresponds to the area in Km2 by type of land use, and Va is the volume of water, in m3, destined for consumption or activity developed.
In this case, the lack of data on the water volumes for the different activities generalizes the ESV’s spatial distribution model in such a way as to generate a panorama of the phenomenon.
Generation of land use mapping
Land use mapping in San Luis Potosí was performed by processing satellite data of Landsat 5 TM and Landsat 8 OLI. The radiometric correction was applied to these images to obtain radiance values. Also, the atmosphere effect on the image was eliminated using the Fast Line-of-sight Atmospheric Analysis of Hypercubes (FLAASH) algorithm. This algorithm reduced the radiance added to the pixels of each band by the effect of fog. Thus, obtaining reflectance values and correcting the atmospheric impacts, each pixel’s value is modified. Afterward, a supervised classification was applied using the Maximum Likelihood algorithm, with the classes: water bodies, farmland, urban area, bare soil, forest, pastureland, other vegetation, and scrubland. This algorithm is based on two principles: (1) the cells in each sample of classes of the multidimensional space that are usually distributed and (2) the Bayes’ decision theorem. It considers the variances and covariances of the classes by assigning each cell to one of the classes. If the distribution of a class sample is normal, it can be characterized by the mean value vector and the covariance matrix. Given these two characteristics for each cell value, the statistical probability of each class is calculated to determine the cells’ correspondence in each class.
As a result of the supervised classification, a raster file is generated, showing the classification’s confidence levels. The number of confidence levels is 14, directly related to the number of valid rejection fraction values. The first trust level, coded in the trust raster as 1, comprises cells with the shortest distance to any average value vector stored in the input signature file. Therefore, the classification of these cells has a higher certainty. The cells of the second confidence level (cell value 2 in the trusted raster) will be sorted if their reject fraction is 0.99 or less. The lower confidence level has a value of 14 in the trusted raster and shows cells that are possibly misclassified. Cells at this level are not classified when the rejection fraction is 0.005 or higher. Finally, the images are integrated into a mosaic that covers the whole state with a spatial resolution of 30 meters.
The spatial distribution model of water use profit (WUP)
Usually, the WUP is classified into three categories: economic use, human consumption, and ecological use. This index is essential for decision-makers, policy makers, environmental organizations, and water care professionals. For this reason, and due to population growth, soil deterioration, poor water quality, and future depletion, this index is a proposal for the sustainable management of water resources and, therefore, to ensure healthy development in society.
The economic water use profit (WUPeconomic)
The WUP is an index based on the annual economic census. It is derived from the data obtained from the GDP for San Luis Potosí. Data were classified by economic activity: primary, secondary, and tertiary. Geostatistical techniques were applied for calculating the spatial distribution.
Therefore, the WUPeconomic is obtained as follows (Huang, Jiang, Zhuang, Zhu, & Fu, Citation2014):
Where WUPeconomic is the spatial distribution of the use and profit of economic water, GDP corresponds to the annual economy’s spatial distribution, and ETR is the real evapotranspiration.
Ecological water use profit (WUPecological)
WUPecological is determined from the ESV’s estimation so that the ESV will be the relationship between different land uses in San Luis Potosí and the amount of national water extraction in the state. That is to say, the water demand by use (agricultural, agro-industrial, domestic, etc.). Under this relation, the value distribution (m3/year) of the environmental service or the water demand in the state for different uses is obtained. Then, based on the ESV’s spatial distribution, the WUPecological indicator will be obtained with the following formula (Huang, Jiang, Zhuang, Zhu, & Fu, Citation2014):
Where WUPecological is the use and the profit of ecologic water, ESV is the value of environmental service, and ETR is the spatial distribution of current evapotranspiration.
This indicator will show if the demand and extraction of water in San Luis Potosí correspond to the total water consumption associated with evapotranspiration.
Results and discussion
Data acquisition
For this study, it was used information on land use. Besides, monthly meteorological data (temperature and precipitation) were obtained for 1990, 2000, and 2010. These data were derived from 200 meteorological stations located throughout the state and provided by the National Water Commission (CONAGUA). For 2015, data were taken from the network of meteorological stations of the National Institute of Forestry, Agriculture, and Livestock Research (INIFAP). Likewise, state economic data on the GDP came from the Secretary of Economic Development of the Government of San Luis Potosí.
Similarly, we used information from CONAGUA on the volume of national waters destined to use or activity specific. Further, satellite data from the Landsat 5 TM sensor for the years 1990, 2000, and 2010 and the Landsat 8 OLI sensor for 2015 were used. shows the characteristics of the imagery used in this study.
Table 1. Imagery characteristics were used in this study.
Calculation of normalized differential water index (NDWI)
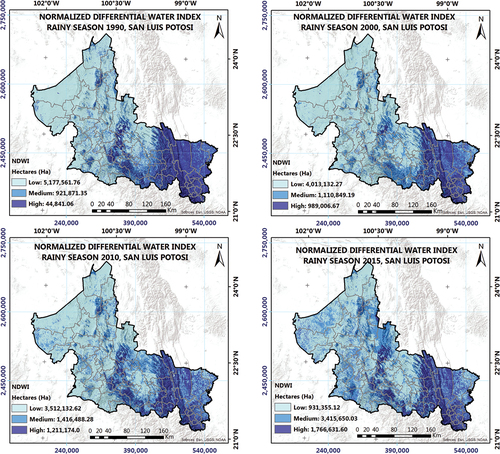
The NDWI’s estimation was necessary for understanding the behavior of the soil moisture. shows the NDWI´s estimation for the rainy season.
Figure 2. Rainy season’s NDWI.
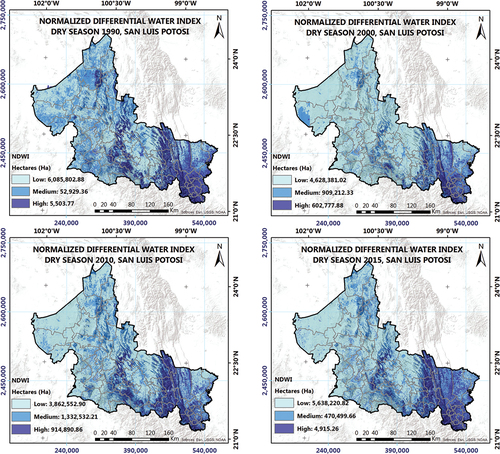
According to NDWI obtained for the dry season (from March to May), a considerable decrease in the humidity in the Media and central regions can be observed in the rainy season. Likewise, in the Huasteca region, though the highest concentrations of moisture were obtained, there was also a considerable decrease ().
Figure 3. Dry season’s NDWI.
The results of the NDWI showed that, from 1990 to 2015, there was a decrease in moisture content, becoming more evident in 2000, as Campos-Aranda (Citation2018), reported, a drought period in 2000 generalized in the state, which had a medium forcefulness. Thanks to this, it was found that NDWI turns out to be a helpful tool since the years and areas of drought could be preliminarily determined. Also, this index helped to understand the behavior of evapotranspiration over the analyzed period.
However, the NDWI’s values depend on different factors, such as land use. Therefore, this index must be complemented with precipitation data or anomaly calculation in NDWI to specifically identify a region’s drought or water stress.
Results of the real evapotranspiration
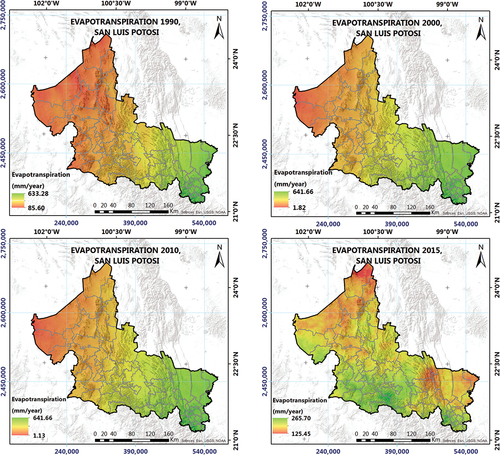
The ETR was obtained using the Turc method and geostatistical techniques (). For it, a spatial distribution model was generated from a Gaussian simulation. This method considers precipitation and temperature as essential variables for ETR calculation. For this study, meteorological data for 1990, 2000, and 2010 were obtained from 200 stations, while for 2015, only 28 stations were used. The highest ETR values are found in the Huasteca region of the state. According to Flores-Jiménez et al. (Citation2016), evapotranspiration increased in 2000 in the Huasteca region of San Luis Potosi. ETR computation through energy balance techniques using satellite images can be considered for this study since they generate continuous information with large-scale spatial coverage and a high precision level.
Figure 4. Distribution of the real evapotranspiration.
Spatial distribution of the GDP
The GDP’s spatial distribution allowed us to understand the growth of various economic sectors in the state and their evolution in the period analyzed. It was found that secondary and tertiary activities significantly influence the economic value produced each year. From 1990 to 2000, the GDP value doubled, while from 2000 to 2010 tripled, and for 2015 the increase was nearly 25% compared to 2010. Likewise, the highest GDP values were located mainly in the most important urban areas of the state, such as the metropolitan area of San Luis Potosí, as well as in the municipalities Matehuala, Rioverde, and Ciudad Valles. The primary goods and services generated in these cities correspond to tertiary activities, fundamentally dedicated to the industrial branch. In 2015, more significant variability in the results was observed because more detailed information was available than in previous years. shows the spatial distribution of the GDP.
Figure 5. GDP’s spatial distribution.
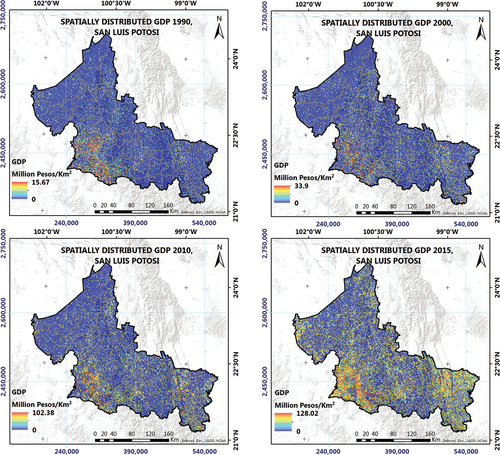
According to the results obtained, the state’s GDP increased from 1990 to 2015, coinciding with Martínez (Citation2018), who analyzed the economy of San Luis Potosí from 1990 to 2010.
Spatial distribution of the ESV through satellite image analyses
shows the ESV value’s spatial distribution through satellite image analysis.
Figure 6. Spatial distribution of ESV.
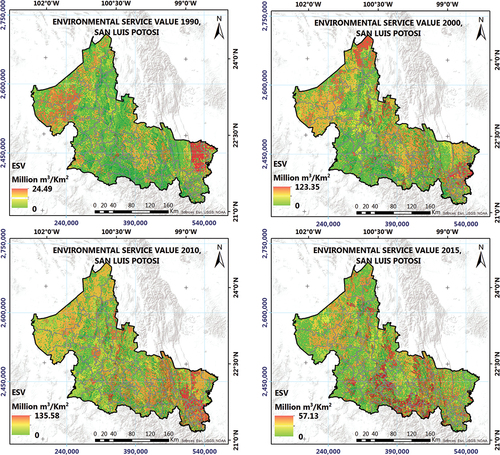
The ESV’s spatial distribution maps show that it increased from 1990 to 2000 but decreased in 2010 and continued to decline in 2015. Hasan, Shi, Zhu, and Ustaoglu (Citation2020), calculated the ESV in several regions of China, considering nine variables, but when only analyzing the variable water, which was the one considered in our study, it also decreased from 1986 to 2017. As for ESV calculation, the methodology proposes calculating the environmental services’ economic value (Huang, Jiang, Zhuang, Zhu, & Fu, Citation2014). However, it was decided to estimate ESV based on the volume of water used according to economic activities. Thus, analyzing how water is used in the state, which economic sectors have the most significant water-destined volume, and the relationship with land use. In general, 49.5% of the water extraction was used for primary activities, 16.6% for secondary activities, and 33.9% for tertiary activities. Accordingly, water is being used principally for agriculture. In this respect, the most significant volumes of water were destined in urban areas for household use, power generation, and industries that require much water. However, agricultural use also requires large volumes of water, which is also reflected in the distribution of the ESV.
Spatial distribution model of water use profit (WUP)
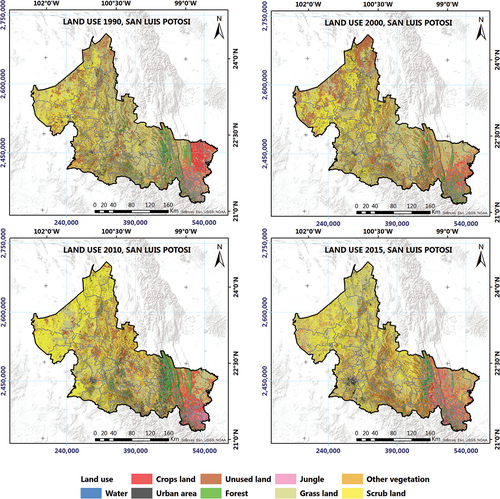
The WUP calculation (), derived from the GDP’s spatial distribution and ETR’s estimation in the state, shows water management behavior in San Luis Potosí within an economic sector. It can be observed that there is variability throughout the territory and time. The indicator shows that in urban areas, the highest values are found from 1990 to 2015 since, in these areas, the development of secondary and tertiary economic activities is concentrated. In the San Luis Potosí state, it was observed that the tertiary activities contribute many monetary resources that the state produces. The same occurs in Guanajuato and Querétaro, according to what was obtained by Thirión (Citation2020), who analyzed the regional development and structural change in three states in central Mexico. However, secondary activities also significantly contribute to the goods produced by the state. Castillo, Flores, and Rodríguez (Citation2014), analyzed the importance of the service sector in the Mexican economy and found that secondary activities are highly related to GDP growth. For primary activities (agriculture, livestock, and fishery), it can be observed that in the years 1990, 2000, and 2010, the WUP remained at low levels. However, in 2015, it increased the value of the WUP in the areas of the agricultural sector. Almonte, Rosales, and Carbajal-Suárez (Citation2020), show that from 1980 to 2015, the contribution of primary activities to GDP decreased from 4.2% to 3.2%. However, agricultural and industrial activities have increased significantly during this period.
Figure 7. Land use in the study area.
Results of the calculation of the WUPeconomic
shows the WUPeconomic’s spatial distribution in the state.
Figure 8. Spatial distribution of the WUPeconomic.
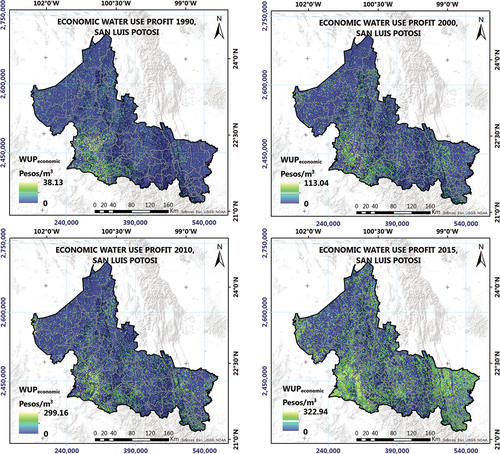
WUPeconomic determination allowed us to observe how economic activities have managed water. From 1990 to 2015, the highest values were obtained in the most important urban areas of the state because secondary and tertiary activities are mainly developed. WUPeconomic has the lowest values in areas dedicated to agriculture, indicating that it is more expensive to use water in populated areas where different economic activities are performed. Moreno-Pizani (Citation2021), mentions that in Venezuela, water scarcity occurs in places with the highest population concentration, in addition to the fact that most economic activities are located there.
Calculation of WUPecological
For this work, the WUPecological has a similar behavior throughout the period. That is, the highest values of the indicator are found in urban areas, as in the WUPeconomic. However, high values were also found in farmland ().
Figure 9. Spatial distribution of the WUPecological.
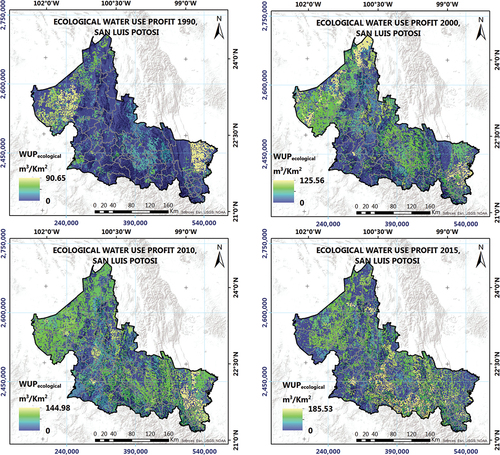
It is also observed that the WUP values increase over time, caused by population growth, increased water demand in the state, and the urban area’s growth, such as the demand for water use for multiple services.
The areas where the highest WUPecological values were obtained coincide with those where the NDWI has the highest values. Similar results were obtained by Huang, Jiang, Zhuang, Zhu, and Fu (Citation2014), who obtained the highest WUPecological values in areas close to bodies of water or wet areas. However, in our work, high values of WUPecological were also obtained in dry areas.
WUPecological showed the relationship between the volume of water used in the state and the water volume available in the future. It was observed that WUPecological value is higher in agricultural land uses, mainly from 1990 to 2010. The lowest WUPecological values were identified in regions with scrublands, grasslands, and bare soils. In 2015, variability can be observed in the results, finding high values of WUP in urban areas, forests, and bare soils. The results indicate that the water volume used for agriculture and tertiary and secondary activities is greater than the available water. It is vital to highlight that the multitemporal analysis allowed us to evaluate, with greater detail, the behavior and evolution of WUP throughout the period studied. Also, it helped to understand that water use is increasing according to population and urban growth; therefore, it is necessary to establish better water management policies.
Conclusions
The WUP’s spatial distribution was analyzed from multitemporal indicators. For that, meteorological, economic, and ecological data were reviewed, as well as satellite images, applying geostatistical and remote sensing methods. In this study, the estimated WUP was made on a regional scale, analyzing 25 years. From this, variables such as ETR (estimated from climatological data using the Turc method), soil use in the state (determined from a supervised classification using remote sensing), and GDP distribution (obtained through the spatial simulation of economic data) were analyzed. Finally, a model that describes the ESV distribution derived from the extracted data on national water volumes was generated.
For this work, the relationship between ETR and WUP is of utmost importance since it is understood that ETR indicates the consumption of water in a region. Therefore, the spatial distribution of the economic and ecological WUP determines the uses generated by water consumption in the state. The models created by this method show an approximate behavior of the phenomenon of the San Luis Potosi state.
With this study, economic and ecological indicators of the WUP were generated, allowing decisions to create policies or plans for the sustainable management of water resources. In addition, it contributes to a better understanding of water use in San Luis Potosí and its relationship with the economic sectors that use this resource.
The methodology used can vary in different multicriteria strategies incorporated due to improved satellite images and adaptations of geostatistical processes. Other variables could be considered in addition to this procedure, which was incorporated into the methodology. However, the work objective was to establish a multitemporal method to estimate the spatial distribution of water.
Disclosure statement
No potential conflict of interest was reported by the author(s).
Correction Statement
This article has been corrected with minor changes. These changes do not impact the academic content of the article.
References
- Almonte, L. J., Rosales, R. A., & Carbajal-Suárez, Y. (2020). Spatial analysis of manufacturing employment in Mexico, 1984-2013. Desarrollo Y Sociedad, 84(84), 91–129. doi:10.13043/DYS.84.3
- Campos-Aranda, D. F. (2018). Análisis estadístico de la ocurrencia de sequías meteorológicas anuales según el tipo de clima del estado de San Luis Potosí, México. Tecnol Y Cienc Del Agua, 9(3), 213–231. doi:10.24850/j-tyca-2018-03-10
- Castillo, R., Flores, C., & Rodríguez, M. (2014). The relative importance of the service sector in the Mexican economy: A time series analysis. Lecturas de Economía, 80(80), 133–151. doi:10.17533/udea.le.n80a5
- Cervera, L. E., & Rubio, R. (2003). Basic criteria for a sustainable water management at the U.S.-Mexico border: The case of ambos Nogales. Estud Front, 4(7), 35–60. doi:10.21670/ref.2003.07.a02
- Cosgrove, W. J., & Loucks, D. P. (2015). Water management: Current and future challenges and research directions. Water Resources Research, 51(6), 4823–4839. doi:10.1002/2014WR016869
- Fagbohunka, A. (2015). The influence of industrial clustering on climate change: An overview. Environmental Economics and Policy Studies, 15(4), 433–443.
- Flores-Jiménez, D. E., Algara-Siller, M., Aguilar-Rivera, N., Carbajal, N., Aldama-Aguilera, C., Ávila-Galarza, A., & Álvarez-Fuentes, G. (2016). Influence of sugarcane burning on soil carbon and nitrogen release under drought and evapotranspiration conditions in a Mexican sugarcane supply zone. Revista Internacional de Contaminación Ambiental, 32(2), 177–189. doi:10.20937/RICA.2016.32.02.04
- Gao, B. (1996). NDWI—A normalized difference water index for remote sensing of vegetation liquid water from space. Remote Sensing of Environment, 58(3), 257–266. doi:10.1016/S0034-4257(96)00067-3
- Hajkowicz, S., & Higgins, A. (2008). A comparison of multiple criteria analysis techniques for water resource management. European Journal of Operational Research, 184(1), 255–265. doi:10.1016/j.ejor.2006.10.045
- Hasan, S., Shi, W., Zhu, X., & Ustaoglu, E. (2020). Impact of land use land cover changes on ecosystem service value – a case study of Guangdong, Hong Kong, and Macao in South China. PLoS ONE, 15(4), 1–20. doi:10.1371/journal.pone.0231259
- Hoekstra, A. Y., Buurman, J., & van Ginkel, K. C. H. (2018). Urban water security: A review. Environmental Research Letters, 13(5), 14. doi:10.1088/1748-9326/aaba52
- Horne, A. C., O’Donnell, E. L., Loch, A. J., Adamson, D. C., Hart, B., & Freebairn, I. J. (2018). Environmental water efficiency: Maximizing benefits and minimizing costs of environmental water use and management. WIREs Water, 5(4), 10. doi:10.1002/wat2.1285
- Huang, Y., Jiang, D., Zhuang, D., Zhu, Y., & Fu, J. (2014). An improved approach for modeling spatial distribution of water use profit—a case study in Tuhai Majia Basin, China. Ecological Indicators, 36, 94–99. doi:10.1016/j.ecolind.2013.07.017
- Huang, C. L., Vause, J., Ma, H. W., & Yu, C. P. (2013). Urban water metabolism efficiency assessment: Integrated analysis of available and virtual water. The Science of the Total Environment, 452-453, 19–27. doi:10.1016/j.scitotenv.2013.02.044
- Kazama, S., & Oki, T. (2006). The effects of climate change on water resources. Global Environmental Research, 10(2), 201–206.
- Linna, P., Pekkola, S., Ukko, J., & Melkas, H. (2010). Defining and measuring productivity in the public sector: Managerial perceptions. International Journal of Public Sector Management, 23(3), 300–320. doi:10.1108/09513551011032491
- Luo, D. (2003). Application of the fuzzy mathematics on the assessment of water resources value. Groundwater, 25(3), 181–182.
- Lu, X., & Zhuang, Q. (2010). Evaluating evapotranspiration and water-use efficiency of terrestrial ecosystems in the conterminous United States using MODIS and AmeriFlux data. Remote Sensing of Environment, 114(9), 1924–1939. doi:10.1016/j.rse.2010.04.001
- Martínez, M. J. (2018). La Economía de San Luis Potosí en las dos últimas décadas. Algunas referencias empíricas sobre el período 1990-2010. Revista de El Colegio de San Luis, VIII(16), 311–336. doi:10.21696/rcsl9162018779
- Martínez-Retureta, R., Aguayo, M., Stehr, A., Sauvage, S., Echeverría, C., & Sánchez-Pérez, J. M. (2020). Effect of land use/cover change on the hydrological response of a Southern center basin of Chile. Water, 12(1), 21. doi:10.3390/w12010302
- Meyer, M. A., & Priess, J. A. (2014). Indicators of bioenergy-related certification schemes - an analysis of the quality and comprehensiveness for assessing local/regional environmental impacts. Biomass & Bioenergy, 65, 151–169. doi:10.1016/j.biombioe.2014.03.041
- Miljković, Ð., Božić, S., Miljković, L., Marković, S. B., Lukić, T. … Ristanović, B. (2018). Geosite assessment using three different methods; a comparative study of the krupaja and the Žagubica springs – hydrological heritage of Serbia. Open Geosciences, 10(1), 192–208. doi:10.1515/geo-2018-0015
- Moreno-Pizani, M. A. (2021). Water management in agricultural production, the economy, and Venezuelan society. Frontiers in Sustainable Food Systems, 4, 14. doi:10.3389/fsufs.2020.624066
- Naudé, W. (2011). Climate change and industrial policy. Sustainability, 3(7), 1003–1021. doi:10.3390/su3071003
- Omarova, A., Tussupova, K., Hjorth, P., Kalishev, M., & Dosmagambetova, R. (2019). Water supply challenges in rural areas: A case study from Central Kazakhstan. International Journal of Environmental Research and Public Health, 16(5), 14. doi:10.3390/ijerph16050688
- Polasky, S., Kling, C. L., Levin, S. A., Carpenter, S. R., Daily, G. C. … Lubchenco, J. (2019). Role of economics in analyzing the environment and sustainable development. Proceedings of the National Academy of Sciences of the United States of America, 116(12), 5233–5238. doi:10.1073/pnas.1901616116
- Randall, A. (1981). Property entitlements and pricing policies for a maturing water economy. Australian Journal of Agricultural and Resource Economics, 25(3), 195–220. doi:10.1111/j.1467-8489.1981.tb00398.x
- Serrano, J., Shahidian, S., & Marques, J. (2019). Evaluation of normalized difference water index as a tool for monitoring pasture seasonal and inter-annual variability in a Mediterranean agro-silvo-pastoral system. Water, 11(1), 20. doi:10.3390/w11010062
- Sintayehu, D. W. (2018). Impact of climate change on biodiversity and associated key ecosystem services in Africa: A systematic review. Ecosystem Health and Sustainability, 4(9), 225–239. doi:10.1080/20964129.2018.1530054
- Smajgl, A., Larson, S., Hug, B., & De Freitas, D. M. (2010). Water use benefit index as a tool for community-based monitoring of water related trends in the great barrier reef region. Canadian Journal of Fisheries and Aquatic Sciences, 395(1–2), 1–9. doi:10.1016/j.jhydrol.2010.09.007
- Sudheer, V. S. S., Viswanadh, K., & Ramana, G. V. (2017). Comparative study on estimation of various evapotranspiration techniques with Penman-Monteith method. International Journal of Civil Engineering and Technology, 8(8), 677–685.
- Thirión, J. M. (2020). FDI, regional development and structural change. The case of three states in El Bajío, Mexico. Análisis económico, XXXV(90), 199–220. doi:10.24275/uam/azc/dcsh/ae/2020v35n90/Tririon
- Upadhyaya, A., & Alok, K. S. (2016). Concept of water, land and energy productivity in agriculture and pathways for improvement. Irrigation & Drainage Systems Engineering, 5(154), 10. doi:10.4172/2168-9768.1000154
- Yu, W., Wardrop, N. A., Bain, R. E. S., Alegana, V., Graham, L. J. … Scherer, L. (2019). Mapping access to domestic water supplies from incomplete data in developing countries: An illustrative assessment for Kenya. PLoS ONE, 14(5), 19. doi:10.1371/journal.pone.0216923