
 ?Mathematical formulae have been encoded as MathML and are displayed in this HTML version using MathJax in order to improve their display. Uncheck the box to turn MathJax off. This feature requires Javascript. Click on a formula to zoom.
ABSTRACT
Used pesticides result in soil pollution, which potentially seep into groundwater, posing risks to human and animal health. The current study examines the use of a new cheap material for removing four commonly used pesticides from polluted groundwater before use for drinking. These pesticides are Malathion, Methomyl, Abamectin, and Thiamethoxam. Activated charcoal obtained from the trunk of “Salix mucronata” trees is introduced for removing these pesticides by surface adsorption. Activation treatment using gold-nitrate solution is introduced to enhance the charcoal adsorption capacity, because removal of pesticides is difficult due to their large-sized molecules and lack of obvious surface electrostatic charges. Physical and chemical properties of the studied pesticides and the activated charcoal were determined. Batch experiments tested the effects of solution pH, contact time, dose of charcoal, and initial concentrations on the charcoal adsorption capacity. Langmuir adsorption linear isotherm test was done to use for the prediction of adsorption behavior. Fixed-bed column experiments tested clean-up of polluted water using charcoal filter under steady flow. Gold-nitrate activated charcoal adsorption capacities were almost three times higher than other charcoals for the same pesticides at the same initial concentrations. Maximum adsorption capacities achieved in the current study were 16.17, 14.59, 9.55, and 8.99 mg/g, respectively, at the initial concentrations of 50.0 mg/l. Meanwhile, treatment times in steady-flow fixed-bed columns were much lower compared to other studies. Preparation cost of gold-nitrate activated charcoal in the current study was lower than other adsorbents. The charcoal introduced in this study is recommended for use in low-cost removal of pesticides from polluted groundwater on the national scale, including small treatment units for rural communities with limited facilities.
Introduction
Pesticides are used to protect agricultural crops and fruits from massive damage and yield losses. These agrochemicals can cause serious threats to human and animal health (Rosenfeld & Feng, Citation2011). Pesticides often fall on the ground and generally bind strongly to soil particles and may remain in the soil surface for a few months to many years (Rajan, Parween, & Raju, Citation2023). Significant parts of these pesticides leak with percolating water to drainage and groundwater aquifers and can cause great danger to human and animal health (Crowe, Almuhtaram, Andrews, & McKie, Citation2022; Rosenfeld & Feng, Citation2011; Suo et al., Citation2019; Yuan, Mortazavian, Passeport, & Hofmann, Citation2022). During pesticide preparation in tanks before spraying by mixing it with water near unprotected wellheads, spills find shortcuts through wells to the deep groundwater aquifer. Furthermore, in desert farms, especially if there are no thick clay layers in the soil profile, percolation water moves faster to the surface and deep groundwater aquifers and pollutes them.
Four of the commonly used pesticides in Egypt are selected for this study. These pesticides are (I) Malathion, (II) Methomyl, (III) Abamectin, and (IV) Thiamethoxam (Hathout et al., Citation2022; Khattab, Abdelghany, Abdelmegeed, & Attalah, Citation2020). These pesticides belong to the chemical families of Organophosphate, Carbamates, Avermectin B1, and Neonicotinoid, respectively. Wide use of these pesticides in Egypt was reported for Malathon (Mansour, Citation2009), Methomyl (Sallam, Aboelkassem, Fouad, & El-Mageed, Citation2018), Abamectin (Kenawy & Sharaf, Citation2008), and Thiamethoxam (El-Gendy et al., Citation2019).
Several methods are used to remove harmful pesticide residues from polluted waters. These methods include advanced oxidation, coagulation, filtration, biodegradation, ozonization, ion exchange, and reverse osmosis (Cosgrove, Jefferson, & Jarvis, Citation2019; Ormad, Miguel, Claver, Matesanz, & Ovelleiro, Citation2008). In addition, highly adsorptive macro-porous membranes using metal organic frameworks (MOFs) were used with copper-benzene-tri-carboxylate (CU-BTC) to remove pesticides by adsorption (Abdelhameed, Abdel-Gawad, & Emam, Citation2021). Emam, Ahmed, and Abdelhameed (Citation2021) used homo-metallic and hetero-metallic biocomposites (silver-, gold-, and Palladium-) together with chitin (an abundant biopolymer) to catalyze hydrolysis (chemical break-down in water) of the organic thiophosphate pesticide of prothiofos. Abdelhameed and Emam (Citation2022) used hybrid materials containing functionalized cotton and MOF to remove dyes and pesticides from polluted water. Their hybrid materials resulted in enhanced adsorption capacities by factor of 2.3–2.5 for dyes and 3.1–3.3 for pesticides and could be reused for five regeneration cycles.
Adsorption on the surfaces of activated charcoal/carbon from waste materials is one of the most popular, effective, and economic methods because of its large surface area and high adsorption capacity (El-Baz, Hendy, Dohdoh, & Srour, Citation2020). The activated carbon-based adsorption technique is of great potential in treating contaminated water due to the simple design, high efficiency, wide pH range, quickness, low cost, and environmental friendliness (Chakraborty, Pal, & Saha, Citation2022). Removal of organic pollutants, including pesticides, is greatly difficult due to the large size of their molecules and the lack of obvious electrostatic charges on them (Saleh, Zouari, & Al-Ghouti, Citation2020).
A new material of gold-nitrate activated charcoal/carbon, which is obtained from the trunk of “Salix mucronata” trees (known in Egypt as “As-Sefsaaf Al-Baladi,” also called “Cape silver willow” or “Safsaf willow”), is introduced in the current study. The objective of the current study is to examine the potential effect of this new material in the removal of the four common pesticides from polluted groundwater below the permissible limits before being used by humans and animals.
Materials and methods
Experiments of the current study were done at Technical Colleges’ Laboratories, and Chemical Engineering Department Laboratories, Onizah Colleges, Al-Qassim, Kingdom of Saudi Arabia.
Preparation of gold-nitrate activated charcoal/carbon
Preparation and activation of gold-nitrate charcoal/carbon in granular form followed the procedures described by Deng, Zhang, Xu, Tao, and Dai (Citation2010). Preparation of gold-nitrate treatment solution was done according to Shariq et al. (Citation2018).
Characterization studies
Properties of both the adsorbates (the four pesticides of concern) that are related to adsorption removal process and the adsorbent (gold-nitrate activated charcoal/carbon) were examined. The four pesticides that are commonly used in Egypt and studied in the current study are (I) Malathion, (II) Methomyl, (III) Abamectin, and (IV) Thiamethoxam. Samples from all pesticides (purity 95% w/w) were obtained from Kobian Company, an agent of Sigma Aldrich. Stock solutions for each pesticide (200.0 mg/l) were prepared in bi-distilled water (for water ultra-purity), and standard solutions of 10, 20, 30, and 40 mg/l concentrations were prepared from each of the stock solutions. Working samples were made by adding the required stock solution volumes to the predetermined quantity of bi-distilled water.
Properties of adsorbates (four pesticides)
The physical and chemical properties of the four pesticides that are commonly used in Egypt and studied in the current study, (I) Malathion, (II) Methomyl, (III) Abamectin, and (IV) Thiamethoxam, as obtained from Kobian Company (Kobian Scientific Limited, Kenya), are tabulated in .
Table 1. Physical and chemical properties of the four pesticides, as obtained from Kobian Company (Kobian Scientific Limited, Kenya).
Determination of adsorbent (gold-nitrate activated charcoal) properties
Physical and chemical properties of the studied pesticides were determined following the methodology described by Kishibayev et al. (Citation2021). Activated charcoal surface porosity and surface area were also examined using “Baruett–Joyner–Halenda” (BJH) test (Horvat, Pantić, Knez, & Novak, Citation2022). Distribution of various micropore sizes was examined using “Scanning Electron Micrograph” (SEM) test (Paredes, Citation2014). Surface functional groups were examined using “Fourier Transform Infra-Red” (FTIR) test (Gonzalez, Roman, González-García, Nabais, & Ortiz, Citation2009). Thermal stability of surface functional group was examined using “Thermo-Gravimetric Analysis” (TGA) test (Gottipati, Citation2012).
Physico-chemical properties and elemental analysis
Moisture content (%) by mass, ash content (%) by mass, bulk density, specific gravity, porosity, pH, conductivity, and matter soluble in water were analyzed as per the standard procedures (O’Neil, Citation2013) for Salix mucronata (“As-Sefsaaf Al-Baladi”) gold-nitrate activated charcoal/carbon.
Surface-pore properties (BJH) test
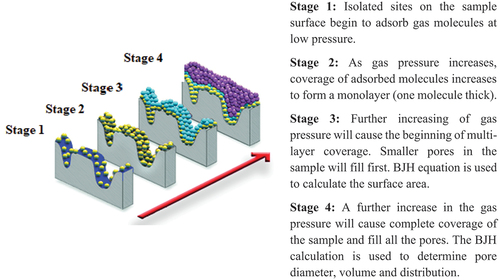
The pore volume of the activated charcoal/carbon was determined using BJH device (Baruett–Joyner–Halenda; German model; Horvat, Pantić, Knez, & Novak, Citation2022). The basic operational theory for this device is illustrated in . In brief, gas adsorption on the studied activated carbon is observed on four stages of increasing gas pressure, and BJH calculation is done using the device to determine and report the activated charcoal surface pore diameters, volumes, and sizes’ distribution.
Figure 1. Gas adsorption theory of Baruett–Joyner–Halenda (BJH) analysis for surface pore properties’ test. Quoted from “Micromeritics Instrument Corporation” (www.micromeritics.com/Repository/Files/Gas_Adsorption_Theory_poster.pdf) .
SEM test
Cambridge S-360 scanning electron microscope, operated at 16 kV and 2.5 Aº (0.00025 micrometers; up to 50,000× magnification power), was used to examine the surface morphology of the activated charcoal, as described by Paredes (Citation2014). It is conducted to obtain information about the surface’s topography and microporosity. It took four images of the activated charcoal surface; first at 500× magnification to view the spreading of roughness on the surface, and then the details of the surface roughness microporosity distribution of various sizes by further zooming-in magnification at stages (10,000×, 20,000×, and 30,000×).
FTIR test
This test was conducted to determine the surface functional groups on the surface of the activated charcoal/carbon (Gonzalez, Roman, González-García, Nabais, & Ortiz, Citation2009). Transmittance (%) of infrared in the spectrometer output results shows absorption peaks at certain wavelengths, which correspond to the existence of certain functional groups on the activated charcoal surface (Peak, Citation2005).
TGA test
This test was conducted using the thermal analyzer of the Shimadzu type, DTG-60 H. TGA is an analytical technique used to determine the thermal stability of the material’s components against volatilization. It is done by heating the material sample from 20°C up to 700°C at the steady rate of 20°C/min and monitoring weight changes/losses of volatile components as the sample is heated (Gottipati, Citation2012).
Determination of activated charcoal/carbon adsorption capacity
Adsorption capacity of the activated charcoal/carbon (qe; mg pollutant/g charcoal, or mg/g) is affected by (1) the solution pH, (2) contact time between the charcoal and the polluted solution, (3) the charcoal (adsorbent) dose (or weight/solution volume; g/l), and (4) the initial concentration of the adsorbate (pesticide) in the polluted solution (Trivedi & Mandavgane, Citation2018). Therefore, batch experiments were used to determine the appropriate values of these variables that achieve highest adsorption capacity (qe; mg/g).
The adsorption capacity (qe; mg/g), which is the amount of adsorbed pesticides per unit absorbent (activated charcoal/carbon) mass, is calculated as (Attia, Khedr, & Elkholy, Citation2010) (EquationEquations (1)(1)
(1) and Equation(2))
(2)
(2)
and
where C0 is the initial pesticide(s)’ concentration (mg/l), Ce is the pesticide concentration in solution at equilibrium (mg/l), m is the activated carbon mass/dose (g), and V is the solution volume (ml).
Reported value for soil pollution with (I) Malathion was 10.315 mg/kg (Hathout et al., Citation2022), and the reported values for (II) Methomyl were 0.395 mg/kg (Hathout et al., Citation2022) and 3.7 mg/kg (EL-Kabbany, EL-Marsafy, Mohamed, & Saadieh, Citation2013). Meanwhile, the reported value for soil pollution with (III) Ambectin was 0.04 mg/kg (EL-Kabbany, EL-Marsafy, Mohamed, & Saadieh, Citation2013). Pollution with (IV) Thiamethoxam in drainage water was reported as 3.5 mg/l (El-Kammah, Elkhatib, Gouveia, Cameselle, & Aboukila, Citation2022). This large variability in pollution concentrations is largely affected by the distances from source of pollution and by time elapsed since application of pesticides. The worst pollution events may occur at sites of preparation of pesticide application tanks by mixing with water near a drinking groundwater well, and in accidental spills.
For practical handling, initial concentrations in the experiments were prepared by dilution of samples from the stock solutions, and therefore the actual initial concentrations were measured before use. Initial concentrations were selected at values that are safely above the expected values in groundwater in order to ensure safe removal of harmful substances in practice. Initial concentrations (C0; mg/l) for the four pesticides were at 7.24, 5.012, 7.46, and 7.32 mg/l, respectively, except for the experiments that examined the effects of initial concentrations (test 4), which used different initial concentrations. The solution volumes were 500 ml, and the charcoal dose (weight) was 1.0 g, except for test (3), which used variable charcoal doses, from 0.15 to 2.52 g. The solutions’ temperature was at 25°C. Results of test (1) were used for setting the solutions’ pH of the following tests (2, 3, and 4) at 7.5. In all the tests, the solutions were shaken for 4.0 h, and five samples, 1.0 mm3 each, were taken (as replicates) every 10 min. Replicate samples were analyzed to get the residual pesticides’ concentrations in the treated solutions (Ce; mg/l). Mean value of the five replicates was taken, and the standard deviations (SDs) were calculated. The adsorption capacity (qe; mg/g) and adsorption removal efficiency (U %) were calculated using EquationEquations (1)(1)
(1) and (Equation2
(2)
(2) ).
The initial pH range in test (1) was adjusted in the range between 2 and 11, using either 0.1 N NaOH or 0.1 N HCl solutions. Adsorption is strongly affected by the concentration gradient between the pesticide concentration and the surface of the adsorbent (Shukla, Bernard, Harney, Frank, & Reed, Citation2003). Thus, the initial concentrations of pesticides in test (3) were varied from 0.2 to 50.0 mg/l. The very low and very high concentrations were intended to ensure the charcoal ability to successfully remove pollutants at all these values. Results of this test are also useful for cases of very high concentrations that may occur in accidental spills. Adsorption capacity at such high concentrations can be used for calculating the required dose of activated charcoal for clean-up after accidental spills.
Experiments for Langmuir adsorption isotherm test
Batch experiments in a series of 1-l (1000 ml) flasks with 50.0 ml solution volume were used, with initial concentrations of pesticides ranging from <1.0 up to about 50.0 mg/l, and a dose of 1.0 g of activated charcoal/carbon. The flasks were shaken in a thermal vibrator at 1000 revolutions per min (rpm) until equilibrium was reached at different temperatures (25, 30, 40, and 50°C). Such high temperatures (30–50°C) may be reached in desert conditions (Mahamad, Zaini, & Zakaria, Citation2015).
Five replicates samples, 1 mm3 each, were taken from the flasks every 5 min for a duration of 240 min. Then, a gas chromatographic analysis was performed for these samples, and the mean values were used to obtain best-fit straight line adsorption “isotherms.” Gas chromatographic analysis can only measure the pesticide concentration remaining in the solution. Thus, adsorption isotherm calculations are performed to determine whether the difference between the input and the remaining concentrations follows Langmuir straight line adsorption model (Murphy, Vashishtha, Palanisamy, & Kumar, Citation2023). If a part of the input is neither in adsorption nor remaining in solution, it is assumed to be precipitated. However, shaking at 1000 rpm is intended to have no precipitation, and that the only two options for pesticides are either adsorption or remaining in solution.
The following linear Langmuir isotherm EquationEquations (5)5
5 and (Equation4
(4)
(4) ) are used (Attia, Khedr, & Elkholy, Citation2010):
where
Ce = equilibrium concentration (mg/l)
qe = amount adsorbed at equilibrium (mg/g); calculated using EquationEquation (1)(1)
(1)
KL = Langmuir equilibrium constant for adsorption (l/mg)
Qm = maximum adsorption capacity (mg/g)
and
where
RL = Langmuir dimensionless separation factor of equilibrium (RL)
C0 and Ce are measured initial and treated concentrations (mg/l), qe (mg/g) is calculated using EquationEquation (5)5
5 , and KL is obtained from EquationEquation (5)
5
5 to calculate RL using EquationEquation (4)
(4)
(4) .
For successful adsorption, Langmuir separation factor for equilibrium should be between 0 and 1 (0.0 < RL < 1.0) (Attia, Khedr, & Elkholy, Citation2010). If (RL = 0.0), it corresponds to irreversible adsorption, while (RL = 1.0) corresponds to linear adsorption. Otherwise, it is considered unfavorable conditions for adsorption if (RL >1) (CitationAttia, Khedr, & Elkholy, Citation2010).
Desorption tests
Desorption tests were conducted to examine whether the pollutants will remain adsorbed or will return to solution if non-polluted water is passed through a loaded filter. Batch experiments were done for these tests using charcoal/carbon that was loaded in adsorption batch experiments. Desorption tests were done using beakers containing 500 ml of distilled water, along with 1.0 g of loaded activated carbon. The initial concentrations of the experiments were those of the “loading” adsorption, which ranged at around 3.0 mg/l. The beakers were shaken for the duration of 4 h, and five replicate samples, each of 1 mm3, were taken from solution every 10 min and were analyzed for the residual pesticides’ concentrations (Cdes). The mean values of the analyzed concentrations were taken, and SDs were calculated. Desorption (%) is calculated by EquationEquation (5)5
5 (Qi et al., Citation2023):
where C0: initial “loading” concentration (mg/l), and Cdes: residual concentration (mg/l).
Fixed-bed column experiments
The practical use of activated charcoal filter will be by passing steady flow of polluted water through it. Batch experiments were used for determining the best parameter values for highest adsorption capacity. Then, fixed-bed column experiments were used to examine the activated charcoal filter clean-up performance under steady flow of polluted water. Pesticides’ concentrations must be lowered below the permissible limits before use, which are 0.29, 0.30, 0.08, and 0.20 mg/l, respectively, as shown in .
Table 2. The permissible residual concentrations (PRC) for pesticides of concern in drinking water.
shows the schematic design of the fixed-bed column, which is characterized by a fixed base. Waste water is supplied from the tank at the top of the pipe by gravity at steady flow rate, and outflow is collected in the product receiver at the bottom. Five replicates of 1 mm3 samples were taken from outflow water every 30 min for analysis and determination of pesticide residual concentrations, after passing through the activated charcoal/carbon filter. Each of these experiments was run for 5.0 h. The first set of experiments used fixed-bed column design dimensions for the four pesticides (Malathion, Methomyl, Abamectin, and Thiamethoxam). Initial concentrations (C0) of pesticides in this set were at 3.5, 7.0, 15, and 35.0 mg/l. The second set of experiments conducted 21 experiments only for pesticide (I) Malathion at initial concentration C0 of 7.86 mg/l, and using different fixed-bed column design dimensions for each group of tests (column diameter, height of solution in column, dose of activated charcoal, and feeding inflow rate). Each value of the design dimensions and inflow rates was varied while all other parameters were fixed, in order to determine its effect on treatment outflow concentration. lists the fixed-bed column design dimensions and inflow rates for treatment under steady flow in these two sets of experiments.
Figure 2. Experimental setup for a fixed-bed column for the removal of pesticides from polluted water under steady flow.
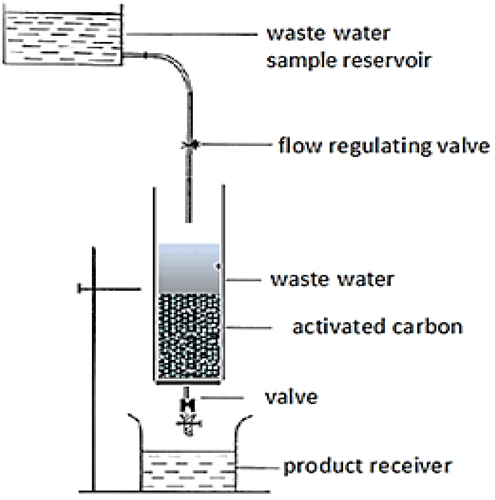
Table 3. Fixed-bed column design dimensions and flow rates for removal of pesticide from polluted solution under steady flow.
Results and discussions
Gold ions bond strongly with the negatively charged parts of the organic compounds on charcoal surfaces and break them off. Leaching during activation process removes these surface parts with the bonded gold, leaving behind abundant, positively charged micropores and cavities on the activated charcoal surfaces. This greatly enhances the activated charcoal adsorption capacity for attracting negatively charged pesticides and removing them from polluted water.
Properties of adsorbent (gold-nitrate activated charcoal/carbon)
Physico-chemical properties and elemental analysis
The usefulness of activated charcoal/carbon for adsorption depends upon its specific surface area, in addition to chemical stability of its surface compounds. The chemical nature and structure of surface pores usually determine the adsorption activity. The physical properties and chemical components, in addition to elemental and molecular analyses of gold-nitrate activated charcoal/carbon, are listed in . Experiments were done in five replicates, and the mean values ± SDs are displayed. SDs were very small, which reflect uniformity in the specimens’ properties.
Table 4. Physico-chemical properties, elemental analysis, and contents’ analysis of activated carbon (mean ± standard deviation (SD); no. of sample replicates, n = 5).
Value of activated charcoal/carbon pH at 6.02 is within the acidic range as reported by Kwon, Jang, Lee, Park, and Kim (Citation2013) for most activated charcoals/carbons, and it goes higher by heating and turns basic above 400°C to 500°C. The activated charcoal/carbon contains more than 40% by weight of lingo-cellulosic compounds (cellulose and hemo-cellulose), which during the activation process turn into active carbon and oxygen on the surface (Xiao et al., Citation2020). Total amount of pectin, lignin, cellulose, and hemo-cellulose comprise a total of about 71.79% by weight. Very small remainders of surface minerals (calcium, sodium, potassium, and magnesium; about 2.03% by weight) indicate that they were removed in the activation process, which lead to the formation of hollow pores of regular geometric dimensions on the surface. Other impurities are also removed during activation and participate in the formation of rough surfaces (Liu et al., Citation2021). The iodine number is one of the methods to determine the adsorption capacity of activated carbons, with the typical range of 500–1200 mg/g, which is equivalent to surface area of carbon between 900 and 1100 m2/g (Mopoung, Moonsri, Palas, & Khumpai, Citation2015). In the current study, iodine number of 917 mg/g and the surface area of 1028 m2/g are in the upper values of the reported ranges.
Surface pore properties (BJH) test
The efficiency of activated charcoal/carbon is strongly affected by the specific surface pore area and specific surface pore volume (Ahmed, Alsultan, Sabah, & Swiegers, Citation2023; Derbyshire, Jagtoyen, & Thwaites, Citation1995). lists the specific surface area and the pore volume of activated charcoal/carbon as affected by the concentration of gold-nitrate in the treatment solution. Results showed that gold-nitrate concentration of 0.1 N in the treatment solution yielded highest specific surface area of 3050.6 m2/g and second highest pore volume of 1.546 cm3/g. Thus, this concentration is used for all activation treatments for the experiments. Experiments were done in five replicates and the means ± SDs are displayed in . SDs were very small, which indicate very small variability in the specimens’ properties.
Table 5. Surface pore area of gold-nitrate activated charcoal/carbon and surface pore volume (mean ± standard deviation (SD); no. of sample replicates, n = 5) of gold-nitrate activated charcoal/carbon, as affected by the treatment activation solution concentration. Concentration in units of normality. 1.0 N gold-nitrate = 259 mg/l, 0.1 N gold-nitrate = 25.9 mg/l.
Specific surface pore area of 3050.6 m2/g in the current study is comparable to the value reported by Dwiyaniti et al. (Citation2020) of 3554 m2/g that was obtained at 800°C, which they evaluated as “extremely high.”
SEM test
shows the SEM images of the activated charcoal surface for stepwise magnification at (d) 5000×, (c) 10,000×, (b) 20,000×, and (a) 30,000×. Image (d), which is at 5000× magnification, shows that the outer surface of the activated charcoal is full of regular and irregular cavities that were caused by the grinding process. Image (c) magnification is double that of image (d), while image (b) is also double the magnification of image (c). Meanwhile, image (a) is 50% more magnification than image (b).
Figure 3. Scanning electron micrograph (SEM) images of the activated charcoal surface for stepwise magnification at (d) 5000×, (c) 10,000×, (b) 20,000×, and (a) 30,000×. Distribution of micropores of all sizes on activated charcoal/carbon surface at all magnifications is one of the most important features that affects its adsorption capacity.
This stepwise zooming-in showed the consistent existence of levels of finer and deeper pores and irregularities on all scales, which were generated by the removal of surface minerals and organic compounds during activation processes. In addition, a clearly consistent pore system appears in the four images. These images also show the existence of many well-developed pores, which are attributed to the high content of lingo-cellulosic structures (Jjagwe, Olupot, Menya, & Kalibbala, Citation2021). Zooming-in also showed the presence of deeper pores inside the vesicles and voids within the activated charcoal surface pores’ network. All these surface pores participate in resultant higher adsorption capacity of the activated charcoal. Distribution of micropores of all sizes on activated charcoal/carbon surface is one of the most important features that affects its adsorption capacity (Ilomuanya, Nashiru, Ifudu, & Igwilo, Citation2017).
Distribution of micropores of all sizes on activated charcoal/carbon surface at all magnifications is one of the most important features that affects its adsorption capacity.
FTIR test
This test was conducted for the determination of functional groups that exist on the surface of activated carbon (. In addition to surface pores, the adsorption capacity of activated carbon also depends upon the functional groups on the surface (Gonzalez, Roman, González-García, Nabais, & Ortiz, Citation2009). The presence of various functional groups on the carbon surface also contributes to preferential uptake for different molecule species by adsorption on the activated charcoal/carbon surface (Omri & Batis, Citation2013).
Table 6. Functional groups on gold-nitrate activated charcoal/carbon that correspond to absorption peaks at recorded wavelengths from FTIR spectral test. These surface functional groups are capable of removing pollutants like pesticides by adsorption on charcoal/carbon surfaces.
In the FTIR spectra shown in , there are absorption peaks at wavelengths of 3834, 3122, 1983, 1762, and 1304 cm−1. The spectral peak (i) at wavelength 3834 cm−1 corresponds to N–H symmetric aliphatic amino group (Gonzalez, Roman, González-García, Nabais, & Ortiz, Citation2009). The peak (ii) at 3122 cm−1 corresponds to the O–H hydroxyl group (Tyagi et al., Citation2021). The peak (iii) at wavelength 1983 cm−1 is the evidence of the existence of O–H (COOH) carboxylic acid groups (Munajad, Subroto, & Suwarno, Citation2018). The peak (iv) at 1762 cm−1 corresponds to carbonyl C=O group (Petrov et al., Citation2000). Finally, the peak (v) at wavelength of 1304 cm−1 corresponds to N-protein peptide amide group of the lignin groups (Gandolfi, Ottolina, Riva, Fantoni, & Patel, Citation2013). These surface functional groups are capable of removing pollutants like pesticides by adsorption on charcoal/carbon surfaces (Saxena, Saxena, & Lochab, Citation2020).
Figure 4. “Fourier transform infrared spectra” (FTIR) spectral transmittance results for gold-nitrate activated carbon. Spectral peaks of transmittance (%) indicate the detection of surface functional groups that correspond to the recorded wavelengths: (i) N–H Amino-group at 3834 cm−1, (ii) OH Hydroxyl group at 3122 cm−1, (iii) O–H (COOH) carboxylic acid group at 1983 cm−1, (iv) carbonyl C=O group at 1762 cm−1, and (v) N-protein peptide amide group at 1304 cm−1.
TGA test
shows the experimental results for the thermal stability/dissociation of the charcoal components, which reflects their stability against volatilization. The initial temperature was at 20°C, and it was raised up to 700°C at a rate of 20°C/min. There was a large loss in moisture and hemo-cellulose at 100°C, and they were totally lost at 200°C. Meanwhile, cellulose and lignin sustained heating to 200°C with little weight loss, and that loss rate increased from 200°C to 500°C, which became less from 500°C to 700°C. However, pectin was more persistent and suffered smaller losses during the test range.
Figure 5. Thermo-gravimetric analysis (TGA) results for components’ thermal stability in gold-nitrate activated charcoal/carbon. Cellulose is responsible for high surface area and porosity, while lignin is the main source of negative charges, while pectin is a good adsorbent, which were relatively stable during this test. They are expected to positively affect the adsorption capacity of the gold-nitrate activated charcoal/carbon.
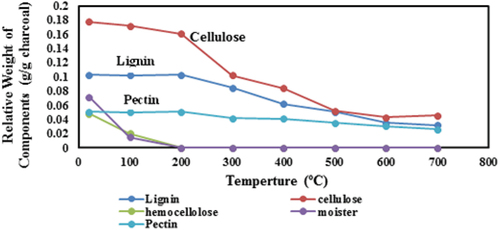
Cellulose is responsible for high surface area and porosity, while lignin is the main source of negative charges (Gottipati, Citation2012), while pectin is a good adsorbent (Nerdy et al., Citation2023), which were relatively stable during this test. This is expected to positively affect the adsorption capacity of the gold-nitrate activated charcoal/carbon.
Adsorption capacity studies
Effect of solution pH
Initial concentrations (C0; mg/l) for the four pesticides in this experiment were at 7.24, 5.012, 7.46, and 7.32 mg/l, respectively. Charcoal dose was 1.0 g in 500 ml solution (2.0 g/l). The mean values for the measured treated concentrations (Ce, mg/l) in the batch experiments were taken out of five measured values, and the SD values were calculated. The highest calculated SDs for mean values of the measured treated concentrations (Ce; mg/l) were within 0.006 mg/l for the four pesticides. shows plots of calculated adsorption capacities (qe; mg/g) versus solution pH values.
Figure 6. Effect of pH variation on adsorption capacities (qe; mg/g) for the four pesticides. The highest values achieved for adsorption capacities (qe) were 3.62, 2.51, 3.73, and 3.66 mg/g, for initial concentrations of at 7.24, 5.012, 7.46, and 7.32 mg/l, at pH of 7.5, charcoal dose of 1.0 g/500 ml, for the four pesticides of (I) Malathon, (II) Methomyl, (II) Abamectin, and (IV) Thiamethoxam, respectively.
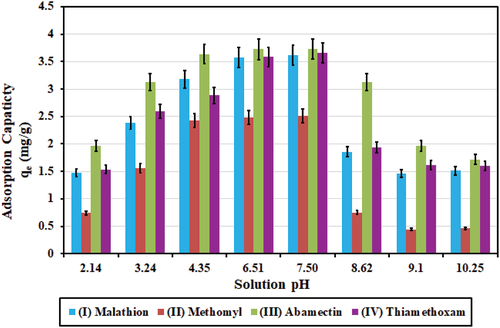
Results in show that pH value of 7.5 resulted in highest adsorption capacities (qe; mg/g), which is close to the reported value of 7.0 by Kodali, Talasila, Arunraj, and Nagarathnam (Citation2021) who used charcoal from coconut for the removal of organophosphorus pesticide (chemical family of (I) Malathon).
The highest values achieved for adsorption capacities (qe) were 3.62, 2.51, 3.73, and 3.66 mg/g, and the highest values achieved for adsorption removal efficiencies (U %) were 99.96, 99.98, 99.95, and 99.92, for initial concentrations of 7.24, 5.012, 7.46, and 7.32 mg/l, for the four pesticides of (I) Malathon, (II) Methomyl, (II) Abamectin, and (IV) Thiamethoxam, respectively.
Effect of contact time
Initial concentrations (C0; mg/l) for the four pesticides in this experiment were at 7.24, 5.012, 7.46, and 7.32 mg/l, respectively. Charcoal dose was 1.0 g in 500 ml solution (2.0 g/l). Maximum SD values for mean treated concentrations were 0.003, 0.002, 0.003, and 0.001 mg/l, respectively.
Results in show that 60 min (1 h) of contact time was sufficient for pesticides (I) Malathion and (II) Methomyl to reach equilibrium between the polluted solution and the activated charcoal and for reaching the highest value for adsorption capacity (qe). Meanwhile, the required contact time was 120 min (2 h) for (III) Abamectin and 90 min for (IV) Thiamethoxam. Thus, it is recommended to consider 120 min (2.0 h) as the required contact time for the batch experiments. The highest values achieved for adsorption capacity (qe) were 3.62, 2.51, 3.73, and 3.66 mg/g, and the highest values achieved for adsorption removal efficiency (U %) were 99.96, 99.98, 99.95, and 99.92, respectively.
Figure 7. Effect of contact time (minutes) on adsorption capacity (qe; mg/g) for the four pesticides. The highest values achieved for adsorption capacities (qe) were 3.62, 2.51, 3.73, and 3.66 mg/g, for initial concentrations of at 7.24, 5.012, 7.46, and 7.32 mg/l, at pH nearest to 7.5, charcoal dose of 1.0 g/500 ml, and contact time of about 120 min (2.0 h), for the four pesticides of (I) Malathon, (II) Methomyl, (II) Abamectin, and (IV) Thiamethoxam, respectively.
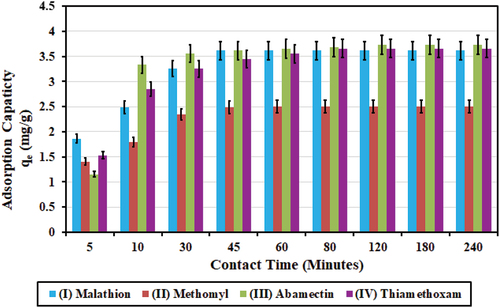
Jusoh et al. (Citation2023) reported a contact time of 150 min (2.5 h) for 88% removal efficiency of Malathion at initial concentration of 7.0 μg/l (0.007 mg/l), using 1.5 g charcoal in 250 ml solution (6.0 g/l). In comparison, the current study reported higher removal efficiency of 99.96% for Malathion at much higher initial concentration of 7.24 mg/l, using a much smaller charcoal dose of 1.0 g in 500 ml solution (2.0 g/l) at 1.0-h contact time.
Effect of adsorbent (activated charcoal) dose
Initial concentrations (C0; mg/l) for the four pesticides in this experiment were at 7.24, 5.012, 7.46, and 7.32 mg/l, respectively. The activated charcoal/carbon dose was varied from 0.15 to 2.52 g in 500 ml solution. Maximum SD values for mean treated concentrations were 0.006, 0.002, 0.003, and 0.002 mg/l, respectively.
Results in show that 1.00 g of activated charcoal for the solution volume of 500 ml (2.0 g/l) was sufficient to reach the highest value for adsorption capacity (qe) for the four pesticides. The highest values achieved for adsorption capacity (qe) were 3.62, 2.51, 3.73, and 3.66 mg/g, and the highest values achieved for adsorption removal efficiency (U %) were 99.95, 99.98, 99.97, and 99.91, respectively.
Figure 8. Effect of activated charcoal dose (g) on adsorption capacity (qe; mg/g) for the four pesticides.
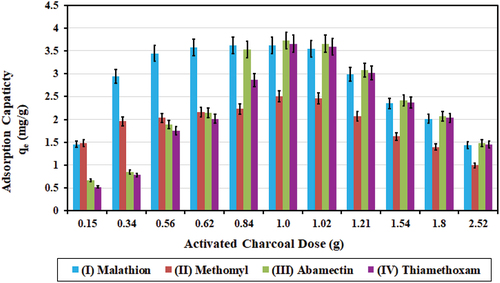
Jusoh et al. (Citation2023) used charcoal dose of 6.0 g/l, with the initial concentration of 7.0 μg/l (i.e. 0.007 mg/l), for the removal of Malathion at an efficiency of about 80%. In comparison, the current study used charcoal dose of 2.0 g/l (1 g/500 ml) with the initial concentration of Malathion at 7.24 mg/l for the removal efficiency at 99.95%, which used one-third of the charcoal dose and more than 10,000 times higher initial concentration, resulting in much higher removal efficiency.
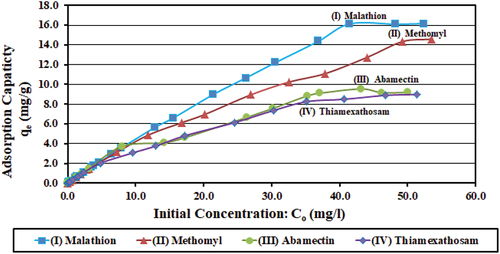
Effect of pesticides’ initial concentrations
Since adsorption is strongly affected by the concentration gradient between the pesticide concentration and the surface of the adsorbent (Shukla, Bernard, Harney, Frank, & Reed, Citation2003), this test was done to cover concentrations from 0.2 to 50.0 mg/l. This is intended to ensure successful removal over the entire range from very low to very high concentrations. It also provides data for use in cases of very high concentrations that may occur in accidental spills, especially in using the adsorption capacity for calculating the required dose of activated charcoal. Maximum SD values for mean treated concentrations were 0.02, 0.17, 0.14, and 0.14 mg/l, respectively.
Results in show that the highest values achieved for adsorption capacity (qe) were 16.17, 14.59, 9.55, and 8.99 mg/g, respectively, which occurred at the higher initial concentrations of 50.0 mg/l. However, the adsorption removal efficiency (U %) decreased with the increasing initial concentrations (from 0.2 to 50.0 mg/l) from 99.38 to 61.77%, from 99.84 to 57.82, from 99.29 to 36.75, and from 99.69 to 34.97%, for the four pesticides, respectively.
Figure 9. Effects of pesticides’ initial concentrations (mg/l) on adsorption capacity (qe; mg/g) for the four pesticides. Initial concentrations ranged from 0.2 to 50.0 mg/l, solution pH at 7.5, C0: initial concentration (mg/l), and qe: adsorption capacity (mg pesticide/g charcoal).
Activation treatment using gold-nitrate solution was introduced in the current study to enhance the activated charcoal/carbon adsorption capacity and to improve its ability to remove pesticides. Liu et al. (Citation2013) reported that gold–carbon bond in activated carbon–gold solution complex is one of the strongest gold–ligand bonds, which underlies the catalytic aptness of gold complexes for the formation of terminal alkynyl–gold intermediates and activation of the carbon–carbon triple bond. Positively charged gold metal ions bond strongly with the negatively charged parts of the charcoal surface functional groups, break them off, and remove them with leaching (in other words, “acidify” the surface; Khandaker, Kuba, Toyohara, Kamida, & Uchikawa, Citation2017). This generates surface pores and cavities with surface exposure of positively charged parts, which enhance the activated charcoal adsorption capacity (Liu et al., Citation2013). Adsorption occurs by bonds between the positively charged sites on the activated charcoal/carbon surfaces and the negatively charged pesticide molecules (Khandaker, Kuba, Toyohara, Kamida, & Uchikawa, Citation2017).
Maximum adsorption capacity achieved in the current study for (I) Malathion was 16.17 mg/g, as compared to 4.88 mg/g (Liu et al., Citation2013), and for (II) Methomyl, maximum adsorption capacity was 14.59 mg/g, as compared to 5.07 mg/g (Chang, Chang, Hsu, Lee, & Höll, Citation2008), who used the same initial concentrations at 50.0 mg/l. The values achieved in the current study are approximately three times as much higher than the reported values at the same initial concentrations. This reflects the powerful effect of enhancing the adsorption capacity by using gold-nitrate solution in charcoal/carbon activation.
Langmuir adsorption isotherm test results
In , RL values of EquationEquation (4)(4)
(4) in this test ranged between 0.040 and 0.079 (0.0 < RL < 1.0) for the four pesticides, which indicates successful application of linear Langmuir adsorption model (Attia, Khedr, & Elkholy, Citation2010). Other Langmuir parameters (Qm and KL) of EquationEquation (5)
5
5 are also listed in . In addition, also lists equations for the straight lines of best fit for Langmuir linear adsorption isotherms for the four pesticides, with the correlation coefficient R2, which are plotted in . Modeling of experimental data from adsorption processes is a very important tool for prediction of various adsorption systems (Ayawei, Ebelegi, & Wankasi, Citation2017).
Figure 10. Langmuir isotherm plot of (Ce/qe) obtained from Equation (3) vs. treated concentration (Ce), and Langmuir straight lines and equations of best fit for the four pesticides: y = ax + B; y = (Ce/qe; g/l), Ce = treated concentration (mg/l), qe = adsorption capacity (mg/g), x = treated concentration (Ce), a = straight line slope = y/x, and B = y-intercept, R2: correlation coefficient.
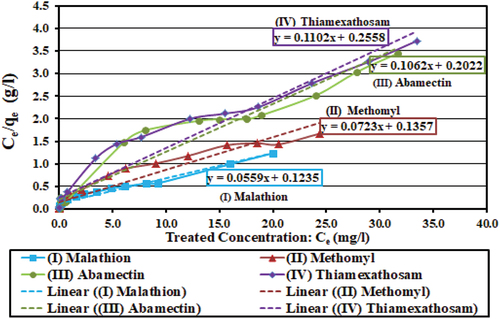
Table 7. Parameters’ average values for the best-fit straight-line using Langmuir model. Qm maximum adsorption capacity (mg/g) – EquationEquation (5)5
5 , KL: Langmuir equilibrium constant for adsorption (l/mg) – EquationEquation (5)
5
5 , RL: Langmuir dimensionless separation factor of equilibrium – EquationEquation (4)
(4)
(4) .
Desorption tests
lists that desorption (%) mean values were 0.23, 0.17, 0.09, and 0.19%, respectively, with very small SD values for measured desorption concentrations (Cdes). These very small desorption (%) values indicate the stability of adsorbed pesticides against desorption and against return to the solution in case of passing non-polluted water through a loaded filter. This is very important for safe use of these filters.
Table 8. Results of desorption test. Initial (loading) concentration (C0; mg/l), desorption concentration (Cdes, mg/l; no. of replicate samples, n = 5), and desorption (%) for the four pesticides.
Fixed-bed column experiments
Results in show that it took 1.0–3.0 h of continuous flow through the charcoal filter to clean the treated concentrations below the maximum permissible limit for initial concentrations in the first experiment sets (1)–(3) for the four pesticides (initial concentrations of 3.5, 7.0, and 15.0 mg/l). Meanwhile, treated concentrations in set (4) of the same experiment, which were at higher initial concentrations of 35.0 mg/l, were all above the maximum permissible limits after 5.0 h of steady flow through the charcoal filter. This indicates that in such cases that may occur from accidental spills, the activated charcoal dose must be carefully calculated and tested in order to safely remove the pollutants before water use.
Table 9. First experiment results initial (C0; mg/l) and treated concentrations (Ce; mg/l), under continuous steady flow for different durations (hours). Column diameter: 20 cm, solution height in column: 35 cm, dose of charcoal: 25 g, steady inflow rate: 30.5 cm3/min (yellow-shaded results are below maximum permissible residual concentration, i.e. successful treatment. Orange-shaded values are for extremely high values of pollutants’ initial concentrations, which may occur in cases of accidental spills).
Results of the second set of experiments in , which was done only for pesticide (I) Malathion. This set was intended for testing effects of changes in fixed-bed column design dimensions. Due to the complexities of full-scale designs, the need for employing different dimensions in column design is expected. Initial concentration of all experiments was set at C0 = 7.86 mg/l, which is the same as case (2) in . Results in list that 1.0 h of flow through the treatment filter could clean up the polluted solutions in all cases (down below 0.29 mg/l). This experiment provides information about performance under variation in column design parameters, and also draws attention to the need for measuring the treated concentration under these conditions.
Table 10. Results of the second set of experiments. Effects of variation of fixed-bed column design dimensions and inflow rate on treated concentrations (Ce; mg/l) under steady flow for the listed durations for (I) Malathion. Initial concentration (C0 = 7.86 mg/l). Permissible residual concentration (PRC) = 0.29 mg/l (Health Canada, Citation2023a) (yellow-shaded results are below maximum permissible level, i.e. successful treatment. Orange-shaded are the variable design parameter values of the fixed-bed column).
Kalsoom et al. (Citation2022) reported a treatment time of 800 min (13.33 h) for the removal of pesticides with initial concentration at 0.012 mg/l, using granular activated charcoal, and a steady flow rate of 1 cm3/min through fixed-bed column. Treatment time of 1.0 to 3.0 h, at a flow rate of 30.5 cm3/min and much higher initial concentrations reported in the current study, is quite reasonable as compared to 13.33 h.
In practical application of the current study results, a designed treatment unit with controlled steady-inflow rate unit that passes polluted water through the activated charcoal filter will be used. A storage tank for treated (cleaned) water, will receive the treated water for use. Data provided by the current study will be used is determining the appropriate dose (weight) of activated charcoal. Water of the targeted groundwater well must be regularly analyzed to determine the contained pollutants and their concentrations. Prior to that, further testing for the activated charcoal material to determine the time that it will take to reach saturation and needs regeneration (reactivation, or leaching pollutants for reuse). Field testing and evaluation of performance for the designed treatment unit should also be done.
Evaluation of preparation cost
lists the break-down costs for the preparation of 100 g and for 1 g of gold-nitrate activated charcoal used in the current study, which is US$ 0.032/g activated charcoal. compares the preparation costs of the current study to other adsorbents that vary from US$ 0.09/g (Laskar & Kumar, Citation2018) to US$ 0.7037/g (Praveen, Gokulan, Pushpa, & Jegan, Citation2021), and even as high as US$ 3.15/g (Mahmoud, Mostafa, & Nasr, Citation2019). It is important to note that the activation gold-nitrate solution can be collected and reprocessed to reuse the gold, which can lower the preparation costs than the above-mentioned value of US$ 0.032/g.
Table 11. Cost break-down in US dollars for preparation of 100 g and for 1 g of gold-nitrate activated charcoal/carbon of the current study.
Table 12. Comparison between preparation costs of gold-nitrate activated charcoal/carbon of the current study with other adsorbents.
Conclusion
The current study introduced activated charcoal obtained from “Salix mucronata” trees that are known as “As-Sefsaaf Al-Baladi” (also called “Cape silver willow” or “Safsaf willow”) for the removal of four commonly used pesticides from polluted groundwater. These pesticides are (I) Malathion, (II) Methomyl, (III) Abamectin, and (IV) Thiamethoxam. Activation treatment using gold-nitrate solution was introduced in the current study to enhance the charcoal adsorption capacity. This is because removal of organic pollutants, including pesticides, is greatly difficult due to the large size of their molecules and the lack of obvious electrostatic charges on them.
Using gold-nitrate solution in charcoal activation treatment resulted in adsorption capacities of the activated charcoal at almost 3 times higher than other charcoals that were used to treat the same pesticides at the same initial concentrations. At initial concentrations of 50.0 mg/l, adsorption capacities in the current study for (I) Malathion and (II) Methomyl were 16.17 and 14.59 mg/g, as compared to other studies at 4.88 and 5.07 mg/g, respectively. Treatment time in fixed-bed columns under steady flow was at 1.0–3.0 h, as compared to 13.33 h of another study which used much lower initial concentration. Preparation cost of gold-nitrate activated charcoal in the current study was US$ 0.032/g, as compared to other adsorbents that cost from US$ 0.09 to 0.7037, or even higher. It is concluded that this new material of gold-nitrate activated charcoal is recommended for use in low-cost removal of pesticides from polluted groundwater.
Disclosure statement
No potential conflict of interest was reported by the author(s).
References
- www.micromeritics.com/Repository/Files/Gas_Adsorption_Theory_poster.pdf
- Abdelhameed, R. M., Abdel-Gawad, H., & Emam, H. E. (2021). Macroporous Cu-MOF@ cellulose acetate membrane serviceable in selective removal of dimethoate pesticide from wastewater. Journal of Environmental Chemical Engineering, 9(2), 105121. doi:10.1016/j.jece.2021.105121
- Abdelhameed, R. M., & Emam, H. E. (2022). Modulation of metal organic framework hybrid cotton for efficient sweeping of dyes and pesticides from wastewater. Sustainable Materials and Technologies, 31, e00366. doi:10.1016/j.susmat.2021.e00366
- Ahmed, A. S., Alsultan, M., Sabah, A. A., & Swiegers, G. F. (2023). Carbon dioxide adsorption by a high-surface-area activated charcoal. Journal of Composites Science, 7(5), 179. doi:10.3390/jcs7050179
- Attia, A. A., Khedr, S. A., & Elkholy, S. A. (2010). Adsorption of chromium ion (VI) by acid activated carbon. Brazilian Journal of Chemical Engineering, 27(1), 183–193. doi:10.1590/S0104-66322010000100016
- Ayawei, N., Ebelegi, A. N., & Wankasi, D. (2017). Modelling and interpretation of adsorption isotherms. Journal of Chemistry, 2017, 1–11. Article ID 3039817. 10.1155/2017/3039817
- Chakraborty, A., Pal, A., & Saha, B. B. (2022). A critical review of the removal of radionuclides from wastewater employing activated carbon as an adsorbent. Materials, 15(24), 818. doi:10.3390/ma15248818
- Chang, C. F., Chang, C. Y., Hsu, K. E., Lee, S. C., & Höll, W. (2008). Adsorptive removal of the pesticide methomyl using hypercrosslinked polymers. Journal of Hazardous Materials, 155(1–2), 295–304. doi:10.1016/j.jhazmat.2007.11.057
- Cosgrove, S., Jefferson, B., & Jarvis, P. (2019). Pesticide removal from drinking water sources by adsorption: A review. Environmental Technology Reviews, 8(1), 1–24. doi:10.1080/21622515.2019.1593514
- Crowe, G. T., Almuhtaram, H., Andrews, R. C., & McKie, M. J. (2022). Granular activated carbon caps-A potential treatment barrier for drinking water cyanotoxins. Journal of Water Process Engineering, 49, 102977. doi:10.1016/j.jwpe.2022.102977
- Deng, H., Zhang, G., Xu, X., Tao, G., & Dai, J. (2010). Optimization of preparation of activated carbon from cotton stalk by microwave assisted phosphoric acid-chemical activation. Journal of Hazardous Materials, 182(1–3), 217–224. doi:10.1016/j.jhazmat.2010.06.018
- Derbyshire, F., Jagtoyen, M., & Thwaites, M. (1995). Porosity in carbons (p. 227). London: Edward Arnold.
- Dwiyaniti, M., Barruna, A. E., Naufal, R. M., Subiyanto, I., Setiabudy, R., & Hudaya, C. (2020, December). Extremely high surface area of activated carbon originated from sugarcane bagasse. In IOP Conference Series: Materials Science and Engineering, 909(1), 012018. doi:10.1088/1757-899X/909/1/012018
- El-Baz, A. A. A., Hendy, I. A., Dohdoh, A. M., & Srour, M. I. (2020). Adsorption technique for pollutants removal; current new trends and future challenges–A review. The Egyptian International Journal of Engineering Sciences and Technology, 32(1), 1–24. doi:10.21608/eijest.2020.45536.1015
- El-Gendy, K. S., Radwan, M. A., Gad, A. F., Khamis, A. E., & Eshra, E. H. (2019). Use of multiple endpoints to investigate the ecotoxicological effects of abamectin and thiamethoxam on Theba pisana snails. Ecotoxicology & Environmental Safety, 167, 242–249. doi:10.1016/j.ecoenv.2018.10.027
- EL-Kabbany, S. M., EL-Marsafy, A. M., Mohamed, G. G., & Saadieh, M. M. (2013). Residues and pre harvest interval of abamectin, diniconazole, methomyl and phenthoate in sweet pepper under greenhouse conditions. Journal of Plant Protection and Pathology, 4(12), 1025–1033. doi:10.21608/jppp.2013.87670
- El-Kammah, M., Elkhatib, E., Gouveia, S., Cameselle, C., & Aboukila, E. (2022). Enhanced removal of thiamethoxam from wastewater using waste-derived nanoparticles: Adsorption performance and mechanisms. Environmental Technology & Innovation, 28, 102713. doi:10.1016/j.eti.2022.102713
- Emam, H. E., Ahmed, H. B., & Abdelhameed, R. M. (2021). Melt intercalation technique for synthesis of hetero-metallic@ chitin bio-composite as recyclable catalyst for prothiofos hydrolysis. Carbohydrate Polymers, 266, 118163. doi:10.1016/j.carbpol.2021.118163
- Fu, C. C., Juang, R. S., Huq, M. M., & Hsieh, C. T. (2016). Enhanced adsorption and photodegradation of phenol in aqueous suspensions of titania/graphene oxide composite catalysts. Journal of the Taiwan Institute of Chemical Engineers, 67, 338–345. doi:10.1016/j.jtice.2016.07.043
- Gandolfi, S., Ottolina, G., Riva, S., Fantoni, G. P., & Patel, I. (2013). Complete chemical analysis of carmagnola hemp hurds and structural features of its components. BioResources, 8(2), doi:10.15376/biores.8.2.2641-2656
- Gonzalez, J. F., Roman, S., González-García, C. M., Nabais, J. V., & Ortiz, A. L. (2009). Porosity development in activated carbons prepared from walnut shells by carbon dioxide or steam activation. Industrial & Engineering Chemistry Research, 48(16), 7474–7481. doi:10.1021/ie801848x
- Gottipati, R., 2012. Preparation and characterization of microporous activated carbon from biomass and its application in the removal of chromium (VI) from aqueous phase. Ph.D. Thesis, National Institute of Technology, Rourkela- Odisha, India.
- Hathout, A., Amer, M., Hussain, O., Yassen, A. A., Mossa, A. T. H., & Elgohary, M. R. (2022). Estimation of the most widespread pesticides in agricultural soils collected from some Egyptian governorates. Egyptian Journal of Chemistry, 65(1), 35–44. doi:10.21608/ejchem.2021.72087.3591
- Health Canada. 2023a. Canadian drinking water quality: Malathion. Guideline Technical Document. Cat.: H144-13/26-2022E-PDF, ISBN: 978-0-660-46023-9, Pub.: 220517.
- Health Canada. 2023b. Health Canada pest management regulatory agency, proposed maximum residue limit: Abamectin. Pest Management Regulatory Agency PMRL2023-17, ISSN: 1925-0843 Catalogue number: H113-24/2023-17E-PDF.
- Health Canada. 2023c. Proposed maximum residue limit PMRL2023-03: Methomyl. Pest Management Regulatory Agency, PMRL2023-03. ISSN: 1925-0843 (online). Catalogue number: H113-24/2023-3E-PDF.
- Horvat, G., Pantić, M., Knez, Ž., & Novak, Z. (2022). A brief evaluation of pore structure determination for bioaerogels. Gels, 8(7), 438. doi:10.3390/gels8070438
- Ilomuanya, M. O., Nashiru, B., Ifudu, N. D., & Igwilo, C. I. (2017). Effect of pore size and morphology of activated charcoal prepared from midribs of Elaeis guineensis on adsorption of poisons using metronidazole and Escherichia coli O157: H7 as a case study. Journal of Microscopy and Ultrastructure, 5(1), 32–38. doi:10.1016/j.jmau.2016.05.001
- Jjagwe, J., Olupot, P. W., Menya, E., & Kalibbala, H. M. (2021). Synthesis and application of granular activated carbon from biomass waste materials for water treatment: A review. Journal of Bioresources & Bioproducts, 6(4), 292–322. doi:10.1016/j.jobab.2021.03.003
- Jusoh, H. H. W., Juahir, H., Nasir, N. M., Kurniawan, S. B., Jusoh, A., & Mahiddin, N. A. (2023). Granular activated carbon optimization for enhanced environmental disaster resilience and malathion removal from agricultural effluent. In E3S web of conferences (Vol. 437, p. 03006). EDP Sciences. doi:10.1051/e3sconf/202343703006
- Kalsoom, S., Ullah, R., Adil, M., Waheed, A., Khan, K. A. … Rahim, F. (2022). Adsorption of pesticides using wood-derived biochar and granular activated carbon in a fixed-bed column system. Water, 14(19), 2937. doi:10.3390/w14192937
- Kenawy, A., & Sharaf, M. (2008). Comparative toxicity study between some organophosphorus and Abamectin insecticides using earthworm (Lumbricus terrestirs) as a biomarker. Alexandria Science Exchange Journal, 29, 123–129.
- Khandaker, S., Kuba, T., Toyohara, Y., Kamida, S., & Uchikawa, Y. (2017). Development of ion-exchange properties of bamboo charcoal modified with concentrated nitric acid. IOP Conference Series: Earth and Environmental Science, 82(1), 012002. doi:10.1088/1755-1315/82/1/012002
- Khattab, G. M., Abdelghany, W., Abdelmegeed, M. I., & Attalah, I. (2020). Monitoring of counterfeit abamectin pesticide products in Egypt. Arab Universities Journal of Agricultural Sciences, 28(2), 601–615. doi:10.21608/ajs.2020.21756.1146
- Kishibayev, K. K., Serafin, J., Tokpayev, R. R., Khavaza, T. N., Atchabarova, A. A. … Sreńscek-Nazzal, J. (2021). Physical and chemical properties of activated carbon synthesized from plant wastes and shungite for CO2 capture. Journal of Environmental Chemical Engineering, 9(6), 106798. doi:https://doi.org/10.1016/j.jece.2021.106798
- Kodali, J., Talasila, S., Arunraj, B., & Nagarathnam, R. (2021). Activated coconut charcoal as a super adsorbent for the removal of organophosphorous pesticide monocrotophos from water. Case Studies in Chemical and Environmental Engineering, 3, 100099. doi:10.1016/j.cscee.2021.100099
- Kwon, S. M., Jang, J. H., Lee, S. H., Park, S. B., & Kim, N. H. (2013). Change of heating value, pH and FT-IR spectra of charcoal at different carbonization temperatures. Journal of the Korean Wood Science and Technology, 41(5), 440–446. doi:10.5658/WOOD.2013.41.5.440
- Laskar, N., & Kumar, U. (2018). Adsorption of crystal violet from wastewater by modified Bambusa tulda. KSCE Journal of Civil Engineering, 22(8), 2755–2763. doi:10.1007/s12205-017-0473-5
- Liu, H., Su, Y., Liu, C., Zhou, A., Chu, X. … Tang, E. (2021). Practical and sustainable modification method on activated carbon to improve the decolorization process in the acetaminophen pharmaceutical industry. ACS Omega, 6(8), 5451–5462. doi:10.1021/acsomega.0c05637
- Liu, X., Zhang, H., Ma, Y., Wu, X., Meng, L. … Liu, Y. (2013). Graphene-coated silica as a highly efficient sorbent for residual organophosphorus pesticides in water. Journal of Materials Chemistry A, 1(5), 1875–1884. doi:10.1039/C2TA00173J
- Luo, W., Xiao, G., Tian, F., Richardson, J. J., Wang, Y. … Shi, B. (2019). Engineering robust metal–phenolic network membranes for uranium extraction from seawater. Energy & Environmental Science, 12(2), 607–614. doi:10.1039/C8EE01438H
- Mahamad, M. N., Zaini, M. A. A., & Zakaria, Z. A. (2015). Preparation and characterization of activated carbon from pineapple waste biomass for dye removal. International Biodeterioration & Biodegradation, 102, 274–280. doi:10.1016/j.ibiod.2015.03.009
- Mahmoud, A. S., Mostafa, M. K., & Nasr, M. (2019). Regression model, artificial intelligence, and cost estimation for phosphate adsorption using encapsulated nanoscale zero-valent iron. Separation Science and Technology, 54(1), 13–26. doi:10.1080/01496395.2018.1504799
- Mansour, A. A. (2009). Evaluation the efficiency of some insecticides and mineral oils against the wheat aphid on turfgrass. Egyptian Journal of Agricultural Research, 87(2), 359–364. doi:10.21608/ejar.2009.193335
- Minnesota Department of Health; USA. (2016). Thiamethoxam and drinking water, Minnesota Department of Health, Health Risk Assessment Unit, PO Box 64975, St. Paul MN 55164 651-201-4899. https://www.health.state.mn.us/communities/environment/risk/docs/guidance/gw/thiamethinfo.pdf
- Mopoung, S., Moonsri, P., Palas, W., & Khumpai, S. (2015). Characterization and properties of activated carbon prepared from tamarind seeds by KOH activation for Fe (III) adsorption from aqueous solution. Scientific World Journal, 2015, 1–9. doi:10.1155/2015/415961
- Munajad, A., Subroto, C., & Suwarno, S. (2018). Fourier transform infrared (FTIR) spectroscopy analysis of transformer paper in mineral oil-paper composite insulation under accelerated thermal aging. Energies, 11(2), 364. doi:10.3390/en11020364
- Murphy, O. P., Vashishtha, M., Palanisamy, P., & Kumar, K. V. (2023). A review on the adsorption isotherms and design calculations for the optimization of adsorbent mass and contact time. ACS Omega, 8(20), 17407–17430. doi:10.1021/acsomega.2c08155
- Nerdy, N., Meliala, L., Sinaga, J. P., Ginting, S., De Lux Putra, E., & Bakri, T. K. (2023, January). Adsorbent activity of pectin and activated charcoal from pineapple peel waste as biosorbent against heavy metals and dyes. Frontiers in Physics, 2613(1), 040003-1 – 040003-7, AIP Publishing.
- Omri, H., & Batis, N. H. (2013). Removal of cd (II) from phosphoric acid solution by adsorbents: Equilibrium and kinetic studies. Chemical Science Transactions, 2(2), 357–366. doi:10.7598/cst2013.285
- O’Neil, M. J. (2013). The Merck Index: An encyclopedia of chemicals, drugs, and biologicals (15th ed.). Cambridge, UK: Royal Society of Chemistry. ISBN 9781849736701.
- Ormad, M. P., Miguel, N., Claver, A., Matesanz, J. M., & Ovelleiro, J. L. (2008). Pesticides removal in the process of drinking water production. Chemosphere, 71(1), 97–106. doi:10.1016/j.chemosphere.2007.10.006
- Pap, S., Kirk, C., Bremner, B., Sekulic, M. T., Shearer, L., Gibb, S. W., & Taggart, M. A. (2020). Low-cost chitosan-calcite adsorbent development for potential phosphate removal and recovery from wastewater effluent. Water Research, 173, 115573. doi:10.1016/j.watres.2020.115573
- Paredes, A. M. (2014). Microscopy| Scanning electron microscopy. In Encyclopedia of food microbiology 2nd, (pp. 693–701). Academic Press. ISBN 9780123847331. 10.1016/B978-0-12-384730-0.00215-9
- Peak, D. (2005). Fourier transform infrared spectroscopy. Encyclopedia of Soils in the Environment, 4, 80–85.
- Petrov, N., Budinova, T., Razvigorova, M., Ekinci, E., Yardim, F., & Minkova, V. (2000). Preparation and characterization of carbon adsorbents from furfural. Carbon, 38(15), 2069–2075. doi:10.1016/S0008-6223(00)00063-4
- Praveen, S., Gokulan, R., Pushpa, T. B., & Jegan, J. (2021). Techno-economic feasibility of biochar as biosorbent for basic dye sequestration. Journal of the Indian Chemical Society, 98(8), 100107. doi:10.1016/j.jics.2021.100107
- Qi, G., Pan, Z., Zhang, X., Chang, S., Wang, H. … Gao, B. (2023). Microwave biochar produced with activated carbon catalyst: Characterization and adsorption of heavy metals. Environmental Research, 216, 114732. doi:10.1016/j.envres.2022.114732
- Rajan, S., Parween, M., & Raju, N. J. (2023). Pesticides in the hydrogeo-environment: A review of contaminant prevalence, source and mobilisation in India. Environmental Geochemistry and Health, 45(8), 5481–5513. doi:10.1007/s10653-023-01608-6
- Rosenfeld, P. E., & Feng, L. (2011). Risks of hazardous wastes. William Andrew, Norwich, New Yourk, USA.
- Saleh, I. A., Zouari, N., & Al-Ghouti, M. A. (2020). Removal of pesticides from water and wastewater: Chemical, physical and biological treatment approaches. Environmental Technology & Innovation, 19, 101026. doi:10.1016/j.eti.2020.101026
- Sallam, A. A. A., Aboelkassem, S., Fouad, H. A., & El-Mageed, A. (2018). Efficiency of certain insecticides compared to selected alternatives on onion thrips (Thrips tabaci Lind.) under field conditions. Archives of Agriculture Sciences Journal, 1(1), 58–70. doi:10.21608/aasj.2018.23572
- Saxena, R., Saxena, M., & Lochab, A. (2020). Recent progress in nanomaterials for adsorptive removal of organic contaminants from wastewater. ChemistrySelect, 5(1), 335–353. doi:10.1002/slct.201903542
- Shariq, M., Friedrich, B., Budic, B., Hodnik, N., Ruiz‐Zepeda, F., Majerič, P., & Rudolf, R. (2018). Successful synthesis of gold nanoparticles through ultrasonic spray pyrolysis from a gold (III) nitrate precursor and their interaction with a high electron beam. ChemistryOpen, 7(7), 533–542. doi:10.1002/open.201800101
- Shukla, S. K., Bernard, K. A., Harney, M., Frank, D. N., & Reed, K. D. (2003). Corynebacterium nigricans sp. nov.: Proposed name for a black-pigmented Corynebacterium species recovered from the human female urogenital tract. Journal of Clinical Microbiology, 41(9), 4353–4358. doi:10.1128/JCM.41.9.4353-4358.2003
- Suo, F., Liu, X., Li, C., Yuan, M., Zhang, B. … Ji, M. (2019). Mesoporous activated carbon from starch for superior rapid pesticides removal. International Journal of Biological Macromolecules, 121, 806–813. doi:10.1016/j.ijbiomac.2018.10.132
- Trivedi, N. S., & Mandavgane, S. A. (2018). Fundamentals of 2,4 dichlorophenoxyacetic acid removal from aqueous solutions. Sep. Separation & Purification Reviews, 47(4), 337–354. doi:10.1080/15422119.2018.1450765
- Tyagi, P. K., Gupta, S., Tyagi, S., Kumar, M., Pandiselvam, R., Daştan, S.D., Sharifi-Rad, J., Gola, D. and Arya, A. (2021). Green synthesis of iron nanoparticles from spinach leaf and banana peel aqueous extracts and evaluation of antibacterial potential. Journal of Nanomaterials, 2021, 1–11. doi:10.1155/2021/4871453
- Xiao, F., Bedane, A. H., Mallula, S., Sasi, P. C., Alinezhad, A. … Mann, M. D. (2020). Production of granular activated carbon by thermal air oxidation of biomass charcoal/biochar for water treatment in rural communities: A mechanistic investigation. Chemical Engineering Journal Advances, 4, 100035. doi:10.1016/j.ceja.2020.100035
- Yuan, J., Mortazavian, S., Passeport, E., & Hofmann, R. (2022). Evaluating perfluorooctanoic acid (PFOA) and perfluorooctanesulfonic acid (PFOS) removal across granular activated carbon (GAC) filter-adsorbers in drinking water treatment plants. The Science of the Total Environment, 838, 156406. doi:10.1016/j.scitotenv.2022.156406